Saturday, August 26, 2023

Mason Square

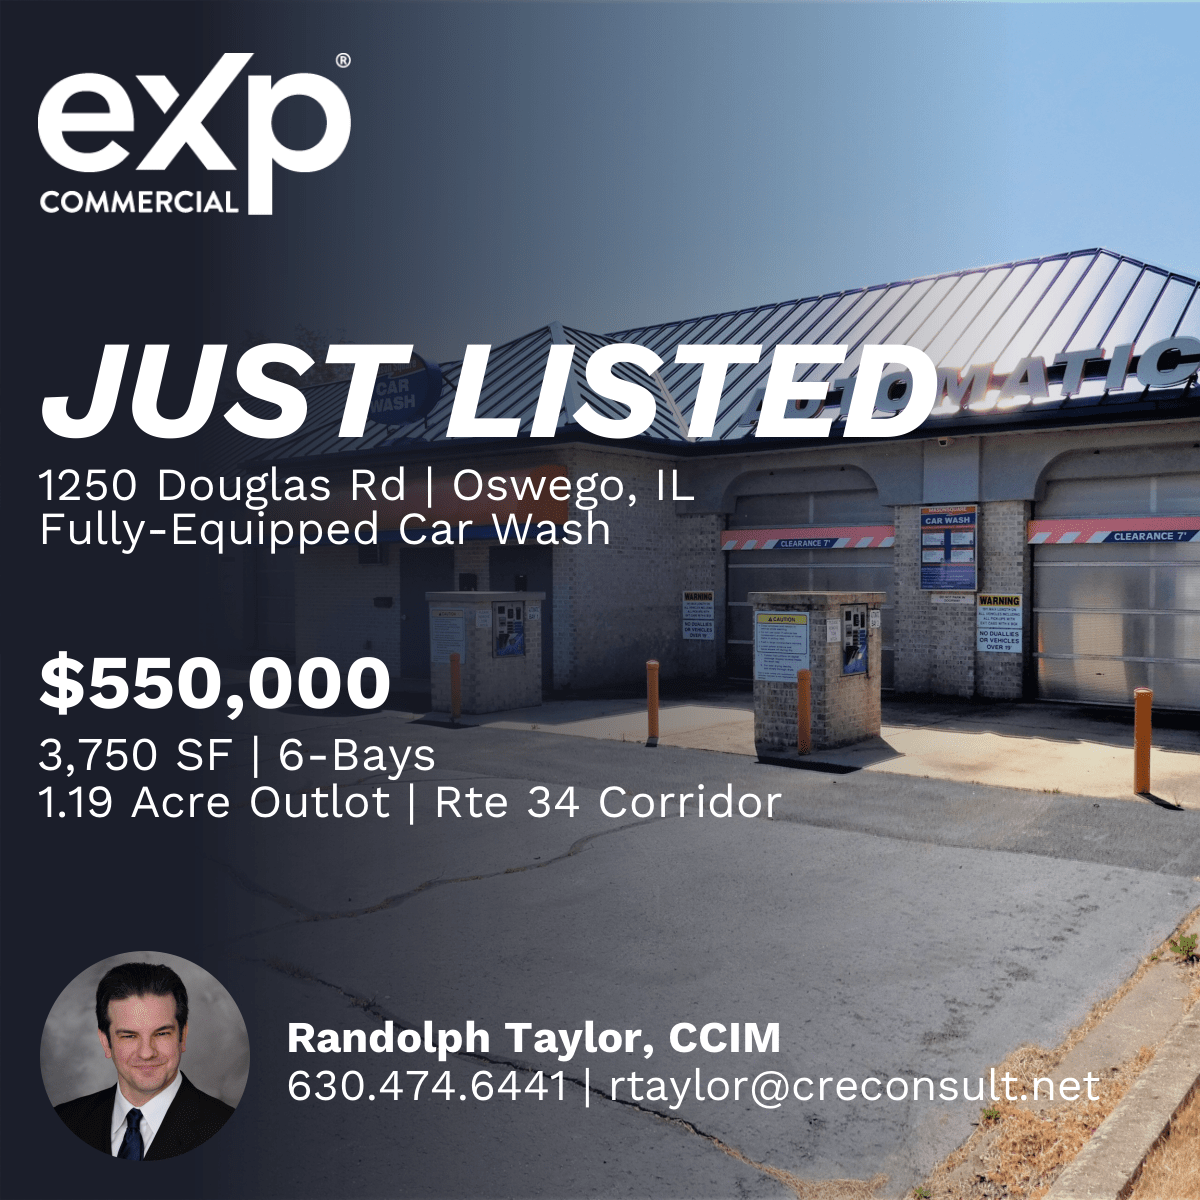
Fully Equipped Car Wash For Sale
1250 Douglas Rd. | Oswego, IL | 3,750 SF | 6 Bays | 1.19 Acres
Mason Square Car Wash, a fully equipped and operational 6-bay carwash in southwest suburban Chicago’s Oswego, IL. Ideally located on an out-lot of the Mason Square Shopping Center along heavily trafficked Route 34, averaging 45,000 vehicles per day,
Listing Agent: Randolph Taylor 630.474.6441 | rtaylor@creconsult.net
https://www.creconsult.net/fully-equipped-car-wash-oswego-il-route-34/

How To Determine The Highest and Best Use of a Property

The concept of highest and best use is one of the fundamental principles that underlie real estate appraisal. Highest and best use requires that the appraisal considers not just the current use of the property but also the potential value associated with alternative uses. The Appraisal Institute has four tests that appraisers can use in order to narrow down all of the alternatives to one highest and best use of the property.

Four Tests for Highest and Best Use

You can use the following four tests to find the highest and best use of a site as if vacant or currently improved.

1. Is the use physically possible?

The first test of highest and best use simply evaluates whether it is possible to use the land in a certain way. Ignoring the zoning and economics of the proposal, consider whether or not the potential use is physically possible. That means the topography, soil type and conditions, lot size and shape, surface and subsurface water, and even weather patterns must make the development possible. So, you probably can’t build a marina in the middle of the desert, a heavy, marble building on soft clay soil, or a building with a 250,000 square foot base on a 200,000 square foot lot. In addition, an appraiser must not only consider the proposed use of the site but also the characteristics of the optimum improvements for that use. This first test, however, is usually the easiest to pass.

2. Is the use legally permitted?

After eliminating any potential uses that are not physically possible, you can move on to the second test. Whether a potential use is legally permissible involves a few different legal considerations. The proposed use must be allowed by zoning regulations. If building in a residential area with restrictive covenants, the proposed improvements must not violate any rules. The proposed use must conform to all applicable building codes and height limits. In addition, the improvements must adhere to any restrictions imposed by easements on the property.

Determining whether a proposed use is legally permitted requires research into the local building regulations and restrictions. Gaining a comprehensive understanding of the applicable legal requirements can be time-consuming, but it is fairly easy to determine whether or not a proposal violates any of these regulations. Concluding whether or not something is legally permissible is a straightforward process. Regulations, however, change over time. An area that was zoned for residential development can be changed to commercial development. Just because a proposed development is not legally permissible does not mean that it will always be that way. In these cases, an appraiser must consider the probability of the legal restriction being changed to allow the proposed development. In these cases, there should be substantial documentation suggesting that the regulation will be changed in order to pass to the third test of highest and best use.

3. Would the use be financially feasible?

To address whether a proposed use is financially feasible, you need to conduct a market analysis and develop proforma cash flow estimates. You’ll need to collect data in order to forecast construction and development expenses, operating expenses, rents, absorption rates, vacancy rates, discount rates, cap rates, and residual values. Once you’ve gathered all of this information, you will estimate the proforma net operating income over your expected holding period. Employing discounted cash flow techniques, you can determine which projects meet your particular investment standards. Discounting cash flows by your cost of capital and computing the net present value, a project is considered financially feasible if the NPV is greater than 0. You can also compute the internal rate of return and compare the property’s return to your acceptable hurdle rate for projects. Only the proposed property uses that meet these criteria for being financially feasible move to the next step of the analysis.

4. Would the use be maximally productive?

The prior steps eliminated proposed uses that were not physically possible, legally permissible, or financially feasible. This final step takes all of the proposed uses that meet these requirements and ranks them in order of value or rate of return. While ranking proposed uses, it is also helpful to consider the risk associated with the proposed use. For example, one proposed use might generate a much higher internal rate of return than all of the other proposed uses. Yet, the reason for the high return may be related to the higher risk of that project. One way to adjust for the risk associated with a proposed use is to apply a discount rate that is commensurate with the level of risk while computing the net present value. In the end, the proposed use with the highest internal rate of return and net present value is the maximally productive use.

Applying Highest and Best Use to an Existing Structure

To illustrate how highest and best use works in practice, consider an old 1920s brick building in the central business district of a small city. Business and residents moved away from the area, and its current use as retail space may no longer be the highest and best use of the property. It is a 15,000 square foot building, and its estimated value as vacant land is $10/sqft, or $150,000.

In its current use as retail space, the property generates rent of $12/sqft. Vacancy rates are around 11% since foot traffic generally doesn’t support retail business in the area. Operating costs are $34,000 per year. Since conditions are fairly stable, capitalizing next year’s income at a rate of 9% yields an estimated property value of $1,402,222.

Another alternative would be to renovate the property and convert it into office space. Market research indicates this is a desirable area for professional office such as attorneys, accountants, architects, and designers. Market rent for offices in this area is $21 per square foot and has been increasing by 2% annually. Operating costs average $5/sqft and increase by $0.25 per year. Converting the property into office space will cost $850,000 in the first year, and average vacancy during the year will be 75% due to the time of the renovations. Vacancy is 20% in year 2 and then settles into a constant 5% thereafter. The resale price of $2,629,402 at the end of the 5-year holding period is calculated by dividing year 6 NOI by a 9% cap rate. The net present value of cash flows discounted at a rate of 10% yields a property value of $1,485,848.

Highest and best use analysis evaluates each potential use of the property and its corresponding value. The vacant property is valued at $150,000. Continuing to use the property for retail space yields an estimated value of $1,402,222. Converting the property into office space results in a value of $1,485,848. Highest and best use analysis, therefore, concludes that the best use of the property is as office space

Conclusion

In this article, we discussed the 4 tests for highest and best use. These 4 tests ask if the proposed use is 1) physically possible, 2) legally permitted, 3) financially feasible, and 4) maximally productive. We then walked through an example of how to apply highest and best use theory to evaluate a property with three potential uses: as vacant land, as an existing structure, and as renovated. via bookmarklet


Source: How To Determine The Highest and Best Use of a Property

https://www.creconsult.net/market-trends/how-to-determine-the-highest-and-best-use-of-a-property/

Friday, August 25, 2023

How to Calculate the Cap Rate

The cap rate is an important concept in commercial real estate, and it is widely used. There is often confusion about how to calculate the cap rate using various methods. The purpose of this article is to demonstrate several ways to calculate the cap rate.

How to Calculate the Cap Rate Ratio

Perhaps the simplest place to start is to calculate the actual cap rate ratio. The cap rate ratio is just net operating income (NOI) divided by value, so if we know what a property’s net operating income is, and we also know what a property’s value is, then we can easily calculate the cap rate.

For example, suppose we know that a property has an NOI of $100,000 and a value of $1,000,000. Then we can calculate a cap rate by dividing $100,000 by $1,000,000:

This results in a cap rate of 10%.

How to Calculate the Cap Rate with Sales Comps

Since a property’s value is often what we don’t know, it is common to simply divide our known net operating income by a market-based cap rate. This will tell us what a property’s value is.

Calculating a property’s net operating income is easy enough, but if we don’t know what the market-based cap rate is, then how do we calculate it?

One approach is to find comparable properties that have recently sold. Then we can take those comparable sale prices and calculate a cap rate. For example, suppose we observe the following recent sales of similar properties:

Based on our knowledge of the local market, we might decide to simply average all three of these cap rates to get a market-based cap rate of 8.33%. Now we can use this market-based cap rate to figure out a value for our property. If our property has an NOI of $100,000 then we can find its value like this:

This is the expected market value of our property using the direct capitalization method, based on recent comparable sales we observed in the local market.

How to Calculate the Cap Rate With The Band of Investment Method

Sometimes there aren’t any recent comparable sales to use to calculate a cap rate. One other approach commercial real estate appraisers use is called the band of investment method. This allows us to calculate a cap rate based on market-based loan terms as well as the investor’s required return. Appraiser’s usually find this information by surveying local lenders and investors and asking them what their current requirements are.

For example, suppose we survey local lenders and ask them what their typical loan terms are for a property similar to ours. We find out that we can get a loan at a 75% loan to value ratio, amortized over 20 years, at 6%.

We can now use this loan information to calculate a mortgage constant of 0.085972.

Likewise, suppose we survey local investors and find out that they would on average require an 11% cash on cash rate of return for investing in a property similar to the one we are evaluating.

Now we have all the information we need to estimate a cap rate using the band of investment method. To accomplish this, we simply take a weighted average of the return to the typical lender and the return to the typical investor. In this case, it is (75% * 0.085972) + (25% * 11%), which equals 0.06448 + .02750, or 9.20%. This is our market-based cap rate using the band of investment method.

How to Calculate the Cap Rate Using the Discount Rate

Another way to calculate the cap rate is based on the relationship between the cap rate and the discount rate. When income and value grow at a constant rate, then the discount rate is equal to the cap rate plus the growth rate. This idea comes from the dividend discount model, also known as the Gordon Model, which is used to value a stock.

We can re-arrange this equation to solve for cap rate, which says that the cap rate is equal to the discount rate minus the growth rate:

So, if we know the required rate of return (discount rate) for a property, and we also know the expected growth rate for the property’s NOI, then we can calculate the cap rate. For example, suppose we know the discount rate is 12% and the NOI growth rate is expected to be 3%. This is how we can estimate the cap rate:

The cap rate is calculated as 12% minus 3%, or 9%.

Conclusion

In this article, we discussed several ways to calculate the cap rate. First, we talked about how to calculate the simple capitalization rate ratio when you know both the NOI and the value of a property. Next, we discussed how to estimate the cap rate when you don’t know the value of a property. This can be done by finding cap rates for recent sales of comparable properties.

Sometimes there aren’t any comparable properties to extract a market-based cap rate from. When this happens, commercial real estate appraisers often use the band of investment method to calculate a cap rate. This involved surveying lenders and investors to ultimately calculate a cap rate based on a weighted average of these lender and investor return expectations. Finally, we covered the relationship between the cap rate and the discount rate and walked through an example of how the cap rate can be calculated based on the discount rate and the expected growth rate of net operating income.


Source: How to Calculate the Cap Rate

https://www.creconsult.net/market-trends/how-to-calculate-the-cap-rate/

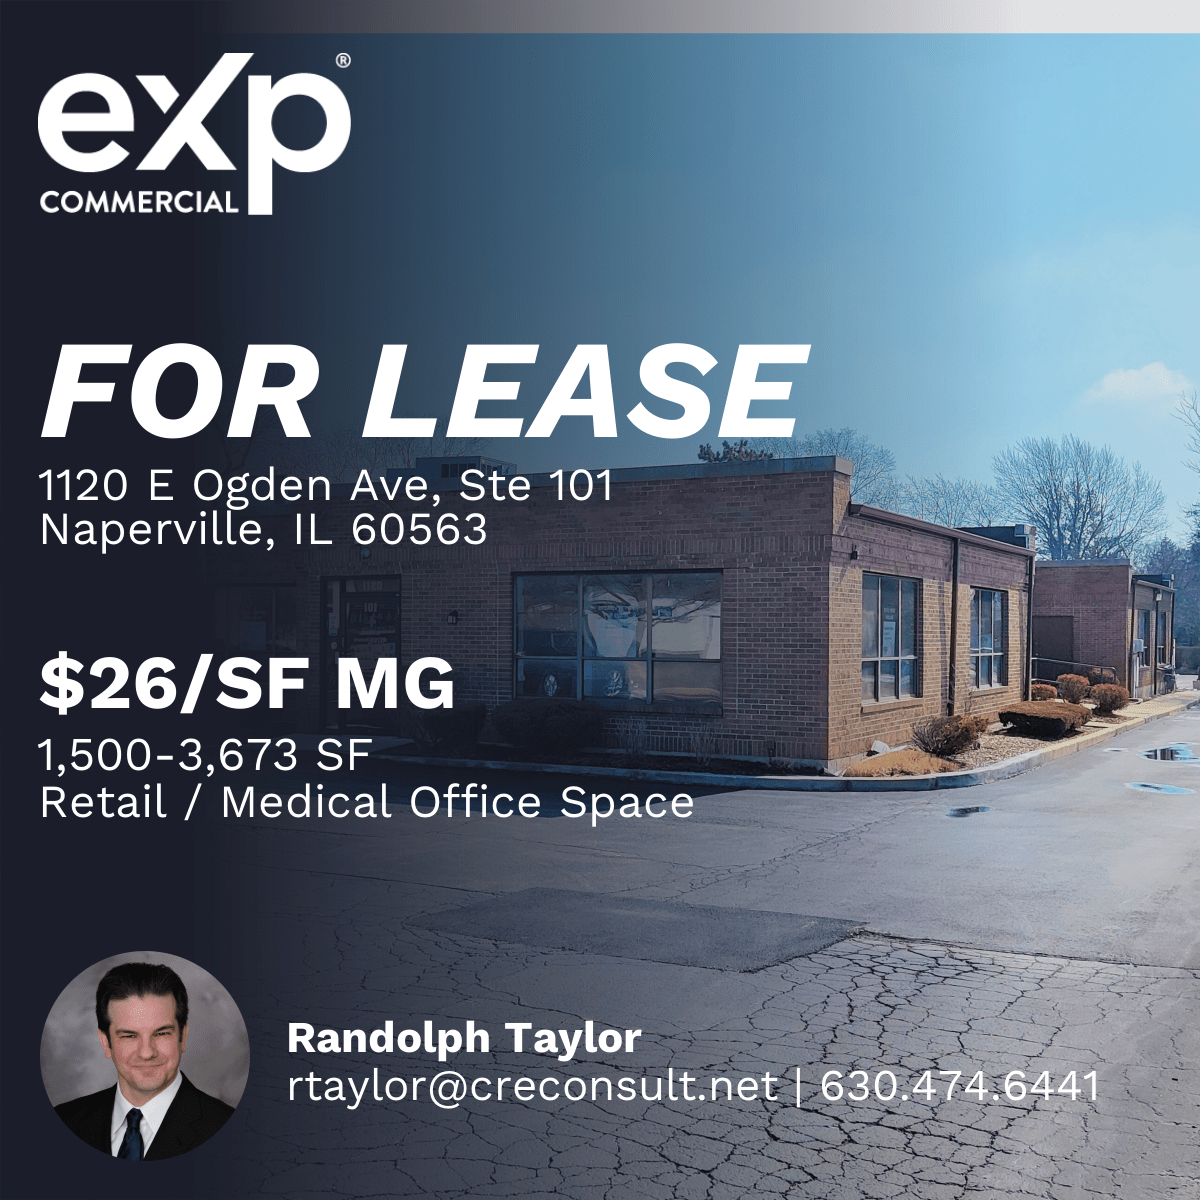
1120 E Ogden

Retail / Medical Office Space for lease in Naperville, IL
1,500–3,673 SF | $26/SF MG
1120 E Ogden Ave., Suite 101, Naperville, IL 60563
Broker: Randolph Taylor, rtaylor@creconsult.net, 630.474.6441

https://www.creconsult.net/retail-office-for-lease-1120-e-ogden-ave-suite-101-naperville-il-60563/

Thursday, August 24, 2023

Multifamily sellers: How to qualify a buyer before going under contract

Multifamily sellers: How to qualify a buyer before going under contract

Multifamily sellers: How to qualify a buyer before going under contract

Don’t waste time and opportunities: learn how to select the right buyer every time

As the seller of a multifamily asset, it’s crucial that the buyer you select is the best possible prospect for your property. Don’t waste time, money, and opportunities: you must ensure they’re qualified and can close and execute the contract as signed.

Keep reading to learn why it’s essential to qualify a buyer before going under contract on your multifamily property and how to do it.

Why do I need to qualify a buyer?

It’s important to close with the first buyer you select. If you don’t, each buyer after that will ask themselves, “What did that other buyer discover about this property that I am missing?”.

When you enter into a contract with a refundable deposit, you’re basically giving your chosen buyer a free option on your property for a period of time, typically 30–60 days. Before you proceed, you must be confident that they can close and execute the contract as signed.

What’s more, your tenants and staff will be disturbed throughout the contract process. To minimize the period of disruption, you should do all you can to ensure the transaction will close successfully at the end of the contract process.

As a seller, you’re required to provide due diligence information to the prospective buyer. When you qualify your buyer, you’ll greatly reduce the risk of wasting a lot of time and doing a lot of work only to not close on the property.

How do I qualify a buyer?

Before you sign the contract, make sure that your prospective buyer can provide certain items. Always ask them for the following:

– Proof of funds

– Lender pre-qualification

– A list of the other properties they own

– A list of the sellers and agents that they have worked with

For added reassurance, it’s recommended that you call the buyer’s lender to confirm their pre-qualified status. You can also call the agents, sellers, and buyers they’ve closed with in the past to enquire about how the transactions went.

Has the buyer toured the property in person before making an offer? Have they reviewed the due diligence information beforehand? If they have, this is a great sign. It’s proof that they have seen and have taken into account any issues with your property, and this greatly reduces the chances that they may later want to back out of the sale, saying they were unaware of the building’s condition. Be very wary of a buyer who doesn’t tour your property in person.

A prospective buyer who shows they’re motivated and wants to move quickly is also a great sign for a successful closing. The shorter the due diligence period, the better, and the larger the deposit, the better.

When you spend the time making sure your prospective buyer fulfills these criteria, you’ll put yourself in a great position to close successfully and ensure a quick and smooth transaction.

If you need help selling your multifamily property, eXp Commercial is here. Our objective as your multifamily advisor is to help you achieve your investment goals: from determining the listing price to selecting the best buyer and handling the sale process through to the closing, we’ll facilitate a smooth transaction for you.


Source: Multifamily sellers: How to qualify a buyer before going under contract

https://www.creconsult.net/market-trends/multifamily-sellers-how-to-qualify-a-buyer-before-going-under-contract/

How to Analyze Supply and Demand For Apartment Buildings

One of the most important ways to use all of the data gathered in a real estate market analysis is to examine the supply and demand factors for a particular type of real estate. For example, an investor considering the construction or purchase of a new multifamily residential property uses the market analysis to determine what cash flows they can expect to receive given the expected demand for units. The demand must be high enough to generate cash flows that provide a rate of return high enough to make the investment feasible.

In order to estimate the demand for multifamily housing units, it is necessary to understand recent population growth trends for the city. Then, it’s important to consider the major industries in the market area and the forecasted growth for those industries over the next few years. You can then put this information together to forecast multifamily housing demand and compare that demand to the existing and proposed supply of multifamily units. This case study takes data about population and industrial activity in the Orlando, Florida region and analyzes supply and demand of multifamily residential units in the region.

Recent data from the U.S. Census Bureau and the Orlando Economic Development Commission lists the total population of the Orlando metro area at 2,387,138 (2016). Between 2015 and 2016, the population of the Orlando metro area grew by 2.6%. That made Orlando the fastest growing region in the United States. The Orlando Economic Development Commission estimates that population growth in the region since 2000 equates to a gain of 138 people per day. Population growth is mostly fueled by domestic migration. Americans moving to Orlando for retirement in warmer weather or for new career opportunities account for about 40% of the population increase. International migration (mainly from Central and South America) accounts for 34% of the increase in population. People have been moving to the Orlando area due to the region’s comparative advantages (climate, entertainment and lifestyle, and economic growth). Without these advantages, Orlando would not be one of the fastest growing regions of the country.

With an average household size around 2.5, that means there are an estimated 954,855 households in the Orlando metropolitan area. Data from the American Consumer Survey indicates that about 43% of the population is renters. So, 43% of households would give an estimated demand of 410,588 multifamily units.  In reality, not all renters live in multifamily units since many rent single-family homes. Therefore, it is necessary to estimate how many of those renters occupy multifamily units.

A 2016 report from Fannie Mae estimated that there were 156,000 multifamily units in the Orlando metro area with a 5.75% vacancy rate. So, in 2016 there were around 147,030 occupied multifamily units (156,000 x (1-.0575) = 147,030). This means an estimated 35.8% of the households that are renters occupy multifamily units while the remaining 64.2% of renters occupy single-family homes.

Employment data from the Bureau of Labor Statistics confirms that economic growth is driving the population growth in the Orlando metro area. In fact, job growth from 2015-2016 in Orlando was over twice the national average. A strong economy and growth in the number of jobs indicates that the population should continue to grow over the next few years unless there is a major shift to the national economy or a natural disaster. Furthermore, the job growth rate of 4.22% exceeded the population growth rate of 2.6%. If the major industries in Orlando continue to grow at this pace, more new workers will need to move into the region to fill these new jobs. So, forecasted population growth may be higher than the average of 2% seen over the past 10 years. It might be more appropriate to estimate population growth of at least 3% annually.

  Area Industry Annual Average Employment Change Employment 2015-2016 Growth Rate
2016 U.S. TOTAL Total, all industries 141,870,066 2,378,367 1.71%
  Orlando-Kissimmee-Sanford, FL MSA Total, all industries 1,157,536 46,844 4.22%
2015 U.S. TOTAL Total, all industries 139,491,699    
  Orlando-Kissimmee-Sanford, FL MSA Total, all industries 1,110,692    

Using a Location Quotient Analysis, Orlando has a competitive advantage in the services, construction, and leisure and hospitality industries. All of these industries should remain strong over the next few years as long as the national economy continues to grow and national unemployment remains low.

Industry Location Quotient
Goods-producing 0.664674599
Natural resources and mining 0.330605357
Construction 1.213038593
Manufacturing 0.41740123
Service-providing 1.143132811
Trade, transportation, and utilities 0.99493952
Information 0.983670576
Financial activities 1.092321103
Professional and business services 1.153196509
Education and health services 0.819187622
Leisure and hospitality 1.952753058
Other services 0.993404995
Unclassified 0.13973717

The economic base analysis of the Orlando metro area showed that the region has an economic base multiplier of around 1.5. This means that if one of these base industries created an additional 100 jobs, the entire region would have a resulting total employment increase of 150 jobs. If only leisure and hospitality, services (providing), and professional and business services all created the same number of jobs the following year, it would cause additional job growth of around 28,000. So, there is the possibility for continued high population growth in the region.

Industry Annual Average Employment Change Employment 2015-2016
Total, all industries 1,042,526 43,773
Goods-producing 113,104 7,874
Natural resources and mining 5,052 -324
Construction 66,175 6,884
Manufacturing 41,878 1,314
Service-providing 929,422 35,899
Trade, transportation, and utilities 219,205 7,049
Information 22,448 -292
Financial activities 70,887 1,340
Professional and business services 188,416 10,818
Education and health services 144,734 5,111
Leisure and hospitality 247,860 9,333
Other services 35,563 2,808
Unclassified 310 -266

Apartment Unit Supply and Demand

The simple analysis presented above estimated that the demand for rental units in 2016 was around 147,030. Consider a situation where the Orlando metropolitan area had a supply of 156,000 multifamily units that year and a vacancy rate of 5.75%. If the population grew by 3% per year and the proportion of renters stayed the same, by 2018 the demand for multifamily units would fill all of the existing supply. So, there is clearly a demand for additional multifamily units. How many new units could the market absorb each year?

No new supply
  2016 2017 2018
Total units 156,000 156,000 156,000
Vacant 8,970 4,559 16
Multifamily Renters 147,030 151,441 155,984

With a population growth of 3% and a similar proportion of apartment renters, that would mean the multifamily renting population in the Orlando metro area would grow by between 4,500 and 5,000 units per year. Real estate developers would need to increase the supply of multifamily units by a minimum of 3,250 per year just to meet the housing demand through 2022. Here’s what the forecasted supply and demand would look like if real estate developers delivered 5,000 new apartment units per year:

5,000 new units annually
  2016 2017 2018 2019 2020 2021 2022
Total units 156,000 161,000 166,000 171,000 176,000 181,000 186,000
Multifamily Renters 147,030 151,441 155,984 160,664 165,484 170,448 175,562
Vacant 8,970 9,559 10,016 10,336 10,516 10,552 10,438
Vacancy rate 5.75% 5.94% 6.03% 6.04% 5.98% 5.83% 5.61%

Conclusion

This example provided a simple method for using data from a real estate market analysis to forecast apartment unit demand. A more in-depth forecast would consider actual growth forecasts in key industries, a more detailed look at actual supply and construction permits for multifamily units in the area, and how changing economic factors could influence the percentage of the population that chooses to rent rather than to buy a home. The results from the final chart considering changes in supply and demand over time can also be extended to consider the growth rate of expected market rents. Although the detailed inputs can become more complicated, the basic framework for analysis is the same.


Source: How to Analyze Supply and Demand For Apartment Buildings

https://www.creconsult.net/market-trends/how-to-analyze-supply-and-demand-for-apartment-buildings/

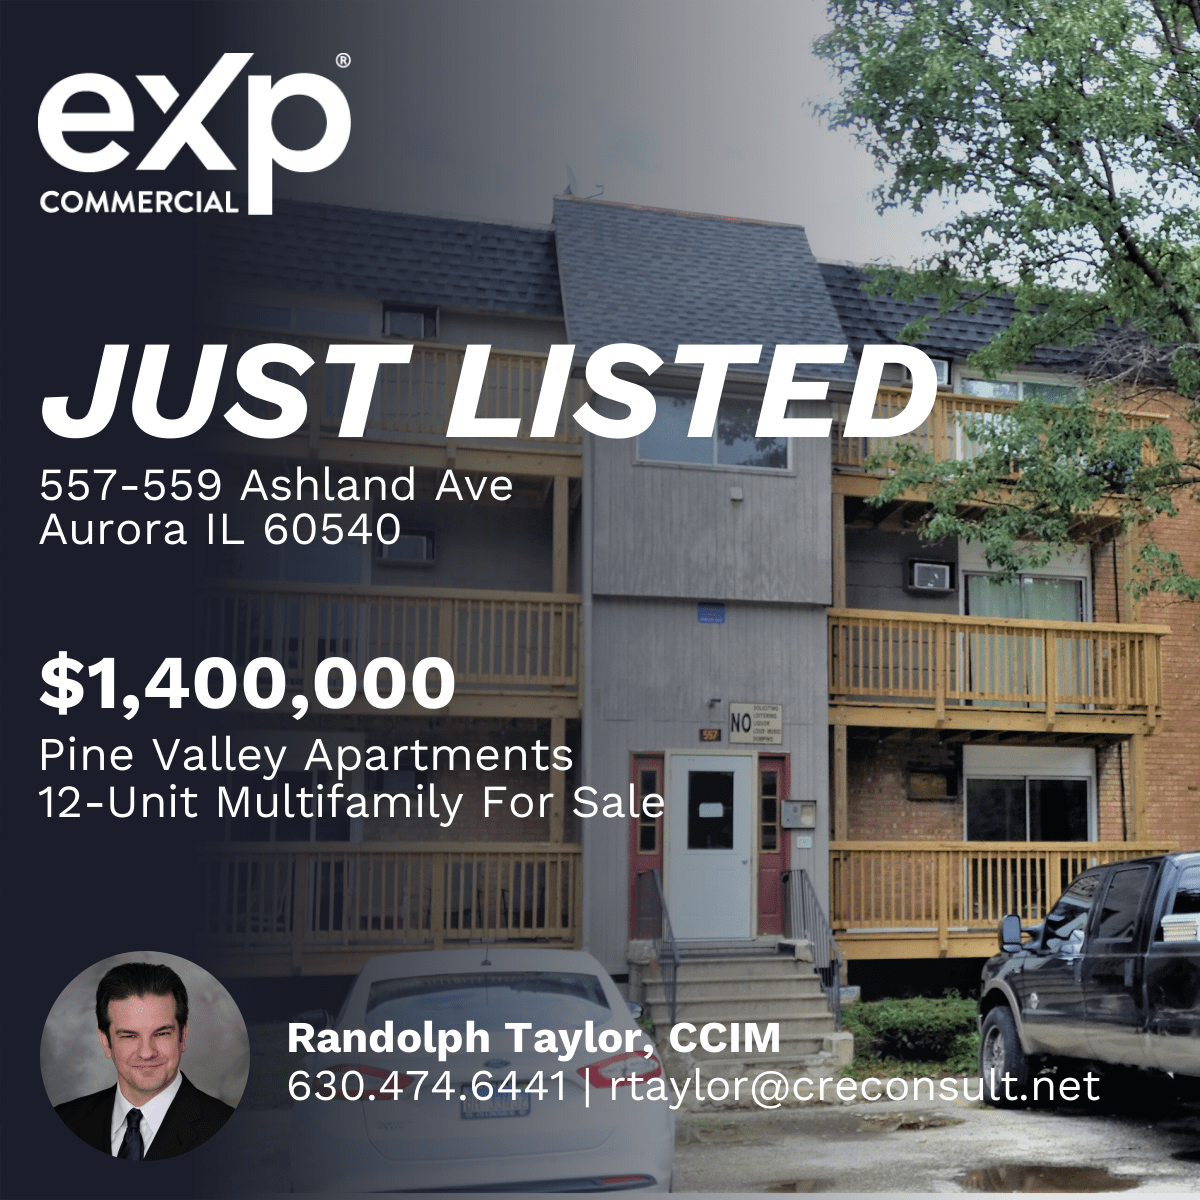
557

Just Listed: 12-Unit Multifamily For Sale
Pine Valley Apartments | Aurora, IL
12-Units | $1.4M | 8.86% Cap Rate (Proforma)
Listing Agent: Randolph Taylor
630.474.6441 | rtaylor@creconsult.net
Listing Site: https://www.creconsult.net/12-unit-multifamily-property-for-sale-aurora-il-pine-valley-apartments/

Price Reduction – 1270 McConnell Rd, Woodstock, IL Now $1,150,000 (Reduced from $1,200,000) This fully occupied 16,000 SF industrial propert...