Thursday, September 28, 2023

Indian Creek Showings

CALL FOR OFFERS: Thursday Sept 28th 12PM
24-Unit Multifamily | Aurora, IL
eXp Commercial is pleased to present to market Indian Creek Apartments, a fully occupied 24-unit multifamily complex on the northeast side of Aurora, Illinois, bordering affluent Naperville, Illinois, just to the east. The property is in good condition, with considerable upside in rents with modest unit updates. All units have separately metered tenant-paid water, sewer, electricity, heat, and hot water. Also offered is an attractive low-interest assumable debt of $1.453 million at a 3.32 percent interest rate not due until December 2028.
Listing Agent: Randolph Taylor, Senior Associate
630.474.6441 | rtaylor@creconsult.net
https://www.creconsult.net/indian-creek-apartments-1015-1025-n-farnsworth-ave-aurora-il-60505/

Friday, September 22, 2023

Indian Creek Showings

Showings: Monday, Sept 25th 12 PM–2 PM
New Listing: 24-Unit Multifamily | Aurora, IL
eXp Commercial is pleased to present to market Indian Creek Apartments, a fully occupied 24-unit multifamily complex on the northeast side of Aurora, Illinois, bordering affluent Naperville, Illinois, just to the east. The property is in good condition, with considerable upside in rents with modest unit updates. All units have separately metered tenant-paid water, sewer, electricity, heat, and hot water. Also offered is an attractive low-interest assumable debt of $1.453 million at a 3.32 percent interest rate not due until December 2028.
Listing Agent: Randolph Taylor, Senior Associate
630.474.6441 | rtaylor@creconsult.net
https://www.creconsult.net/indian-creek-apartments-1015-1025-n-farnsworth-ave-aurora-il-60505/

Thursday, September 21, 2023

1250 Douglas Call for Offers

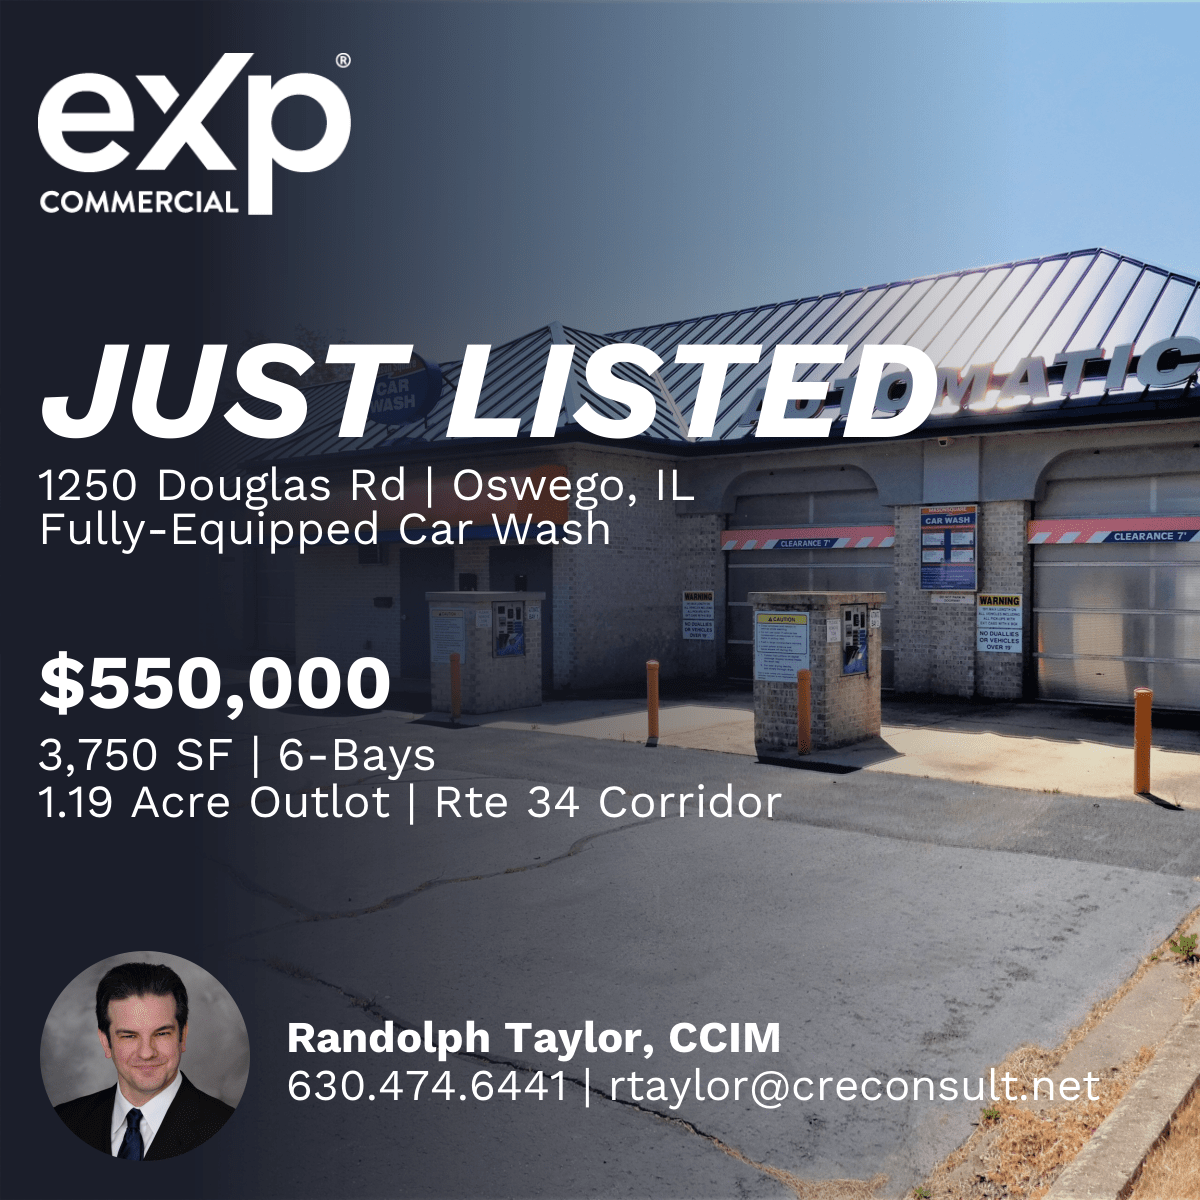
Call For Offers | Fully Equipped Car Wash | Oswego, IL
Due: Friday, September 29th
Mason Square Car Wash is a fully equipped and operational 6-bay carwash in southwest suburban Chicago’s Oswego, IL. Ideally located on an out-lot of the Mason Square Shopping Center along heavily trafficked Route 34, averaging 45,000 vehicles per day,
Listing Agent: Randolph Taylor
630.474.6441 | rtaylor@creconsult.net
https://www.creconsult.net/fully-equipped-car-wash-oswego-il-route-34/

Indian Creek

New Listing: 24-Unit Multifamily | Aurora, IL
eXp Commercial is pleased to present to market Indian Creek Apartments, a fully occupied 24-unit multifamily complex on the northeast side of Aurora, Illinois, bordering affluent Naperville, Illinois, just to the east. The property is in good condition, with considerable upside in rents with modest unit updates. All units have separately metered tenant-paid water, sewer, electricity, heat, and hot water. Also offered is an attractive low-interest assumable debt of $1.453 million at a 3.32 percent interest rate not due until December 2028.
Listing Agent: Randolph Taylor, Senior Associate
630.474.6441 | rtaylor@creconsult.net
https://www.creconsult.net/indian-creek-apartments-1015-1025-n-farnsworth-ave-aurora-il-60505/

Monday, September 18, 2023

Indian Creek

New Listing: 24-Unit Multifamily | Aurora, IL
eXp Commercial is pleased to present to market Indian Creek Apartments, a fully occupied 24-unit multifamily complex on the northeast side of Aurora, Illinois, bordering affluent Naperville, Illinois, just to the east. The property is in good condition, with considerable upside in rents with modest unit updates. All units have separately metered tenant-paid water, sewer, electricity, heat, and hot water. Also offered is an attractive low-interest assumable debt of $1.453 million at a 3.32 percent interest rate not due until December 2028.
Listing Agent: Randolph Taylor, Senior Associate
630.474.6441 | rtaylor@creconsult.net
https://www.creconsult.net/indian-creek-apartments-1015-1025-n-farnsworth-ave-aurora-il-60505/

Friday, September 15, 2023

Home price declines may be over, S&P Case-Shiller says

Steep competition in the housing market and low supply are heating up home prices again.

Nationally, home prices in March were 0.7% higher than March 2022, S&P CoreLogic Case-Shiller Indices said Tuesday.

"The modest increases in home prices we saw a month ago accelerated in March 2023," said Craig J. Lazzara, managing director at S&P DJI, in a release. "Two months of increasing prices do not a definitive recovery make, but March's results suggest that the decline in home prices that began in June 2022 may have come to an end."

The 10-city composite, which includes the Los Angeles and New York metropolitan areas, dropped 0.8% year over year, compared with a 0.5% increase in the previous month. The 20-city composite, which includes Dallas-Fort Worth and the Detroit area, fell 1.1%, down from a 0.4% annual gain in the previous month.

Home prices are rising again month to month, however. After seasonal adjustment, prices increased nationally 0.4% in March compared with February. The 10-city composite gained 0.6% and 20-city composite rose 0.5%.

Lazzara also noted that the price acceleration nationally was also apparent at a more granular level. Before seasonal adjustment, prices rose in all 20 cities in March (versus in 12 in February), and in all 20 price gains accelerated between February and March.

Miami, Tampa, Florida, and Charlotte, North Carolina, saw the highest year-over-year gains among the 20 cities in March. Charlotte replaced Atlanta in third place. Compared with a year ago, 19 of 20 cities reported lower prices with only Chicago showing an increase at 0.4%.

"One of the most interesting aspects of our report continues to lie in its stark regional differences," added Lazzara. "The farther west we look, the weaker prices are, with Seattle (-12.4%) now leading San Francisco (-11.2%) at the bottom of the league table. It's unsurprising that the Southeast (+5.4%) remains the country's strongest region, while the West (-6.2%) remains the weakest."

Source: Home price declines may be over, S&P Case-Shiller says

https://www.creconsult.net/market-trends/home-price-declines-may-be-over-sp-case-shiller-says/

Thursday, September 14, 2023

Rent prices feeling higher than ever? It’s nothing compared to last year

For prospective tenants, rent prices feel higher than ever before. But if you compare the numbers to this time last year? They’re reportedly lower, based on new data from Rentometer.

In fact, based on a recent rent report by Rentometer, Chicago rent prices for all three bedroom counts (one bedroom, two bedroom and three bedroom) have decreased since this period last year.

The average rent in Q1 2023 for a three-bedroom unit was $2,287, compared to $2,252 in Q1 2022 (-2% YOY) while the average rent in Q1 2023 for a two-bedroom unit was $1,849, compared to $1,829 in Q1 2022 (-2% YOY).

And the bedroom count that reflected the most change year over year? One-bedroom. Rentometer reported a -9% decrease, with the average rent for a unit of this type being $1,392 in Q1 2023, compared to $1,528 in Q1 2022.

Source: Rent prices feeling higher than ever? It’s nothing compared to last year

https://www.creconsult.net/market-trends/rent-prices-feeling-higher-than-ever-its-nothing-compared-to-last-year/

Wednesday, September 13, 2023

Should I Sell or Should I Hold? When is the best time for asset repositioning?

When it comes to selling their investment properties, clients typically ask me,’ Why should I sell?’ Great question. Why should you sell? The obvious answer is that you purchased the investment property as an investment, and it may not be doing as well as other investment opportunities, and after a while, you don’t realize the appreciation and thus maximization of profit from the property until you sell and acquire another investment property. So the question is really, ‘When should I sell? Clients really lose the perspective of the driving reason why they invested in an investment property in the first place. An investment property is just that; an investment. Treated as such, every investment must have a horizon and an exit strategy. If a property was purchased as an investment, then it makes full sense to profit as much as possible from the investment.

The real estate market, like any other market, will go through peaks and valleys. Trying to predict the exact moment of peak or the exact moment the market reaches the bottom is practically impossible. The real estate cycle has four phases; recovery, expansion, hyper supply, and recession. The complete real estate market cycle seems to have an average duration of about 18 years as there is good historical data to support that. So, where are we in that cycle now? How much more upside will we see before we reach the peak? The question really is, ‘What is your appetite for risk?’

Below is a chart of the real estate cycles dating back from the 1800s. The last real estate market crash started at 2006. We are almost 16 years into that cycle. Interest rates are still at all-time lows. Money is cheap, and the threat of inflation is very high. How long can government print money without paying the price down the road? How much road do we have left?

Screenshot_111.png

So when is a good time to exit an investment property? As with everything else, real estate is cyclical. Those of us that have been around for some time have witnessed several cycles in the real estate market. Since it is practically impossible to predict the peak of cycles, what strategy should you then use to maximize your investments? Keeping it simple, when evaluating if you should consider selling an investment property, it doesn’t really matter what the current real estate market is like. If you are looking to replace the investment property with another investment property, the ultimate decision to sell should also be based upon if you can increase your returns with the new replacement property, not what state the current market is in now.

There are a number of factors that can impact real estate prices; availability, investment potential, and interest rates, to name a few. Interest rates impact the price and demand of real estate—lower rates bring in more buyers due to the lower cost of money but also expand the demand for real estate, which can then drive up prices. As interests rate starts to inch up, the cost of money increases, and thus the appetite for real estate investments declines.

However, there are many ways that one can still protect their investments. 1031 Exchanges give investors a vehicle to reposition assets and mitigate risk. There are certain asset classes that inherently hold less risk and still perform as an investment vehicle. The questions really come down to; ‘How long do I hold on during this cycle? Do I have the time horizon to outlast another cycle? Is it time to reposition and take advantage of 1031?

As part of the team for our client’s investments, we specialize in building solutions around our client’s needs. We analyze the requirements, crunch the data, and present assets entirely based on their circumstances and the goals they are trying to achieve with their investment.

Have you thought of selling your property and would like to know what it’s worth? Request a valuation for your property below:

Request Valuation


Source: Should I Sell or Should I Hold? When is the best time for asset repositioning?

https://www.creconsult.net/market-trends/should-i-sell-or-should-i-hold-when-is-the-best-time-for-asset-repositioning/

How inflation is measured: 3 examples

1. Housing

Housing is perhaps the most consequential category in the consumer price index, a key inflation barometer.

Housing is the largest expense for an average U.S. household. The "shelter" category — which measures costs for renters and homeowners — therefore accounts for more than a third of the CPI weighting, the most of any category.

"Every single component [of the CPI] has some idiosyncratic measurement issue," Zandi said. "But housing is particularly important. It drives a lot of the inflation train."

Price changes in "shelter" were generally muted before the pandemic, economists said. But Covid-19 warped that dynamic: Housing costs shot up but have slowed and even started to fall in some areas, economists said.

Nationally, Americans saw rents grow by 5% in April from a year earlier, to about $2,018 a month on average nationally, according to Zillow Observed Rent Index data. That's a significant slowdown from 17% growth during the prior year, from April 2021 to April 2022.

Here's the problem: The CPI doesn't capture those price trends in real time.

It operates with a substantial lag, meaning it can take six months to a year for a decline (or increase) in current housing prices to fully feed through to inflation data, economists said.

"It's not necessarily a particularly accurate gauge of what's going on in the housing market right now," said Andrew Hunter, deputy chief U.S. economist at Capital Economics.

Here's the reason for the lag: The U.S. Bureau of Labor Statistics collects rent data from sample households every six months. The BLS also divides these sample households into six different subgroups (called "panels") and staggers when it collects data for each. Per the BLS, rents for Panel 1 are collected in January and July; Panel 2, in February and August, and so on.


That means it can take a year or so to collect data from all the subgroups.

Overall inflation is expected to slow sharply during the second half of the year as the CPI incorporates the housing price cooldown, economists said.

"It's almost as much of a certainty as you can get, really," Hunter said.

There's an additional housing measurement quirk: The BLS tries to assess price changes for homeowners as well as renters, in a subcategory called "owners' equivalent rent."

The measure is essentially a survey that reflects the price homeowners believe they could get if they were to rent their home. While somewhat tied to market rents, homeowners aren't necessarily feeling those inflationary pressures — especially those who own their homes or have a fixed mortgage, Zandi said.

2. Health insurance

Health insurance prices have been falling by about 4% a month since October, according to CPI data.

Consumers' out-of-pocket costs haven't necessarily dropped, though.

For example, the average person with family insurance coverage through an employer-sponsored health plan saw premiums rise to $509 a month in 2022 from $497 in 2021, according to the Kaiser Family Foundation.

Why the discrepancy?

The government doesn't calculate health insurance inflation by measuring consumers' direct costs, such as monthly premiums. It's hard to assess the value consumers get for those premiums; costs may go up, but consumers don't necessarily get more bang for their buck. An increase in premiums might more reflect poorer underlying health of the insured population than better policy benefits, for example.

So, the government instead measures costs indirectly, based partly on health insurers' profits. Profit margins serve as a proxy of consumer prices.

Early in the Covid-19 pandemic, health insurers' profits jumped. Consumers were still paying premiums but were generally disallowed from visiting doctors or hospitals for elective procedures.

Now, consumers are using their insurance more often. Insurers' aggregate profits shrank in 2021 relative to 2020 since they paid out more insurance benefits — and hence the monthly inflation readings flipped negative.

The BLS updates its profit-related calculations once a year, in October.

Health insurance inflation readings may flip positive in fall 2023 and persist into 2024 due to this dynamic, Zandi said. Health care may be among the few consumer categories notching higher inflation toward year's end when most other categories have been slowing, he said.

3. Consumer electronics

Consumer electronics — like those for smartphones, TVs and computers — were among the few categories that saw deflated prices in 2022.

That trend has continued into 2023: Smartphone prices have declined by 20% in the year through April, for example, according to the CPI.

However, phone prices haven't exactly fallen at the store.

"The consumer isn't necessarily seeing that," said Kenneth Kim, senior economist at KPMG. "To them, it just seems the price has gone up and up and up each year."

The duality is due to a "hedonic quality adjustment."

The BLS adjusts the prices of consumer electronics for quality — improvements in microchips, software and screen resolution, for example — which gives the illusion of a falling price on paper. The agency does the same for other categories like consumer appliances and apparel.

In other words, consumers are getting better-quality electronics for the price they pay. With the adjustment, prices appear to deflate.

"In that sense, it is a lower price because you're getting a lot more value," Kim said.


Source: How inflation is measured: 3 examples

https://www.creconsult.net/market-trends/how-inflation-is-measured-3-examples/

Tuesday, September 12, 2023

Slowing inflation on rental prices still leaves affordability issues for tenants

WASHINGTON (TND) — Finding an affordable place to live has been a challenge for Americans in numerous parts of the country over the last several years after the pandemic supercharged competition for properties and a longstanding supply shortage sent prices upward.

Rapid growth in prices for homes and rents during the pandemic have slowed this year as high mortgage rates have cooled competition in the real estate market, while more new multifamily buildings like apartments and condos have come onto the rental market.

Realtor.com’s latest monthly rent report for April found rent growth slowed to its lowest rate since February 2020, when the pandemic shut down the world. Median rent in the top 50 metros was 0.3% higher year-over-year with a median asking rent of $1,734 in the report.

“This is promising news for renters, suggesting that the pandemic peaks are behind us, and that the challenging affordability picture may begin to improve," said Realtor.com chief economist Danielle Hale. "We've seen record-high new construction occurring in the multi-family space, which is creating more units, helping to reduce competition and in turn helping to ease prices."

Redfin said that growth in median asking prices has slowed in 11 consecutive months, and April was particularly notable because rents typically rise at this time of year but instead had a modest decline of 0.2%.

How rent prices are changing is highly dependent on location and is mirroring the housing market in some aspects. Areas that went through huge booms during the pandemic are experiencing the biggest declines, while parts of the country that remained affordable are still having stable increases.

A boom in multifamily construction has helped provide more options for people looking for a place to live, with more units expected to come online later this year and in 2024. New construction for multifamily buildings is at the highest levels since the 1970s.

April’s consumer price index said shelter costs increased 0.4% and rent went up 0.6%, which was the slowest rate of increases in two years. Industry analysts say that data is lagging behind what they are seeing in asking rents and new builds coming to market, which would point to further softening coming.

“The data suggest that easing in the cost of shelter is ahead in future CPI reports. While this could take until 2024 to play out significantly, it will be welcome news for renters and for overall inflation," Hale said.

Builders are facing some potential headwinds keeping up the pace moving forward as high interest rates and turmoil in the banking sector is making it more difficult for them to secure a loan, and some industry experts are expecting new starts to decline this year.

The National Association of Home Builders is expecting a 10% drop-off in multifamily starts this year.

“Commentary from multifamily builders indicates that it has become more difficult to obtain loans for multifamily development as a result of tightening financial conditions due to actions of the Federal Reserve, which reduce future apartment construction,” NAHB chief economist Robert Dietz said.

The vacancy rate has also increased as more units come on the market, which helps loosen conditions for tenants looking for a place to live. Realtor.com said in its April report that vacancy rates reached the highest level in two years during the first quarter of 2023 at 6.4%. From 2013 to 2019, the average vacancy rate sat around 7.2%.

Another indication the rental market is shifting toward renters is the number of sweeteners that owners are offering to get people to sign a lease.

Zillow said 27% of rentals listed on the site as of mid-May offered at least one concession, like a free month of rent or parking, to attract new tenants. At the same time last year, the number of listings with concessions was 21%.

More renters are also opting to stay put rather than sign a new lease or buy a home as they are finding it to be the cheapest option along with economic uncertainty and inflation for other necessary items like gas and groceries.


Source: Slowing inflation on rental prices still leaves affordability issues for tenants

https://www.creconsult.net/market-trends/slowing-inflation-on-rental-prices-still-leaves-affordability-issues-for-tenants/

Monday, September 11, 2023

Cooling Future Deliveries Set the Stage for a Rent Growth Comeback

Cooling Future Deliveries Set the Stage for a Rent Growth Comeback

CALABASAS, Calif.--(BUSINESS WIRE)--Institutional Property Advisors (IPA), a division of Marcus & Millichap (NYSE:MMI), published a new national report, Pullback in Multifamily Construction Starts.

“As access to development capital across the country diminishes and rent growth slows, multifamily starts are cooling,” stated Greg Willett, first vice president and national director, research services, IPA. “Among the 15 markets that account for over half of the nation’s ongoing apartment construction, building starts in the second quarter of 2023 totaled just under half the average volume recorded during the previous two years.”

Pullback in Multifamily Construction Starts research report provides investors with the latest apartment construction research and analysis, including key findings such as:

  • The largest declines are in Texas, with second quarter 2023 project initiations in Houston, Austin and Dallas-Fort Worth at less than one-third the earlier volume. Slowdowns are also pronounced in Philadelphia, Denver, and Washington, D.C.
  • Pullbacks in new construction that mirror the average for the 15 markets under study are in Los Angeles at 52%, Seattle at 51% and Atlanta at 50%.
  • Markets where the pullback in construction is somewhat slower to materialize are in Florida and the Carolinas. Raleigh-Durham is the single location in the analysis where apartment construction starts in Q2 2023 remained in line with the volume recorded in early 2021 through early 2023.
  • Given that the typical apartment property takes 18 to 24 months to complete, delivery volumes should begin to wane in early 2025 and then drop notably during the last half of the year.

“Rent growth is likely to regain momentum as early as spring 2024, when the normal seasonal upturn in leasing velocity should coincide with obvious signs that today’s new supply excess is temporary,” added John Sebree, senior vice president and national director of the firm’s Multi Housing Division. “Price increases should prove robust during 2025.”

Just over one million apartment units are now under construction across the U.S. However, building is not booming everywhere. About half the total construction pipeline is in 15 markets, where a slowdown in local starts will impact overall statistics. Most of the primary building centers are in the Sun Belt, but there’s also notable activity in Washington, D.C., Los Angeles, Seattle and Philadelphia.

Apartment construction starts in the 15-market core building locations skidded to 30,800 units in the second quarter of 2023. That start volume is off 52 percent from the quarterly norm of 64,200 that was sustained for nine quarters from early 2021 through early 2023. Absolute peak quarterly starts totaled 81,500 units from April through June 2022.

Given that the typical apartment community takes 18 to 24 months to complete, delivery volumes should begin to wane in early 2025 and then drop notably during the last half of the year. Rent growth seems likely to regain momentum as early as spring 2024, when the normal seasonal upturn in leasing velocity should coincide with obvious signs that today’s new supply excess is temporary. Price increases should then prove robust during 2025.

https://www.creconsult.net/market-trends/institutional-property-advisors-releases-national-multifamily-construction-report/

Chicago's Multifamily Sector Boasts Healthy Occupancy Rates, Strong Rent Growth

Chicago’s multifamily sector currently enjoys strong market fundamentals highlighted by healthy occupancy rates and continued rental rate growth. The current core apartment rents average over $4 per square foot, which is higher than previous peak pricing.

After the pandemic, rental rates between late 2021 to 2022 recorded 10 to 15 percent growth, which is substantially ahead of the historical norms. Currently, the Chicago rental market is experiencing more stable rent growth in the 3 to 4 percent range.

Chicago remains one of the most affordable major markets to rent an apartment when looking at the current average effective rents as a percentage of median household income. This affordability will allow owners to continue to push rental rates in the future.

One of the major factors leading to strong operating fundamentals in the Chicago market is the lack of new supply. The supply in Chicago is currently 1 percent of the inventory, which is quite low in comparison to other markets where there could be as much as 10 to 12 percent of the inventory under construction.

In the city, there are just over 7,000 units under construction slated for delivery between 2023 and 2024. The majority of new development is located in two submarkets, which are Fulton Market and Gold Coast/Near North. In the suburbs, there are nearly 6,000 units slated for delivery through 2024. Suburban deliveries have remained consistent in recent years as investors continue to believe in the fundamentals outside of the urban core.

Spring and summer are typically the strongest leasing seasons in the Windy City and with a very limited supply of new construction in the pipeline, the market is well-positioned for continued strong rent rate growth as well as high absorption.

Investment sales activity in 2022 was $3.2 billion, with the majority occurring during the first half of the year, before the Federal Reserve’s rate increases really took hold and caused a lack of stability in the capital markets.

Among the key transactions to take place last year include the sale of The Elle, formerly known as Alta Roosevelt, in the South Loop to Waterton Associates. The property sold for $170 million, which is approximately $343 per unit or $341 per square foot. The transaction closed in November 2022 and was the largest transaction to take place in the downtown market.

In the suburbs, Ellyn Crossing in Glendale Heights sold to Turner Impact Capital. This 1,155-unit residence sold for $137 million, which is $118,615 per unit and $193 per square foot, and was among the largest transactions to occur in the suburbs last year.

In terms of investment activity, many of the large institutions remain on the sidelines thereby creating a great opportunity for the private capital to acquire assets in the Chicago market. In fact, downtown acquisitions by private investors have continued to increase year-over-year demonstrating their desire to transact with yield premiums and significant discount to replacement cost.

Looking forward

There is plenty of liquidity in the financing markets for multifamily. Agencies continue to provide liquidity during this choppiness in the capital markets, committing $150 billion in dry powder for 2023 volumes. Buyers today are actively seeking neutral leverage and will not settle for negative leverage. Therefore, they are very focused on their going-in cap rate.

Based on what is currently on the market, 2023 is on par with or well-positioned to exceed the activity recorded in 2022. Buyers and sellers are both capitulating, and as both move toward a middle ground, we expect the second half of the year to have even more transactions.

Today is a great time to be an investor and an operator in the Chicago market as the fundamentals have never been better, and pricing is at an above-average yield today with a significant discount to replacement costs.


Source: Chicago’s Multifamily Sector Boasts Healthy Occupancy Rates, Strong Rent Growth

https://www.creconsult.net/market-trends/chicagos-multifamily-sector-boasts-healthy-occupancy-rates-strong-rent-growth/

Sunday, September 10, 2023

Mason Square

Fully Equipped Car Wash For Sale
1250 Douglas Rd. | Oswego, IL | 3,750 SF | 6 Bays | 1.19 Acres
Mason Square Car Wash, a fully equipped and operational 6-bay carwash in southwest suburban Chicago’s Oswego, IL. Ideally located on an out-lot of the Mason Square Shopping Center along heavily trafficked Route 34, averaging 45,000 vehicles per day,
Listing Agent: Randolph Taylor 630.474.6441 | rtaylor@creconsult.net
https://www.creconsult.net/fully-equipped-car-wash-oswego-il-route-34/

Midwest spotlight: A look at multifamily performance

The multifamily market saw record-breaking rent growth that was backed by high demand in 2022, but that is no longer the case for several regions in 2023. While the volatility in the current market has taken its toll on the sector’s high-paced expansion, not every region in the U.S. is experiencing setbacks. In fact, the Midwest has recently emerged as a thriving area for multifamily investment.

The Midwest offers several advantages compared to other U.S. regions, including its diverse economy, growing population, and stable housing market. All of which makes the region an excellent place for investors looking to expand their portfolios.

Why Invest in the Midwest?

The level of transaction activity in the multifamily market can be influenced by factors such as population growth, government regulations, property taxes, income levels, supply trends, real estate regulations, and more. In the past, larger metros like Chicago and Minneapolis attracted more capital to the Midwest because they offered high levels of the listed market drivers. However, recently, secondary markets have become popular as well, indicating that there is a strong demand for multifamily properties that are well-located.

The region has experienced steady economic growth and low unemployment rates, which provide a stable market for commercial real estate services. The cost of living and doing business is lower in the Midwest than in other parts of the country, leading to lower property prices and higher rental yields.

Additionally, developers are finding it easier to acquire land in the Midwest’s secondary markets and receive the necessary permits to build in a timely manner due to lower barriers to entry compared to other regions.

The region’s transportation infrastructure, including highways, airports, and railways, makes the Midwest a strategic location for businesses and residents. Finally, the region’s diverse economy, with a mix of manufacturing, agriculture, and healthcare industries, ensures a stable demand for commercial real estate.

The Midwest’s growing population, with approximately 68 million residents, creates strong rental housing demand. The median household income for the Midwest was $66,143, according to the 2021 Census Report. The demand for rentals is further boosted by the fact that many people prefer renting to owning due to financial or lifestyle reasons. In fact, homeownership has declined nationwide, with 36 percent of American households now renting instead of owning.

The Midwest generally has more tax-friendly regulations for investors, making the region more attractive. South Dakota is income tax-free, while other Midwest states boast some of the lowest state income tax rates, such as Indiana at 3.16 percent and Michigan at 4.25 percent. Capital gains taxes are also lower in the Midwest compared to coastal markets. North Dakota, with a capital gains rate of 2.90 percent compared to California’s 13.30 percent, is one Midwest state worth highlighting.

Key Midwest Players

Multifamily real estate has been booming in the Midwest in recent years, with several states experiencing strong growth in the rental property market. Chicago has been the epicenter of multifamily investment in Illinois and is currently one of the leading markets for new deliveries. Smaller cities such as Rockford and Aurora have begun providing more affordable rental options. Ohio has seen investment in the cities of Cleveland and Columbus, focusing on redeveloping historic buildings. Columbus, in particular, experienced substantial growth with an expanding downtown to attract young professionals to the area.

In Minnesota, the Twin Cities of Minneapolis and St. Paul have been a hotbed of multifamily investment, with a high demand for rental properties and substantial capital investment. Meanwhile, in Missouri, St. Louis has experienced significant investment in the downtown area and surrounding neighborhoods due to the revitalization brought by the growing tech industry and talent pool. On the other hand, Kansas City has been focusing on suburban construction.

Overall, the Midwest has experienced substantial growth in the multifamily real estate market, driven by a growing population, a robust economy, and a focus on urban revitalization. With a mix of large and small cities experiencing significant development, the region offers a range of opportunities for investors and renters alike.

Illinois – Chicago, Rockford, and Peoria

From Q1 2022 to Q1 2023, around 5,600 units were absorbed in Chicago, which exceeds the average annual net absorption of 4,100 units for the market. Strong demand has led to a decrease in vacancies, further contributing to rent growth in the market. Year-over-year rent gains posted a 4.1 percent increase. The area experienced $5 billion in annual sales volume with an average cap rate of 5.7 percent from Q1 2022 to Q1 2023. Chicago’s two largest submarkets, Downtown and North Lakefront, experienced a high percentage of sales from Q1 2022 to Q1 2023.

In Q1 2023, apartment rents in the Rockford market increased by an annual rate of 5.3 percent. There are 33 units under construction in Rockford, the largest under-construction pipeline in over three years. As of Q1 2023, vacancies in the metro area were slightly below the 10-year average but have remained relatively stable from Q1 2022 to Q4 2022; currently, the vacancy rate is 3.5 percent.

Apartment rents in the Peoria market increased by an annual rate of 9.2 percent in Q1 2023. The current market cap rate decreased since last year to seven percent. This is the lowest rate observed in Peoria in the previous five years, although the city’s cap rate is typically higher than in other regions. The area has had an annual sales volume of $118 million within the last 12 months. Within the past three years, 390 units have been delivered, a cumulative inventory expansion of 3.4 percent, and 160 units are currently under construction.

Ohio – Cleveland and Columbus

The Cleveland market experienced its most active year for deliveries since 2015, adding over 2,000 units in 2022. From Q1 2022 to Q1 2023, total multifamily sales in Cleveland amounted to $159 million, approximately 16 percent higher than the annual average, with a market cap rate of 7.5 percent. The average monthly asking rent in Cleveland is $1,100 per unit, making it a cost-effective market for renters.

From Q1 2022 to Q1 2023, multifamily sales in Columbus amounted to $2.0 billion, which is almost twice the prior three-year average. The majority of development and delivery activity within the submarket occurs in neighborhoods that are adjacent to downtown Columbus and surrounding Ohio State University, playing a significant role in contributing to the submarket’s strong overall performance. In the second half of 2022, quarterly volume reached record levels, with more than $650 million worth of transactions occurring in the third and fourth quarters combined. The market’s affordability and potential for higher yields likely contribute to the substantial sales volume in recent months. ¬¬¬

Minnesota – Minneapolis, Rochester, St. Cloud

Minneapolis achieved an all-time high in annual net deliveries for the fifth consecutive year, with 11,000 units added in 2022. This number is approximately 15 percent higher than the previous record set in 2021. In 2022, the annual sales volume in Minneapolis reached the second-highest level on record, totaling $2.1 billion. Minneapolis’ multifamily investment market has remained strong and durable, thanks to investments made by all types of buyers, including private and institutional capital. These investors are focusing on areas with lower volatility and higher yields that are less vulnerable to the potential impact of rising interest rates and a potential recession in 2023.

In Q1 2023, apartment rental rates in the Rochester market increased at an annual rate of 2.4 percent, and over the past three years, they have increased by an average annual rate of 3.6 percent. There are 940 units under construction, the highest under-construction pipeline in more than three years.

The St. Cloud rental market saw a 3.3 percent rise in apartment rents in Q1 2023, with an average yearly increase of 3.8 percent in the past three years. Home to a state university, the area experienced a 12 month sales volume of $92 million and a market cap rate of 6.7 percent. Additionally, there are currently 210 units being constructed in addition to the 670 units completed in the past three years.

Missouri – St. Louis, Kansas City, Springfield

Over the past year, the St. Louis area has delivered 3,700 units, significantly higher than the annual average of 2,300 units over the past five years. The price per unit is $140,000, representing a 48 percent rise in the past five years. The region’s multifamily market is still considered affordable, with rental rates 30 percent lower than the national average, at $1,140 per month.

The number of units in the Kansas City construction pipeline is 7,900, which accounts for 4.6 percent of the total inventory, one of the highest levels in the Midwest. The 12-month total sales volume is $1.1 billion, with more than half contributed by the sale of Class A properties.

Springfield’s population has increased by 19,000 individuals in the last five years, representing a four percent growth rate. During this time, the number of households in Springfield has grown by 9.7 percent. The yearly sales volume has averaged $49.0 million in the past five years, with a peak investment volume of $160 million during that period. From Q1 2022 to Q1 2023, $1.9 million of multifamily assets have been sold.

Takeaways

Overall, investing in multifamily properties in the Midwest can be a good option for those looking for a stable, income-producing investment with the potential for long-term growth. Many units are currently underway throughout the region, posing additional opportunities for years to come. As more investors move to this area to take advantage of the low cost of living, high demand, and steady economic growth, the region is set to thrive. Multifamily remains resilient despite economic volatility, and Midwest markets are excellent examples of adaptability in times of high-interest rates and slowing rent growth.


Source: Midwest spotlight: A look at multifamily performance

https://www.creconsult.net/market-trends/midwest-spotlight-a-look-at-multifamily-performance/

Saturday, September 9, 2023

The Dangers of Selling Commercial Property Too Late

The Dangers of Selling Commercial Property Too Late

The last downturn

cost those who chose to sell commercial property an average of

30.3% of their property value


Reason #1

Why people sell commercial property too late:

Complacency


Complacency is the most dangerous state to ignore.

It’s the moment before the market corrects and values decline. When the market goes through this initial correction, our natural tendency is to be complacent because initial corrections actually look like a cool-off period.

Then we expect the market to pick up again and continue with its growth phase.

But, the market continues to deteriorate and worries creep in as we wonder what is going on. Next, it is normal to say to yourself that your investments are good ones that they’ll ultimately come back.

When the market continues to soften until it seems there is no hope in coming back, that’s the absolute bottom of the market and the worst time to sell.


This point of capitulation is one of surrender and of asking how the government could let something like this happen.


Reason #2

Why people sell commercial property too late:

Ownership and Identity


In order to avoid loss, people will overvalue what they own.

That is what Richard Taylor, Daniel Kahneman, and Jack L. Knetsch identified with the Endowment Effect. In fact, Kahneman and Knetsch won the Nobel Peace Prize for their research in this area of behavioral economics.


It’s normal for people to overvalue what they own.


In a study with Cornell undergrads, broken into groups and given identical coffee cups, Kahneman and Knetsch told one group to value the cups they owned and the other group to value the cups they would purchase.

They found the undergrads with the coffee cups were unwilling to sell their coffee cups for less than $5.25 while their less fortunate peers were unwilling to pay more than $2.25 to $2.75.

But, it was Carey Morewedge’s research into the Endowment Effect that revealed that it’s not loss aversion that leads to overvaluation, it’s ownership and identity.

Morewedge found that it’s our sense of possession that creates the feeling of an object being mine, which then becomes a part of our identity.


Reason #3

Why people sell commercial property too late:

Loss Aversion


Why is it so difficult to sell commercial property in a market decline?

According to Brafman and Brafman, authors of Sway: The Irresistible Pull of Irrational Behavior people will go to great lengths to avoid perceived losses.

What’s more, people also succumb to their will to recover what once was.  They will spend whatever it takes not to lose, be it time, money, or emotional resources.

Imagine watching someone playing craps in Las Vegas. When they are on a roll, taking in their winnings, they race through the growth phase, reaching the peak of the game.

They feel ecstatic.

But what happens when the tide turns and they start to lose?

They enter the complacency stage, call it a short turn of bad luck, and keep playing.  They believe they will return to the top. But their bad luck continues.

By waiting to avoid losses, people hold off and then sell at the wrong time — maximizing their losses.


They lose their winnings, keep playing and generate losses. They would rather hold onto the idea of getting back to where they were at almost any cost than realizing their loss and moving on to another opportunity.


Reason #4

Why people sell commercial property too late:

Self Reliance Time Traps

Time Trap #1: Self-Education


People will self educate online because it is free and immediately available. A review of the search term on Google for “commercial real estate trends” returned 152 million results. A search for “commercial real estate trends YouTube” turned up 310 million results!

No doubt, an abundance of free information in the form of market data, blogs, market reports, and online opinions on what’s happening in the market is available.

Time Trap #2: Friends, Family, and Non-Commercial Advisors


When we aren’t sure what to do, we often consult friends, family, and non-commercial real estate advisors for input. Unfortunately, these people will not want to be the ones to say sell because it is easier to say no and risk being wrong than to say yes and risk not being right.

Plus, most of these folks will not have the data that you have seen here. These people are more likely to share anecdote based advice like “My friend made a killing in real estate. You should hold on, it will come back.” Remember, people who made this mistake lost in 2008-2010.

Time Trap #3: Hire a Traditional Broker


It is easy to find a traditional broker, given that 1 in 164 people in the United States today have a real estate license. According to the National Association of Realtors, there are about 2 million active real estate licensees in the United States.

The problem is that most traditional brokers do not specialize in Commercial Real Estate, Investment Sales and further specialization by property type. 


Have you thought of selling your property and would like to know what it's worth? Request a valuation for your property below:

Request Valuation

eXp Commercial Chicago Multifamily Brokerage focuses on listing and selling multifamily properties throughout the Chicago Area and Suburbs.

We don’t just market properties; we make a market for each property we represent. Each offering is thoroughly underwritten, aggressively priced, and accompanied by loan quotes to expedite the sales process. We leverage our broad national marketing platform syndicating to the top CRE Listing Sites for maximum exposure combined with an orchestrated competitive bidding process that yields higher sales prices for your property.


https://www.creconsult.net/market-trends/the-dangers-of-selling-commercial-property-too-late/

The Complete Guide to Determining Tax Basis on Commercial Real Estate

Are you thinking of selling a commercial income property? If so, it is important to calculate the correct tax basis to avoid higher capital gains tax when the property is sold. It is also necessary to determine the tax basis before you sell since the tax basis plays a role in determining depreciation.

In this blog, we’ll discuss the ins-and-outs of tax basis, also known as cost basis, then move on to how to calculate it, and finally, what it might mean to your bottom line.

What is Tax Basis?

Tax basis is the cost of the property paid in cash plus debt obligations or other property. It is determined by adding settlement and closing costs to the purchase price of the property.

According to the IRS, the following costs can be included when calculating tax basis:

  • Abstract fees (abstract of title fees)
  • Charges for installing utility services
  • Legal fees (including title search and preparation of the sales contract and deed)
  • Recording Fees
  • Surveys
  • Transfer taxes
  • Owner’s title insurance
  • Any amount the seller owes that you agree to pay, such as back taxes or interest, recording or mortgage fees, charges for improvements or repairs, and sales commissions.

On the contrary, the following costs cannot be included when calculating tax basis:

  • Casualty insurance premiums
  • Rent for occupancy of the property before closing
  • Charges for utilities or other services related to occupancy of the property before closing
  • Charges connected with getting a loan. The following are examples of these charges:
  1. Points (discount points, loan origination fees)
  2. Mortgage insurance premiums
  3. Loan assumption fees
  4. Cost of a credit report
  5. Fees for an appraisal required by a lender
  6. Fees for refinancing a mortgage.
  7.  

The basis of your investment property can either go up or down, depending on various factors. Thus capital improvements increase the basis, while depreciation decreases the cost basis.

Without proper tax basis planning, you will end up paying double taxes …

Once for the adjusted basis minus the depreciation claimed while you owned the property, and a second time for the 25% depreciation recapture tax, which is the difference between the property’s depreciated value and its adjusted basis.

Depreciation in Relation to Tax Basis

The IRS allows CRE investors to deduct depreciation from a commercial real estate building, as well as any capital improvements made, but it does not include land as a depreciable asset. While there are benefits to depreciation deductions while you own an investment property, these deductions will result in a higher capital gains tax when the property is sold.

For example, if the value of the sold property is higher than its depreciated value, you will have to pay further depreciation recapture taxes (which is 25%, a bit higher than the usual capital gains tax which is 15–23.8%). In the case of a sale, you will have to be very mindful of planning the recapture taxes.

1031 Exchanges & Tax Basis

The benefit of the IRS’s 1031 exchange code is clear here, as it allows you to defer capital gains tax through a properly structured exchange. Capital gains taxes range from 15% – 23.8%, depending on your tax bracket.

When selling an investment property and buying another with a 1031 exchange, the basis of the old property is transferred to the new property. For example, if the original property was sold for $2,500,000 with an adjusted cost basis of $750,000, then $750,000 would be carried forward to the new property.

If the purchase price of the replacement property was $3,000,000, then your adjusted basis would now be the original cost basis ($750,000) plus the difference in price between the original property and the replacement property ($500,000).

The new tax basis is 1,250,000, and is referred to as “boot.”

Cost Basis Calculation

1. First, calculate all of the closing costs related to the purchase of the investment property. Then add that number to the original purchase price.

2. Next, deduct any lender fees, points, loan assumption fees, or mortgage insurance premiums from the above number, since the IRS does not allow them to be included as settlement costs when determining cost basis (see list above).

3. Then, calculate the amount spent on capital improvements. According to the IRS, capital improvements improve the value of the property. Examples include replacing a roof or HVAC system, adding on a wing or extending a portion of the property, or extensive interior renovations that allow you to add more tenants or increase space within a commercial property. They may also include:

    • Changing a property’s use to a different use
    • Rebuilding a property that has already “met its useful life”
    • Replacing a major part of the property
    • A repair that creates an increase in efficiency, productivity, or capacity
    • Fixing a defect or design flaw

4. Finally, deduct the amount of depreciation that was claimed on the income property.

This final amount is now your adjusted cost basis.

When it comes to owning an investment property, be sure to keep all documents that pertain to repairs, improvements, or replacements, and use these documents to calculate depreciation and cost basis on a yearly basis. However, since knowing which expenses count as capital repairs can be complex, it is best to consult your accountant or tax professional.

To Wrap It Up – Understanding Tax Basis Can Preserve Thousands of Dollars in Capital

It is very important to know and adjust the tax basis of your commercial real estate property. If it is lower when selling or foreclosing the property, you will consequently have to pay higher capital gains tax. Whether you plan to sell or not, be precise with your cost basis calculation and consult with your financial advisors. A proper calculation can provide the most wealth-preserving advantages.


Source: The Complete Guide to Determining Tax Basis on Commercial Real Estate

https://www.creconsult.net/market-trends/the-complete-guide-to-determining-tax-basis-on-commercial-real-estate/

Friday, September 8, 2023

What is an Estimated Net Proceeds Sheet and How is this Important to Estimate Capital Gains Tax Exposure

A seller's net proceeds sheet is a document that estimates the amount of money a seller will receive after all closing costs have been paid. The amount of the net proceeds will vary depending on the purchase price of the property, the seller's existing mortgage balance, the amount of real estate taxes due, and other closing costs.

The following factors affect the net proceeds of a sale:

  • Purchase price: The higher the purchase price, the higher the net proceeds.
  • Mortgage balance: The lower the mortgage balance, the higher the net proceeds.
  • Closing costs: Closing costs can vary depending on the state and the type of transaction.
  • Other expenses: Other expenses, such as real estate taxes and home warranty fees, can also reduce the net proceeds.

The net proceeds of a sale are important to capital gains tax exposure because they determine the amount of profit that is subject to tax. The seller's taxable gain is calculated by subtracting the adjusted basis of the property from the net proceeds. The adjusted basis is the original purchase price of the property plus the cost of any improvements that have been made.

For example, if a seller sells a property for $500,000 and has an adjusted basis of $300,000, then the seller's taxable gain is $200,000. The seller will owe capital gains tax on this amount.

The amount of capital gains tax that a seller owes will depend on the seller's income tax bracket and the length of time that the property was held. For example, a seller in the 22% income tax bracket who held the property for less than one year will owe a capital gains tax of 22% on the $200,000 gain.

Selling a property can be a profitable transaction, but it is important to understand the factors that affect the net proceeds and how this can impact your capital gains tax exposure. By understanding these factors, you can make informed decisions about when to sell your property and how to minimize your tax liability.

Here are some tips for sellers to minimize their capital gains tax exposure:

  • Hold the property for at least one year: If you hold the property for at least one year, you will be taxed at the long-term capital gains rate, which is typically lower than the short-term capital gains rate.
  • Make improvements to the property: Any improvements that you make to the property can increase the adjusted basis, which will reduce your taxable gain.
  • Donate the property to charity: If you donate the property to charity, you may be able to claim a charitable deduction, which can offset your taxable gain.

By following these tips, you can minimize your capital gains tax exposure and keep more of the money you earn from selling your property.

https://www.creconsult.net/market-trends/what-is-an-estimated-net-proceeds-sheet-and-how-is-this-important-to-estimate-capital-gains-tax-exposure/

1120 E Ogden

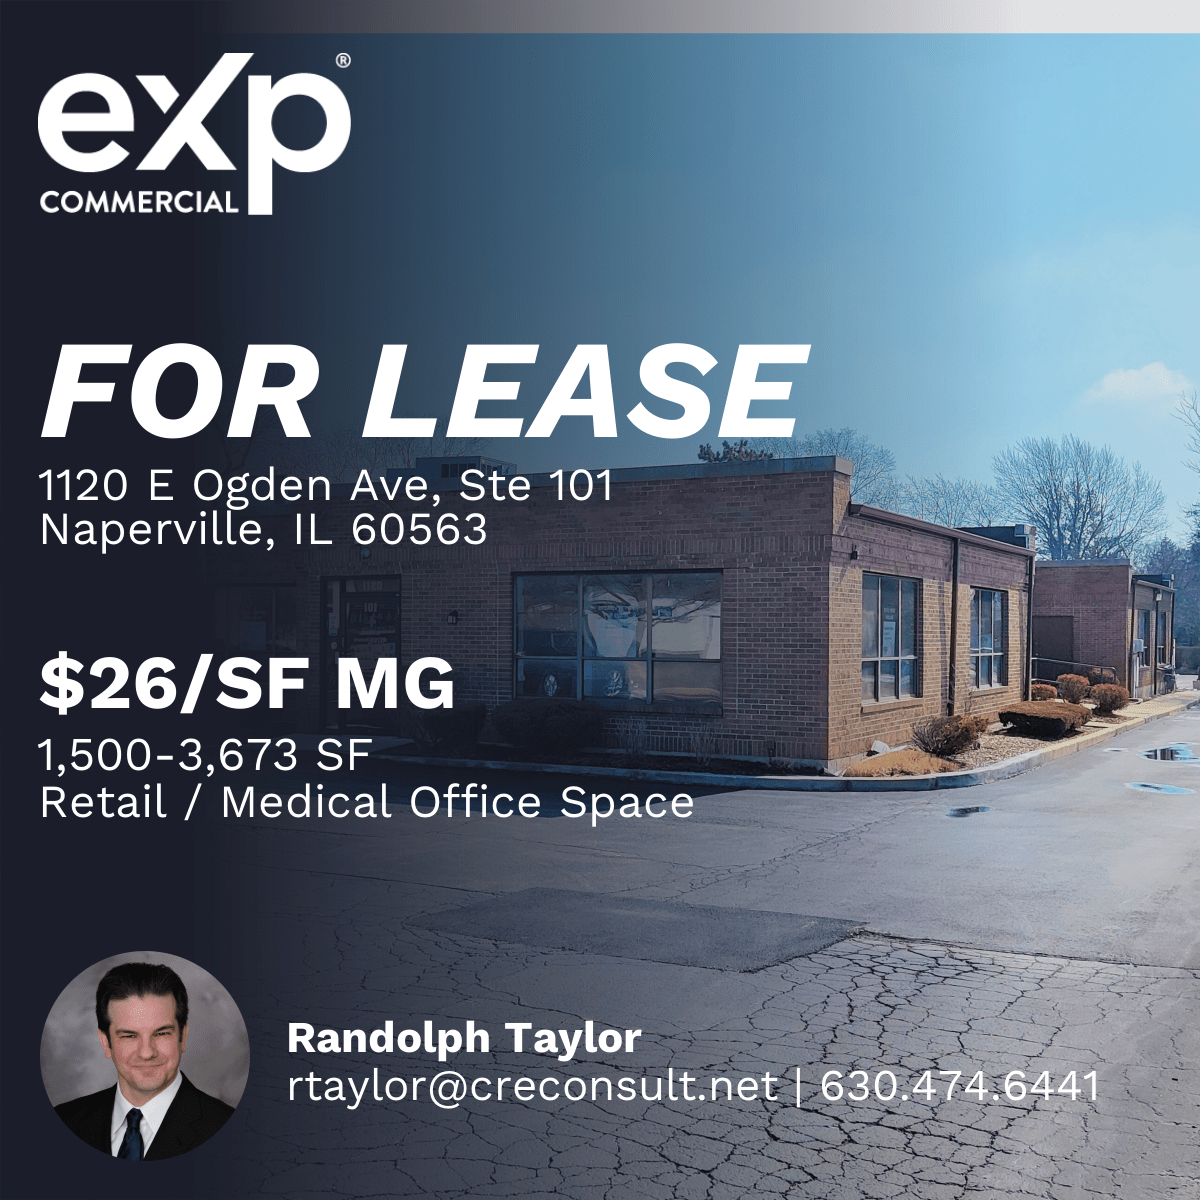
Retail / Medical Office Space for lease in Naperville, IL
1,500–3,673 SF | $26/SF MG
1120 E Ogden Ave., Suite 101, Naperville, IL 60563
Broker: Randolph Taylor, rtaylor@creconsult.net, 630.474.6441

https://www.creconsult.net/retail-office-for-lease-1120-e-ogden-ave-suite-101-naperville-il-60563/

Thursday, September 7, 2023

Mason Square

Fully Equipped Car Wash For Sale
1250 Douglas Rd. | Oswego, IL | 3,750 SF | 6 Bays | 1.19 Acres
Mason Square Car Wash, a fully equipped and operational 6-bay carwash in southwest suburban Chicago’s Oswego, IL. Ideally located on an out-lot of the Mason Square Shopping Center along heavily trafficked Route 34, averaging 45,000 vehicles per day,
Listing Agent: Randolph Taylor 630.474.6441 | rtaylor@creconsult.net
https://www.creconsult.net/fully-equipped-car-wash-oswego-il-route-34/

Here's who qualifies for 0% capital gains taxes for 2023

How to calculate your capital gains tax bracket

With higher standard deductions and income thresholds for capital gains, it's more likely you'll fall into the 0% bracket in 2023, Lucas said.

For 2023, you may qualify for the 0% long-term capital gains rate with taxable income of $44,625 or less for single filers and $89,250 or less for married couples filing jointly.

The rates use "taxable income," which is calculated by subtracting the greater of the standard or itemized deductions from your adjusted gross income.

For example, if a married couple makes $100,000 together in 2023, their taxable income may easily fall below $89,250 after subtracting the $27,700 married filing jointly standard deduction.

By comparison, you may have been in the 0% long-term capital gains bracket for 2022 with a taxable income of $41,675 or less for single filers and $83,350 or less for married couples filing jointly.

Other tax-planning opportunities

With taxable income below the thresholds, you can sell profitable assets without tax consequences. For some investors, selling may be a chance to diversify amid market volatility, Lucas said.

"It's there, it's available and it's a really good tax-planning opportunity," he added.

Whether you're taking gains or tax-loss harvesting, which uses losses to offset profits, "you really have to have a handle on your entire reportable picture," said Jim Guarino, a CFP, certified public accountant and managing director at Baker Newman Noyes in Woburn, Massachusetts.

That includes estimating year-end mutual fund payouts in taxable accounts — which many investors don't expect — and may cause a surprise tax bill, he said.

"Some additional loss harvesting might make a lot of sense if you've got that additional capital gain that's coming down the road," Guarino said.

Of course, the decision hinges on your taxable income, including payouts, since you won't have taxable gains in the 0% capital gains bracket.


Source: Here’s who qualifies for 0% capital gains taxes for 2023

https://www.creconsult.net/market-trends/heres-who-qualifies-for-0-capital-gains-taxes-for-2023/

Wednesday, September 6, 2023

SBA 504 Commercial Real Estate Loans

SBA 504 Loan Features

Through the 504 Loan, 40% of the total project costs must come from the SBA. 50% of the total project costs come from the participating lender. Borrowers of 504 loans contribute a further 10% of the project costs, but in rare circumstances, the borrower may be required to contribute 20% of project costs.

504 loans have fixed-rate interest rates, long loan amortization, and no balloon payments. Compared to other loans, 504 loans offer savings that result in improved cash flow. The maximum loan amount is $5 million, or $5.5 million for small manufacturers or certain types of energy projects.

For every $65,000 borrowed, businesses must make one job or retain one job. The exception to this is small manufacturers. These businesses are held to a ratio of one job for every $100,000. Businesses that will not create or retain jobs may still borrow an SBA 504 loan under certain circumstances, as long as the CDC maintains acceptable job creation or retention overall.

Who Is Eligible For The Loan Program?

Businesses must be for-profit entities and must be the correct size according to the SBA.

Businesses with a tangible net worth of over $15 million are not eligible. An average net income at or below $5 million after federal income taxes is also required. Businesses must have this average net income for the two years just before application. Nonprofit organizations and businesses engaged in passive or speculative activities do not qualify for the 504 loans. CDCs can help businesses in their geographic region determine whether they qualify.

What Type Of Commercial Properties Is An SBA 504 Loans Well-Suited for?

Businesses can finance almost any type of commercial property as long as its owner-occupied and are part of their business.

What can an SBA 504 loan be used for?

For a $1,000,000 activity, 504 project costs may be used for the following activities:

Buying land

Purchase of a building

Renovation of an existing building

Purchase of furniture and equipment

Soft costs

Proceeds from 504 loans must be used for fixed assets and some soft costs.

Land improvements (such as grading, utilities, street improvements, landscaping and parking lots)

New building construction

Long-term machinery

Modernization of an existing building

Conversion of an existing building

Debt refinancing in connection with business expansion through construction of new facilities, purchasing of new equipment, or renovation of existing facilities

It's important to note that the SBA 504 program cannot be used for purposes relating to inventory or working capital, consolidation of debt, or repayment of the debt, except for projects as described above.

Amortization

SBA 504 loans are amortized over 10, 20, or 25 years. Borrowers can work with their CDC and lender to determine which repayment schedule works for them.

Collateral Required For SBA 504

Project assets are used as collateral. Personal guarantees may also be required.

Available Interest Rates

SBA 504 loan rates correlate to the current market rate for 10-year and 5-year U.S. Treasury issues. 20 and 10-year loan maturities are available.

Can You Refinance An SBA 504 Loan?

No, you can't refinance an SBA 504 loan. However, there is a 504 refinancing program offered by the SBA, which allows business owners to refinance an existing commercial loan. The loan being refinanced cannot be any type of SBA loan.

85% of the original business loan should match the qualifications for an SBA 504 loan, and the remaining 15% of the loan must have been used to benefit the company. The original loan must be no less than two years old. To refinance, borrowers must make a 15% down payment, and eligible assets must be used as collateral.

Businesses less than two years old are not eligible to refinance. Businesses cannot refinance to expand their business, although they muse a standard 504 loan to promote their own business growth. Getting a 504 refinancing loan is a very similar process to getting a 504 loan. To start, the business must work with a CDC and private lender to obtain the loan


Source: SBA 504 Commercial Real Estate Loans

https://www.creconsult.net/market-trends/sba-504-commercial-real-estate-loans/

Tuesday, September 5, 2023

Should I Sell or Should I Hold? When is the best time for asset repositioning?

When it comes to selling their investment properties, clients typically ask me,’ Why should I sell?’ Great question. Why should you sell? The obvious answer is that you purchased the investment property as an investment, and it may not be doing as well as other investment opportunities, and after a while, you don’t realize the appreciation and thus maximization of profit from the property until you sell and acquire another investment property. So the question is really, ‘When should I sell? Clients really lose the perspective of the driving reason why they invested in an investment property in the first place. An investment property is just that; an investment. Treated as such, every investment must have a horizon and an exit strategy. If a property was purchased as an investment, then it makes full sense to profit as much as possible from the investment.

The real estate market, like any other market, will go through peaks and valleys. Trying to predict the exact moment of peak or the exact moment the market reaches the bottom is practically impossible. The real estate cycle has four phases; recovery, expansion, hyper supply, and recession. The complete real estate market cycle seems to have an average duration of about 18 years as there is good historical data to support that. So, where are we in that cycle now? How much more upside will we see before we reach the peak? The question really is, ‘What is your appetite for risk?’

Below is a chart of the real estate cycles dating back from the 1800s. The last real estate market crash started at 2006. We are almost 16 years into that cycle. Interest rates are still at all-time lows. Money is cheap, and the threat of inflation is very high. How long can government print money without paying the price down the road? How much road do we have left?

Screenshot_111.png

So when is a good time to exit an investment property? As with everything else, real estate is cyclical. Those of us that have been around for some time have witnessed several cycles in the real estate market. Since it is practically impossible to predict the peak of cycles, what strategy should you then use to maximize your investments? Keeping it simple, when evaluating if you should consider selling an investment property, it doesn’t really matter what the current real estate market is like. If you are looking to replace the investment property with another investment property, the ultimate decision to sell should also be based upon if you can increase your returns with the new replacement property, not what state the current market is in now.

There are a number of factors that can impact real estate prices; availability, investment potential, and interest rates, to name a few. Interest rates impact the price and demand of real estate—lower rates bring in more buyers due to the lower cost of money but also expand the demand for real estate, which can then drive up prices. As interests rate starts to inch up, the cost of money increases, and thus the appetite for real estate investments declines.

However, there are many ways that one can still protect their investments. 1031 Exchanges give investors a vehicle to reposition assets and mitigate risk. There are certain asset classes that inherently hold less risk and still perform as an investment vehicle. The questions really come down to; ‘How long do I hold on during this cycle? Do I have the time horizon to outlast another cycle? Is it time to reposition and take advantage of 1031?

As part of the team for our client’s investments, we specialize in building solutions around our client’s needs. We analyze the requirements, crunch the data, and present assets entirely based on their circumstances and the goals they are trying to achieve with their investment.

Have you thought of selling your property and would like to know what it’s worth? Request a valuation for your property below:

Request Valuation


Source: Should I Sell or Should I Hold? When is the best time for asset repositioning?

https://www.creconsult.net/market-trends/should-i-sell-or-should-i-hold-when-is-the-best-time-for-asset-repositioning/

Apartment rents in Chicago and Illinois are rising fast

Wages are not rising fast enough for many Chicago renters. Head to the suburbs, right? In some Chicago suburbs, rents are actually more expensive.

Chicago apartment dwellers are seeing some of the fastest rental price increases in the nation this spring and summer, reports a new market study.

A typical one-bedroom unit in downtown Chicago now leases for a hefty median rent of $1,840 a month – the second most expensive city in Illinois, according to Zumper’s Chicago Metro Area Report.

Renters who are thinking of heading to the suburbs for some financial relief should look at the Zumper numbers. Compared with the city, rents actually are more expensive in some Chicago suburbs.

The most expensive town to rent an apartment in the state is west suburban Lombard, which posted a one-bedroom median rent of $2,030, up a whopping 37.2 percent since last year.

“The reality is that multifamily apartment rents are rising everywhere – and fast,” said the Zumper report.

One way for renters to save some bucks is lease a compact apartment in downtown Chicago, which is known for offering some of the tiniest newly-built apartments in the nation, reports RentCafe.com, a nationwide apartment search website and part of the Yardi network.

“In the Windy City, a monthly rent of $1,500 will only lease you an average of 502 square feet of apartment space – the equivalent of a studio or one-bedroom unit,” the RentCafé report said.

Nationally, a monthly rent of $1,500 will lease you an average of 782 square feet of apartment space. Currently, Chicago is the 15th most popular rental apartment city in the United States, according to RentCafé. In May, renters found Chicago more appealing than such major cities as Washington, D.C., Boston, Seattle, Charlotte, or Houston.

The Home Front found the following assortment of available rentals in lakefront neighborhoods on Apartment List:

Lincoln Park. There are 285 units currently listed for rent in this neighborhood. At the Belden Stratford, 2300 North Lincoln Park West, renters can choose from 109 available units in the renovated former hotel. Studios with 556 square feet go for $2,610. One-bedroom units with 683 square feet rent for $2,818. Deluxe two-bedroom layouts with 1,043 square feet lease for $5,112 a month.

For renters who can’t afford luxury apartments downtown or in lakefront neighborhoods such as Edgewater, Lakeview, Lincoln Park, and Old Town, some nice units are located in the first ring of neighborhoods outside downtown, noted Ron DeVries, senior managing director of Integra Realty Resources, a consulting and appraisal firm.

For example, in North Lincoln Square, apartment hunters will find a nicely renovated one-bedroom unit in a walk-up building priced at $1,350 a month. The two-bedroom layout with off-street parking included is renting for $1,450.

However, rents in some off-the-lake North Side neighborhoods also have risen 11-13 percent in the past year because of sharply higher real estate taxes, Realtors say.

For many, rents rising faster than wages

The big problem for Chicago renters in 2023 is that wages are not rising fast enough for many tenants to afford the median-rent apartment, according to a new report from Housing Action and the National Low Income Housing Coalition.

To afford a typical two-bedroom apartment in Chicago, a renter who works 40 hours a week needs to earn $27.69 per hour, or $57,600 per year. To afford a one-bedroom unit, a tenant who works a 40-hour week would need to earn $24.13 per hour, or $50,190 per year.

The minimum hourly wage in Chicago increases every year and is set to rise another 40 cents on July 1, reaching $15.80 an hour for non-tipped workers at the city’s largest employers.

The report said the average fair market rent for a one-bedroom apartment in Chicago currently is $1,255 per month, while two-bedroom layouts lease for an average of $1,440.


Source: Apartment rents in Chicago and Illinois are rising fast

https://www.creconsult.net/market-trends/apartment-rents-in-chicago-and-illinois-are-rising-fast/

Monday, September 4, 2023

Mason Square

Fully Equipped Car Wash For Sale
1250 Douglas Rd. | Oswego, IL | 3,750 SF | 6 Bays | 1.19 Acres
Mason Square Car Wash, a fully equipped and operational 6-bay carwash in southwest suburban Chicago’s Oswego, IL. Ideally located on an out-lot of the Mason Square Shopping Center along heavily trafficked Route 34, averaging 45,000 vehicles per day,
Listing Agent: Randolph Taylor 630.474.6441 | rtaylor@creconsult.net
https://www.creconsult.net/fully-equipped-car-wash-oswego-il-route-34/

Elevate Your Multifamily Property Value: Strategic Upgrades That Matter

Elevate Your Multifamily Property Value: Strategic Upgrades That Matter Modernizing your multifamily property isn’t just good for tenants; i...