New Listing | Retail-Office For Sale Naperville IL
eXp Commercial is pleased to present to market 1120 E Ogden Avenue, a highly visible 10,860 square foot retail-office property on 1.26 acres in desirable affluent Naperville, Illinois, along the I-88 E-W corridor approximately 28 miles west of Chicago. The property is currently owner-occupied and will be fully vacated shortly after closing, with the seller seeking approximately 60 days of post-closing possession. Flexible B3 zoning allows for a number of retail and office uses, ideal for an investor, owner-user, or redevelopment of the property.
Listing Broker: Randolph Taylor | rtaylor@creconsult.net
https://www.creconsult.net/retail-office-for-sale-1120-e-ogden-ave-naperville-il-60563/
Tuesday, October 31, 2023
Monday, October 30, 2023
1120 E Ogden
Just Listed: 1120 E Ogden Ave. | Naperville, IL
10,680 SF Retail-Office | 1.26 Acres | B3 Zoning
Redevelopment Grants Available: Owner-User, Redevelopment Opportunity
Listing Agent: Randolph Taylor, CCIM
Rtaylor@creconsult.net | 630.474.6441
https://www.creconsult.net/retail-office-for-sale-1120-e-ogden-ave-naperville-il-60563/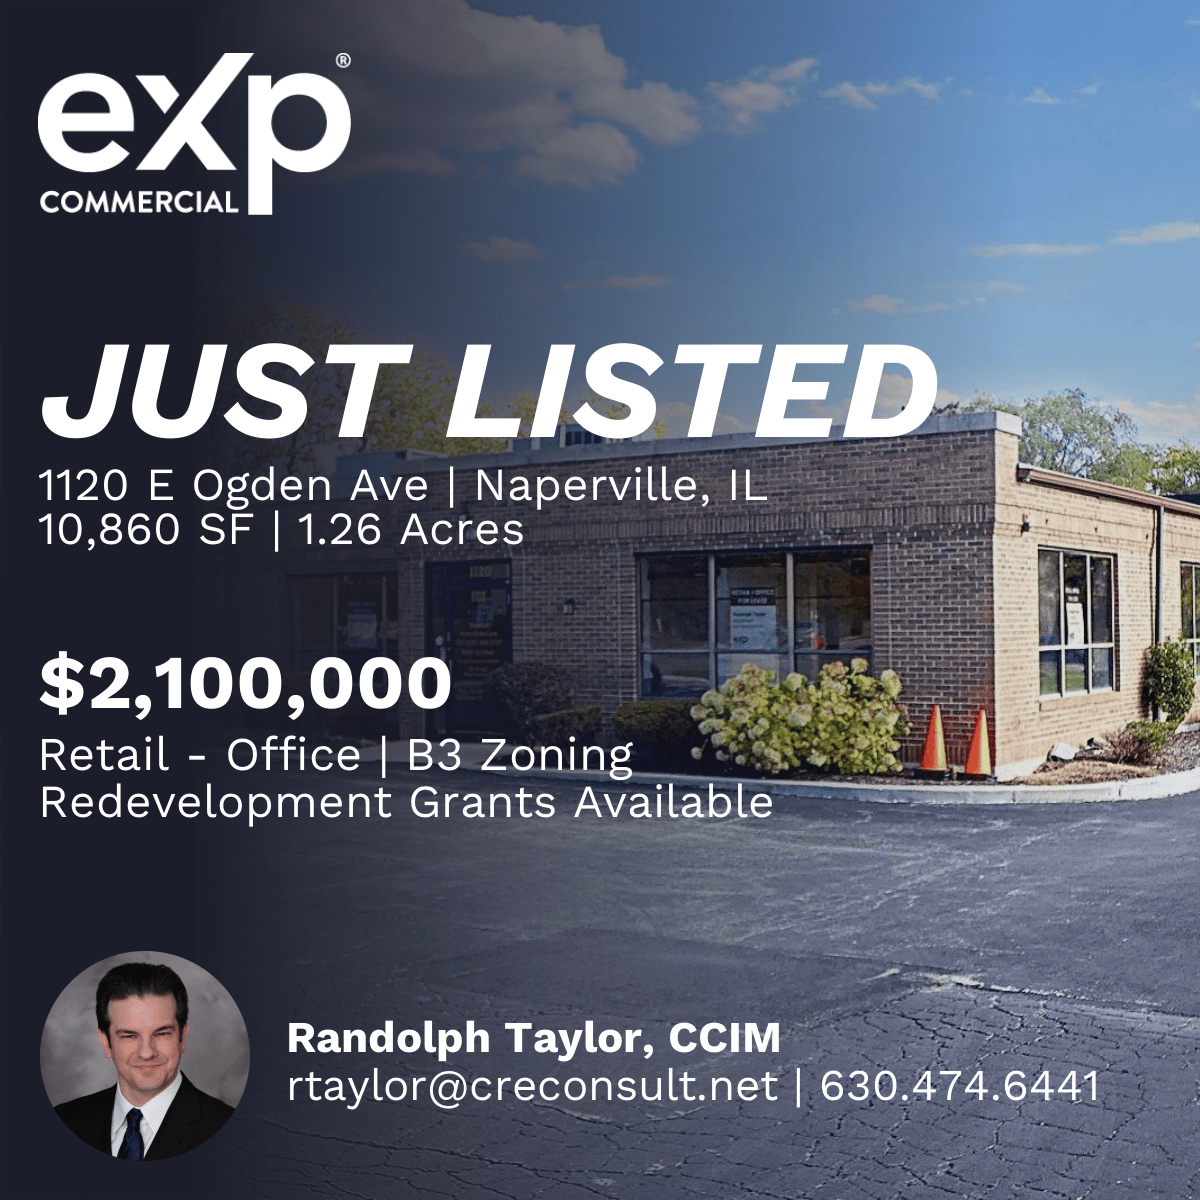
10,680 SF Retail-Office | 1.26 Acres | B3 Zoning
Redevelopment Grants Available: Owner-User, Redevelopment Opportunity
Listing Agent: Randolph Taylor, CCIM
Rtaylor@creconsult.net | 630.474.6441
https://www.creconsult.net/retail-office-for-sale-1120-e-ogden-ave-naperville-il-60563/
Friday, October 27, 2023
1120 E Ogden Ave
New Listing | Retail-Office For Sale Naperville IL
eXp Commercial is pleased to present to market 1120 E Ogden Avenue, a highly visible 10,860 square foot retail-office property on 1.26 acres in desirable affluent Naperville, Illinois, along the I-88 E-W corridor approximately 28 miles west of Chicago. The property is currently owner-occupied and will be fully vacated shortly after closing, with the seller seeking approximately 60 days of post-closing possession. Flexible B3 zoning allows for a number of retail and office uses, ideal for an investor, owner-user, or redevelopment of the property.
Listing Broker: Randolph Taylor | rtaylor@creconsult.net
https://www.creconsult.net/retail-office-for-sale-1120-e-ogden-ave-naperville-il-60563/
Thursday, October 26, 2023
Who’s Lending in Multifamily

Who’s Lending in Multifamily
Government-sponsored enterprises are still the big lenders in the field.
In the five-year span from 2015 through 2019, the big lenders for multifamily were government-sponsored enterprises. In the first half of 2023, the same dynamic is again present, according to a report from MSCI.
In that five-year period, the average contribution of the GSEs was 54%, with national banks providing 10% and regional and local banks accounting for 13%. There was also significant lending by insurance companies, commercial mortgage-backed securities, as well as investor-driven lending such as debt funds, though all under 10% each.
In 2022, when heavy market activity was followed by increasing interest rates to battle inflation, only 38% of the lending was from GSEs, with regional and local banks making up 19%, investor-driven rising to 13% and national banks at 12%.
“As other lender groups retreat in the face of banking sector turmoil, these lenders have captured a plurality of the market share for new loans in H1 2023,” MSCI noted. “For most other lender groups, it was not just the share of originations that fell in the first half of 2023, but the dollar volume as well. Total lending to apartments fell 53% from a year earlier in the first six months of 2023. That comparison is a bit off base, however, given the excess liquidity in the market seen in the first half of 2022.”
During the first half of 2023, GSEs came back strongly at 58%, although the deal flow from January through August was down 67%, compared to 2022 and off significantly from the pre-pandemic period, so this was hardly a normal cycle. Regional and local banks provided 16% of financing in the first half, but no other source hit even 10%.
GSE involvement was strongest in garden multifamily, at 68%, with regional and local banks at 15% and nothing else coming close.
Mid- and high-rise was more eventually distributed: 41% from GSEs, 17% local and regional banks, 15% insurance companies and 13% investor-driven.
Student housing had the smallest percentage of GSE funding at 26%, with 13% insurance, 17% national banks, and 29% local and regional banks. Senior housing had a similarly low percentage of GSE participation at 28%, 15% investor-driven, but 41% local and regional bank financing.
But the participation of local and regional banks is likely shifting.
“The shocks to the regional/local banks can be seen in the quarterly trend of originations,” MSCI wrote. “These smaller banks had captured 22% of the market in Q1 2023 and were the second largest source of debt financing for the apartment market behind the GSEs. Never before has the share of originations by regional/local banks fallen so sharply since we started tracking these figures in 2011.”
Source: Who’s Lending in Multifamily
https://www.creconsult.net/market-trends/whos-lending-in-multifamily/Wednesday, October 25, 2023
More than Half of All Renters Are "Cost-Burdened" According to New Census Data
Although rent growth has cooled significantly over the past year, the national median rent is still 23 percent higher than it was just three years ago, and in some markets, the increase has been even more substantial. Newly released data from the U.S. Census Bureau shows that these rapid increases in housing costs have been taking a meaningful toll on affordability.
According to the most commonly accepted measure of housing affordability, a household is considered to be “cost-burdened” if housing costs eat up more than 30 percent of gross household income. Households that spend more than 50 percent of their household income on monthly housing costs are considered to be “severely” cost-burdened.
The latest estimates from the Census American Community Survey, based on data collected in 2022,1 show that the share of American renters who are cost-burdened has risen to the highest level since 2012, erasing improvements made in the decade preceding the pandemic. The majority of this increase is attributable to a surge in the number of severely burdened households who spend more than half their incomes on rent.
Number of Cost Burdened Renters up 1.9 Million Since 2019
In the five years preceding the pandemic, from 2014 to 2019, the number of cost-burdened renter households fell by 826,000, while the number of renter households who could comfortably afford their rent increased by 1.9 million. But in the following three years, that dynamic has been flipped on its head - the number of cost-burdened renter households has spiked by 1.9 million from 2019 to 2022, while the number of non-burdened renter households fell by 957,000.
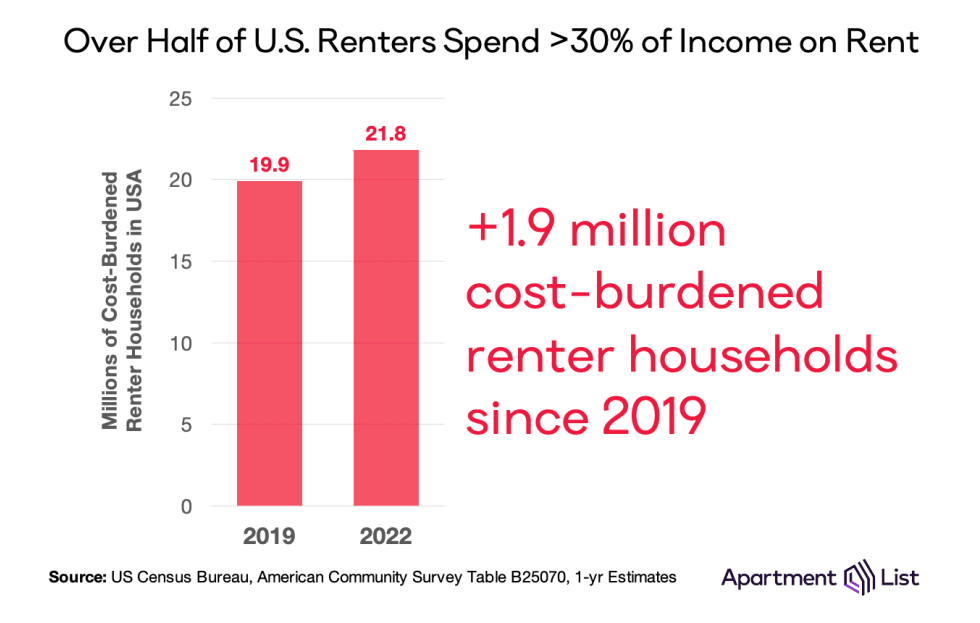
As of 2022, there are 21.8 million rent-burdened households, more than ever before. Just over half are severely cost-burdened, and that group has seen the biggest increase in recent years. The number of households that spend more than half of their income on rent spiked by 1.5 million from 2019 to 2022, an increase of 15 percent.
More than half of all renter households qualify as cost-burdened – the cost burden rate rose to 51.9 percent in 2022, the highest level since 2012. After peaking in 2011 in the aftermath of the Great Recession, cost burden rates had been gradually declining for nearly a decade, and the 48.4 percent rate in 2019 was the lowest of any year going back to 2005. But after the housing market was upended in the pandemic era, the cost burden rate jumped to 51.1 percent in 2021 and increased again in 2022.2
The share of renters who are moderately cost-burdened – those spending between 30 and 50 percent of household income on rent – has risen slightly, from 24.7 percent in 2019 to 25.2 percent in 2022. Unfortunately, most of the recent increase has come from severely-burdened households who struggle most acutely with their housing costs. The share of severely-burdened renter households increased from 23.7 percent to 26.7 percent from 2019 to 2022.
Given the flurry of homebuying activity in late-2020 and 2021, it may be natural to wonder if the increase in renter cost burden is attributable to a compositional effect, as some wealthier renters became homeowners. However, that is not the case. In fact, while the cost burden rate is much lower for homeowners, it has also been rising in recent years due to skyrocketing prices and mortgage rates. As of 2022, 27.9 percent of homeowners with a mortgage are cost-burdened, up from 26.6 percent in 2019.
Cost Burden Rates Are Highest in Florida and California Markets
While housing cost burden is a growing concern in virtually all parts of the country, there is also meaningful regional variation. The map below shows 2022 renter cost burden rates for the 250 largest metros in the U.S.; red shading indicates a cost burden rate above the national average, while blue indicates a rate below the national average.
Generally speaking, markets throughout the South and along the coasts tend to have higher cost burden rates, while the middle of the country fairs a bit better. Florida and California, in particular, jump out as hot spots. Miami has the nation’s highest cost burden rate among the 50 largest metros in the U.S. at 64.6 percent. The top five is rounded out by Orlando, FL (60.6 percent); Riverside, CA (60.2 percent); Sacramento, CA (59.1 percent); and San Diego, CA (58.3 percent). At the state level, Florida leads the way with 60.3 percent of renter households burdened by their housing costs, followed by Hawaii (57.8 percent), Nevada (57.3 percent), California (56 percent) and Louisiana (55.8 percent).
Rent Burden Has Worsened in 94 of the Nation’s 100 Largest Metros
Even in markets with below-average cost burden rates, the affordability picture is worsening. All but six of the nation’s 100 largest metros saw rent burden worsen from 2019 to 2022, with rates exceeding 50 percent in 65 of those metros.
The sharpest increase has been in the Spokane, WA metro, where the renter cost burden rate spiked from 44.8 percent in 2019 to 56.3 percent in 2022. It should come as no surprise that a market experiencing a rapid surge in rents would see affordability wane. Spokane was one of the original “Zoomtown” destinations when remote work first took hold in the early stages of the pandemic, and according to our latest estimates, rent prices for new leases in the Spokane metro are currently 34 percent higher than they were in March 2020. Phoenix serves as another clear example of this same trend playing out in a larger market. As the pandemic accelerated an ongoing influx of new households to the region, rents are up 28 percent and the share of cost-burdened renter households has risen from 46.6 percent in 2019 to 53.9 percent in 2022.
Some readers may be surprised to notice that famously expensive metros such as San Francisco; Washington, D.C.; and Seattle actually have rent burden rates that fall below the national average. While rents are certainly very high in these markets, so too are incomes. Furthermore, as affordability has worsened in these regions, some households have been priced out and left these metros entirely. As an example, consider that the Stockton, CA metro – which sits on the far periphery of the San Francisco Bay Area – is home to the nation’s largest population of “super commuters” who travel 90-plus minutes to work each way. For this reason, the cost burden rate, while a crucial indicator, does not always paint a holistic view of local housing affordability on its own.
Cost Burden Is Driven by Rents Rising Faster Than Incomes
The increasing cost burden rate of recent years is rooted in a fairly intuitive cause – rent prices have been growing faster than incomes can keep pace, a notable change to the dynamic of pre-pandemic years.
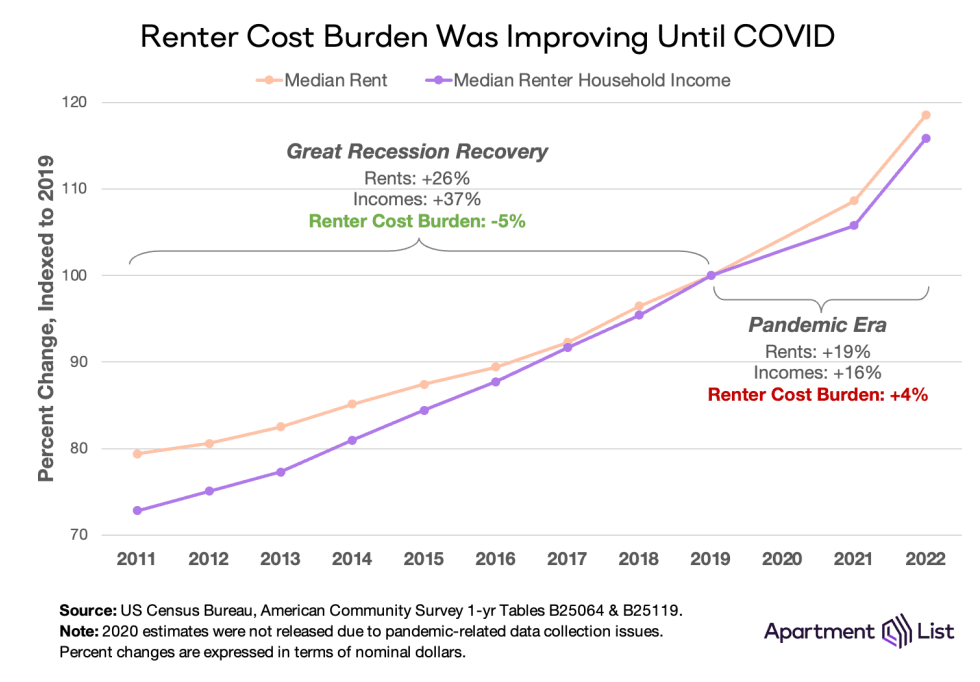
Renter cost burden peaked at 53.4 percent in 2011 during the fallout of the Great Recession. But as the economy recovered, so too did renter incomes, particular in relation to rent prices. From 2011 to 2019, the nationwide median rent rose 26 percent, while the median renter household income jumped 37 percent.3 Cost burden gradually improved as a result, falling five percentage points to 48.4 percent.4
The chart below plots nominal rent growth from 2019 to 2022 against nominal renter income growth over the same period. Each marker represents one of the nation’s 100 largest metros, sized by population, and shaded based on the change in the metro’s cost burden rate during those same years, with red indicating worsening cost burden and green signaling improvement. In metros sitting above the diagonal line, rents have grown faster than incomes in recent years, whereas in metros below the diagonal, incomes have grown faster than rents.
Notably, in 74 of the 100 largest metros, rents have been growing faster than incomes, and in 94, cost burden has worsened since 2019. Phoenix, seen toward the top center of the chart, again serves as a clear example: the metrowide median rent increased 36 percent from 2019 to 2022 according to Census estimates, while the median income of renter households increased by just 24 percent, driving one of the nation’s sharpest increases in cost burden.
Looking ahead
Cost burden worsened through the pandemic, from 48 percent of renter households in 2019 to 52 percent in 2022. This is a function of rent growth exceeding income growth; from 2019 to 2022, nominal rents rose 19 percent while renter incomes rose just 16 percent. In 2023 and beyond, this pattern would need to reverse to see an impactful improvement in cost burden.
On one hand, income growth does appear to be accelerating. Preliminary data from the Bureau of Labor Statistics shows that incomes in the second quarter of 2023 are up 5.7 percent year-over-year (1.7 percent after adjusting for inflation). And while these statistics are not available for renters specifically, other breakdowns show that recent wage growth is higher for lower-earners and non-white workers, who are both more likely to rent.
However, rent growth may also continue on an upward trajectory. This may come as a surprise to astute readers who know that rents are currently down year-over-year according to the latest Apartment List Rent Index. But remember that our index considers rents paid only by households who are moving and signing new leases, while marketwide rents that go into cost burden calculations consider all households, including the majority who stay put each year and continue with their existing leases. This is the main difference between our data and CPI inflation data, and while the latter does show annual rent growth starting to decline, it has remained elevated in the 7 to 9 percent range throughout 2023 year-to-date. Our data provide strong evidence that marketwide rent measures will continue to fall, but this may not happen quickly enough to trigger an immediate turnaround in cost burden rates.
Taken as a whole, this data emphasizes the scale of the housing affordability crisis in the U.S. For more than half of all renter households, monthly rent payments are eating up a large enough share of their income to put financial stability at risk. And more than one-in-four renter households spend more than half of their income on rent – a level which can often necessitate extreme measures such as overcrowding and cutting back on spending on other basic needs. Thankfully, policymakers have demonstrated an increased focus on this issue in recent years, but solutions are still urgently needed.
Source: More than Half of All Renters Are “Cost-Burdened” According to New Census Data
https://www.creconsult.net/market-trends/more-than-half-of-all-renters-are-cost-burdened-according-to-new-census-data/Tuesday, October 24, 2023
Steady Fundamentals, Stability Highlight Medical Office Sector
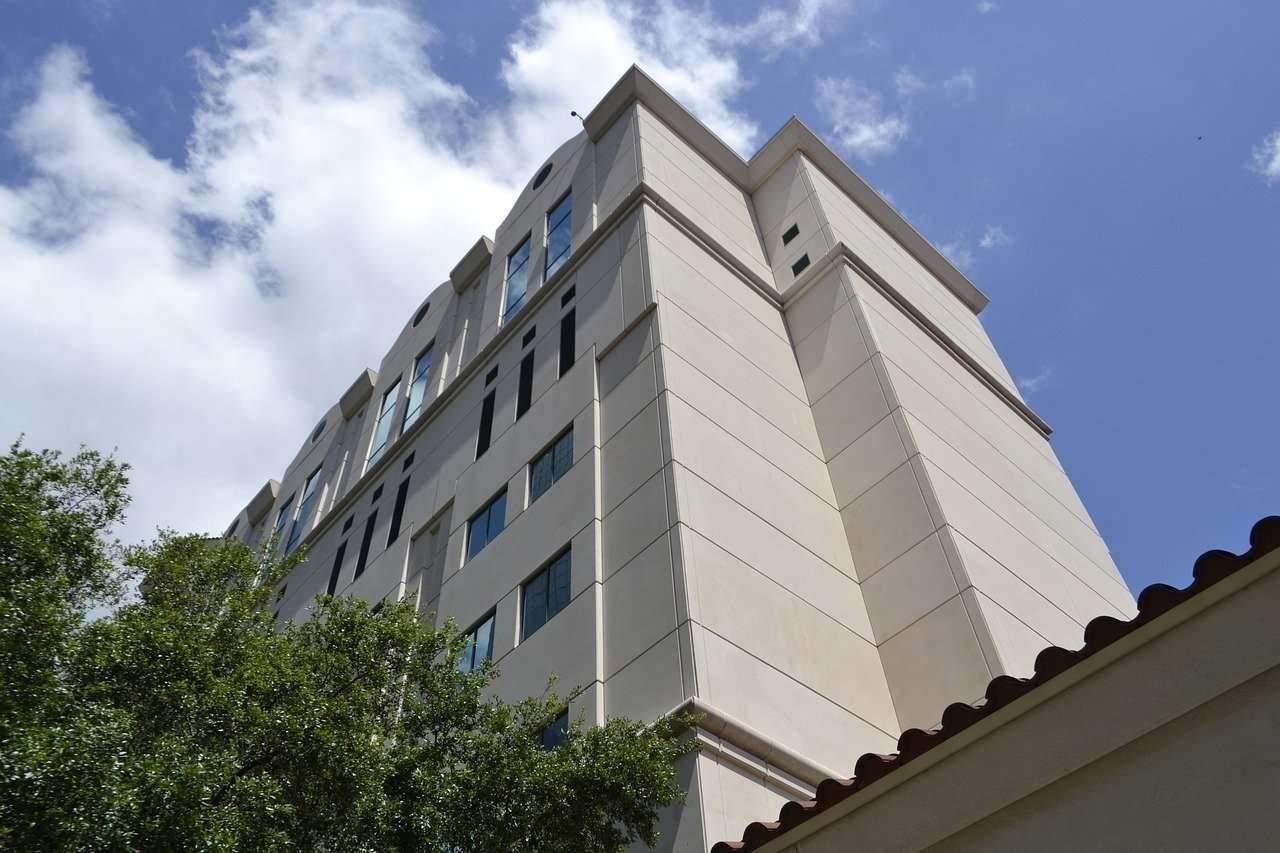
Though the healthcare landscape continues to shift, the buildings in which medicine is practiced provide “welcome stability,” according to Marcus & Millichap. In its 2H 2023 Medical Office National Report, analysts noted that vacancy remained steady and investors liked the sector’s stability, though the interest-rate environment impacted deal flow.

Stable Property Fundamentals
According to Marcus & Millichap analysts, "medical offices were not as affected by the pandemic as other facets of the health care system." As a result, vacancy rates have remained steady. The June rate was 50 basis points above the long-term average. Additionally, development slowed due to increasing construction costs. “As of September, medical office space accounted for just 10.7% of the total office pipeline,” the report said.
Transaction Volume Falls
Similar to what’s happening in other CRE sectors, a higher interest rate environment has impacted the MOB deal flow. Transaction volume fell by over 30% during the trailing 12 months ending in June 2023. The average sales price fell, too, dropping by 3% from its high in 2022 to $295 per square foot.
Attractive Performances
Investors like the medical office sector because it provides steady property cash flow and favorable lease terms with limited turnover. The Marcus & Millichap analysts also noted that the sector has provided “consistent year-over-year rent gains.” The future looks bright for medical offices. “Demand for health care services on a macro level is unlikely to decrease in any meaningful way, ensuring a stable tenant base, barring external challenges that arise from the tight health care labor market,” the analysts commented.
Source: Steady Fundamentals, Stability Highlight Medical Office Sector
https://www.creconsult.net/market-trends/steady-fundamentals-stability-highlight-medical-office-sector/Friday, October 13, 2023
Fannie Mae Launches New Workforce Housing Program

Fannie Mae has launched a new financing program to support the creation and preservation of workforce housing for middle-income renters.
The agency created the new Sponsor-Dedicated Workforce product in an effort to build and preserve workforce housing by incentivizing borrowers to place rent restrictions on properties for the life of the loan, according to a press release.
The program will be offered to borrowers who agree to make at least 20% of units at a multifamily property affordable to households earning between 80% and 120% of the area median income. Compliance will be confirmed annually by Delegated Underwriting and Servicing lenders.
Workforce housing continues to be one of the least-built affordable housing options. A report published in October 2022 by Fannie Mae says the New York and Los Angeles metro areas have a combined shortage of 1.25 million workforce units, while they lack 911,000 units of affordable and low-income housing.
Fannie Mae has secured five SDW loans in the past two months, CoStar reported. The loans total $80.1M and are backed by 867 units in the Dallas, Chicago and Washington, D.C., areas. The largest loan was a $31.8M refinancing of the 384-unit Green Oaks Apartments in the Chicago suburb of Palos Hills, Illinois.
"Affordability continues to be a significant challenge for multifamily renters as rent increases have outpaced income growth," Michele Evans, head of multifamily at Fannie Mae, said in the release. "Fannie Mae is addressing the need for workforce housing by providing innovative, attractive programs that create and preserve affordable multifamily units while enabling socially responsible investment opportunities for investors."
Source: Fannie Mae Launches New Workforce Housing Program
https://www.creconsult.net/market-trends/fannie-mae-launches-new-workforce-housing-program/Thursday, October 12, 2023
Morrison Closed
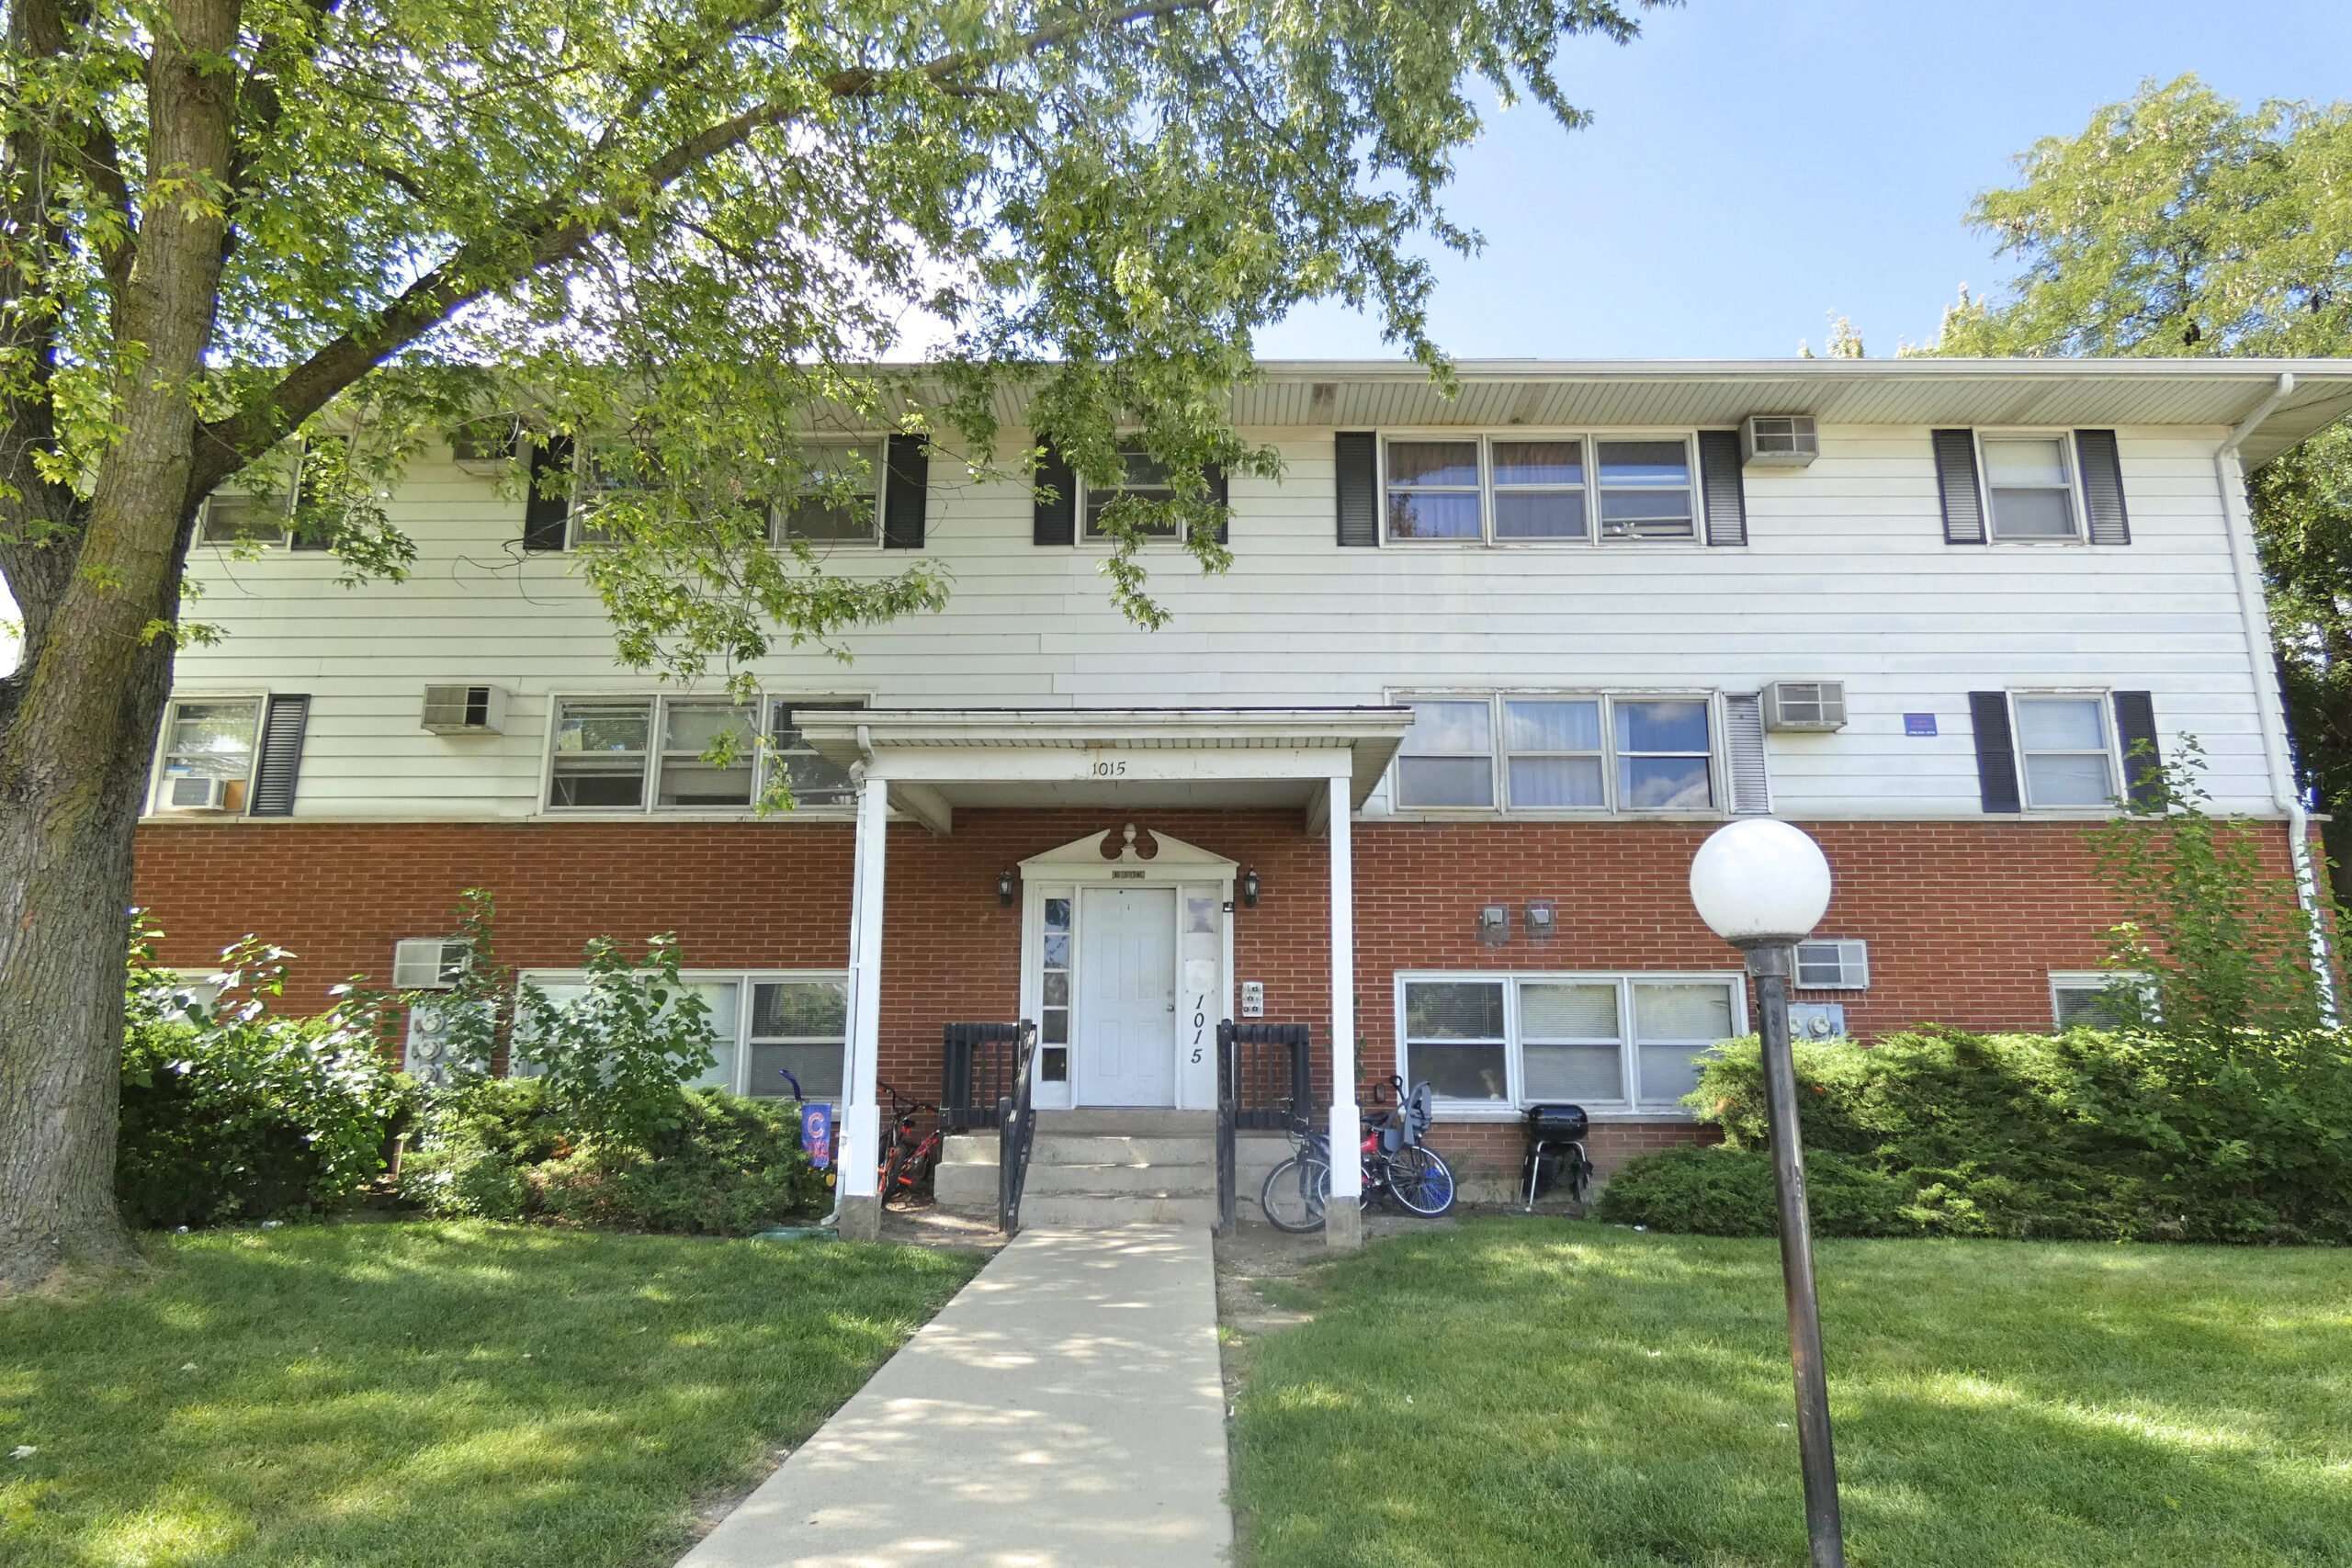
Just Sold | 23-Unit Multifamily Property Morrison, IL
The property is located at 631 E Lincolnway Rd., Morrison, IL The property consists of 23 multifamily rental units comprised of ten studio apartment, eleven one-bedroom units and two two-bedroom units
Randolph Taylor, CCIM Senior Associate and Multifamily Investment Sales Broker with the eXp Commercial Chicago office, brokered the deal and represented both the buyer and seller.
Randolph can be contacted at rtaylor@creconsult.net | 630.474.6441
https://www.creconsult.net/company-news/just-sold-23-unit-multifamily-property-morrison-il/
Thursday, October 5, 2023
Grand Prairie 2nd
NEW LISTING: 4,408 SF Medical-Dental | Dallas-Fort Worth Market
eXp Commercial is pleased to present to the market a fully built-out, free-standing 4,408-square-foot medical/dental office building in Grand Prairie, Texas, centrally located 22 miles southwest of downtown Dallas and 26 miles southeast of downtown Fort Worth. Though the current use is for a dental office, the property is zoned PD267A (commercial development), allowing for a variety of medical and dental uses. The property is owner-occupied and will be vacated at closing, providing an ideal opportunity for another dental practice or any number of medical office users to utilize the property for their practice or an investor who works with medical office tenants to take advantage of an investment opportunity.
Listing Brokers:
Tyson Grona | tyson@tysongronagroup.com | 936.444.3635
Randolph Taylor | rtaylor@creconsult.net | 630.474.6441
https://properties.expcommercial.com/1253332-sale
Wednesday, October 4, 2023
People are extending their leases and adding to the rental demand, says NAR’s Lawrence Yun
Lawrence Yun, National Association of Realtors chief economist, joins ‘Squawk Box’ to discuss the impact of rising Treasury yields on mortgage rates, the impact of skyrocketing mortgage rates on the housing sector, and more.
https://www.cnbc.com/video/2023/10/04/people-are-extending-their-leases-and-adding-to-the-rental-demand-says-nars-lawrence-yun.html?trk=feed_main-feed-card_feed-article-content
Tuesday, October 3, 2023
Grand Prairie
NEW LISTING: 4,408 SF Medical-Dental | Dallas-Fort Worth Market
eXp Commercial is pleased to present to the market a fully built-out, free-standing 4,408-square-foot medical/dental office building in Grand Prairie, Texas, centrally located 22 miles southwest of downtown Dallas and 26 miles southeast of downtown Fort Worth. Though the current use is for a dental office, the property is zoned PD267A (commercial development), allowing for a variety of medical and dental uses. The property is owner-occupied and will be vacated at closing, providing an ideal opportunity for another dental practice or any number of medical office users to utilize the property for their practice or an investor who works with medical office tenants to take advantage of an investment opportunity.
Listing Brokers:
Tyson Grona | tyson@tysongronagroup.com | 936.444.3635
Randolph Taylor | rtaylor@creconsult.net | 630.474.6441
https://properties.expcommercial.com/1253332-sale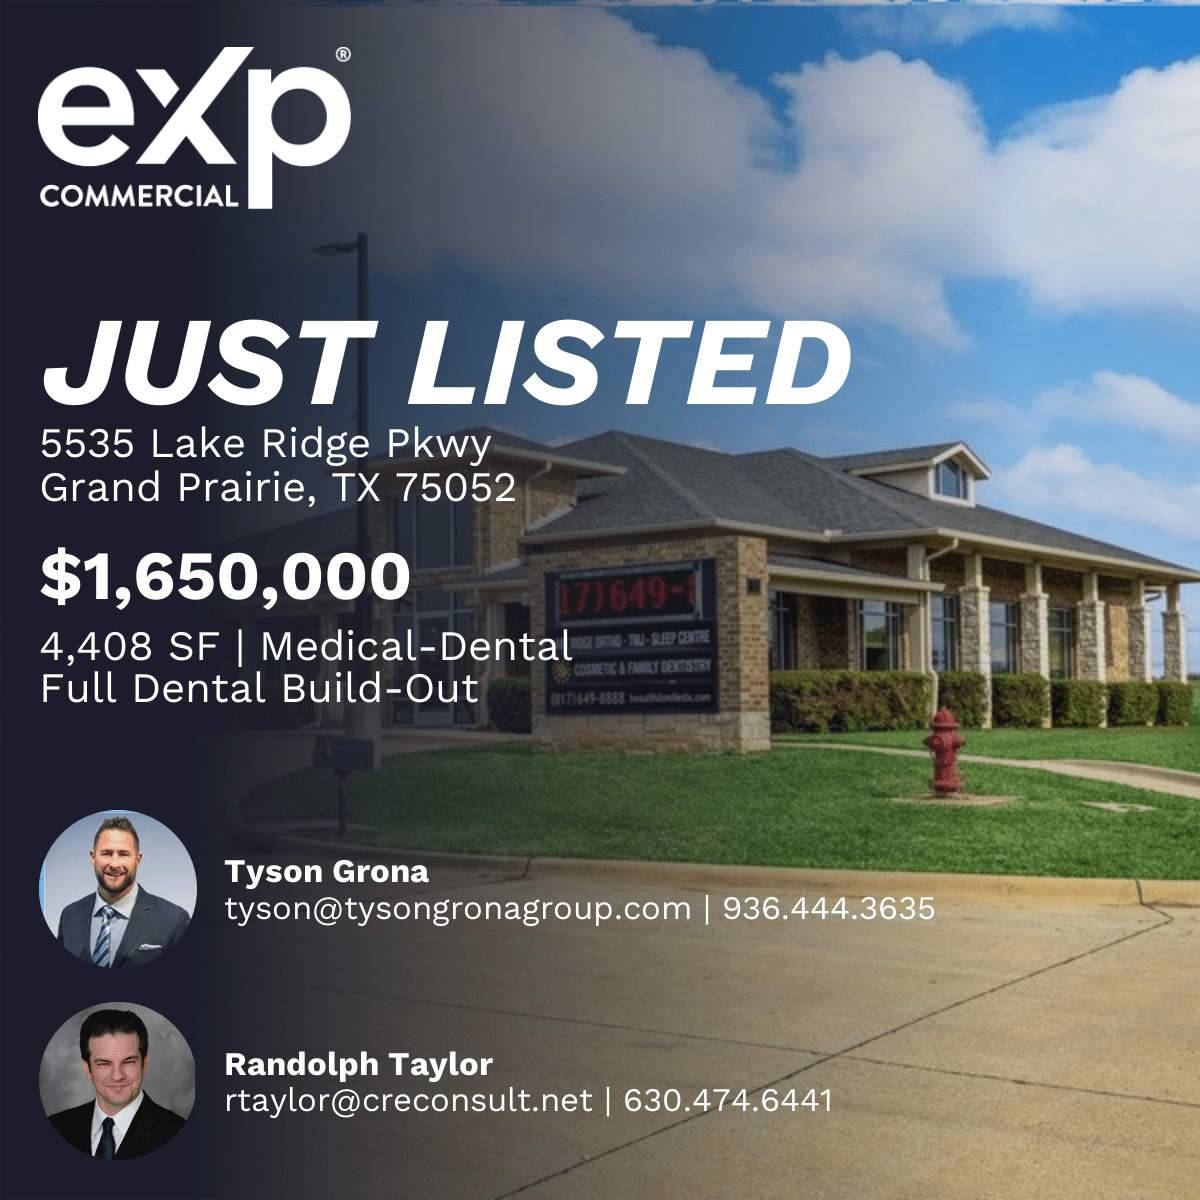
eXp Commercial is pleased to present to the market a fully built-out, free-standing 4,408-square-foot medical/dental office building in Grand Prairie, Texas, centrally located 22 miles southwest of downtown Dallas and 26 miles southeast of downtown Fort Worth. Though the current use is for a dental office, the property is zoned PD267A (commercial development), allowing for a variety of medical and dental uses. The property is owner-occupied and will be vacated at closing, providing an ideal opportunity for another dental practice or any number of medical office users to utilize the property for their practice or an investor who works with medical office tenants to take advantage of an investment opportunity.
Listing Brokers:
Tyson Grona | tyson@tysongronagroup.com | 936.444.3635
Randolph Taylor | rtaylor@creconsult.net | 630.474.6441
https://properties.expcommercial.com/1253332-sale
Monday, October 2, 2023
Diving Into CRE Debt Stats
Amid rising interest rates, some troubles at regional banks and investment sales volume that has shrunk to a fraction of its size from cyclical peaks, a lot of the debate around commercial real estate for the past half a year has revolved around how much people should worry about potential defaults. The Mortgage Bankers Association, an industry trade group, reported that in the first quarter of 2023, banks and thrifts experienced a 13-basis-point quarter-over-quarter increase in the 90-plus days delinquency rate on their commercial/multifamily loans, while life insurers and CMBS lenders experienced 10-basis-point increases each.
Real estate data firm MSCI Real Assets reported that at midyear, the volume of distress in the U.S. commercial real estate market rose to $71.8 billion, outpacing workouts by more than $8 billion. MSCI defines distress as encompassing bankruptcies, defaults, court administration, tenant distress or liquidation and loan transfers to special servicers. Much of that distress is concentrated on two property sectors with more than $24.0 billion of that outstanding distress tied to office buildings, and $22.6 billion in the retail sector. As of the second quarter, multifamily properties accounted for $6.8 billion in distressed situations. So, while the amount of distress in the commercial real estate market is growing, the question is how broad-based the challenges will be for borrowers and lenders.
To get a perspective on what’s happening in the lending market, WMRE talked with Willy Walker, chairman and CEO of Walker & Dunlop, a commercial real estate finance and advisory firm with a loan servicing portfolio that last year totaled $123 billion.
This Q&A has been edited for length, style and clarity.
WMRE: We keep seeing headlines about how the commercial real estate industry is “headed for a crisis.” How do you assess the commercial real estate industry’s health right now, what’s your outlook on it?
Willy Walker: I think it’s very important to define commercial real estate. Inside of commercial real estate there are various asset classes that all have very distinct performances at this time in the economy, at this time in the cycle. With that said, many people say “commercial real estate debt crisis” and they throw everything into [their definition of] commercial real estate and that’s not the case. If you look at the amount of debt outstanding in the commercial real estate today, it’s $4.5 trillion, but it’s very important to note that half of the debt outstanding in the commercial real estate world, $2.0 trillion, is to multifamily properties. There’s no crisis in multifamily whatsoever today. Period. So, when headlines say there’s a crisis in commercial real estate debt, half of that debt is in multifamily. What most people are talking about when they are talking about the crisis is they are talking about office. The office market is not doing so great. [But] when people say “commercial real estate crisis,” they are not looking at the performance of multifamily, retail, industrial, hospitality and they are going straight to office. So, specifically to your question, there is no crisis in commercial real estate.
WMRE: How much of a problem are office loans right now?
Willy Walker: Office is 17% of the total debt outstanding in commercial real estate today. And the Mortgage Bankers Association estimates that there are $98 billion of bank office loans that need to be refinanced in 2023. That’s a very significant amount of loans. But what you are finding right now is that lenders are working with borrowers to rework those loans and make it so the borrower is not defaulting and the lender is not taking control of the property. So the Office of the Comptroller of the Currency, the Federal Reserve and FDIC in June guided the banks that they could set up reserves against those loans and be able to engage with borrowers to rework the terms and conditions of those loans. So, what you saw in Q2 earning of CitiGroup, and JP Morgan and Wells Fargo were significant reserves [about $1 billion each for CitiGroup and JP Morgan] that allow them to go and work with the borrowers on those loans and make it so they don’t have to foreclose on those loans. The banks have plenty of liquidity today to be able to work with borrowers to rework these loans. Will there be defaults? Yes. Will there be loans foreclosed on? Yes. But there has not been this huge crisis [people] are talking of. Are there problems in the office sector? Yes. There is no investor, no lender today that says “I need to make a loan on an office.” [But they will work with borrowers on existing loans]. So, the big difference between 2023 and 2009 is that in the Great Financial Crisis, banks didn’t have liquidity, banks had to foreclose on properties and they had to move fast to get any money they could. Today, they don’t need to nor want to do that.
WMRE: If the Federal Reserve continues to raise interest rates, how do you expect it to impact the availability of debt in the commercial real estate sector?
Willy Walker: So, my understanding of what the Fed said is that they are not planning on continuing to raise rates, but they will look in September at whether they need to raise rates. What I did hear is that they are having difficulty getting to their 2% inflation target and that they have work to get through it. There are two very important things to keep in mind—the Fed Funds rate, which is a short-term interest rate and directly ties into SOFR, has gone up now by 525 basis points in the last 16 months. The 10-year Treasury over the last year has gone up about 100 basis points. The real estate capital markets are based off, in today’s market, the 10-year Treasury and not SOFR. There’s clearly a significant amount of debt that is outstanding in commercial real estate that is SOFR-based. So, if you were going to have borrowed on a floating-rate loan two years ago, your interest rate on that loan will have gone up by 400 to 500 basis points. If you are a fixed-rate borrower, you loan is based on the 10-year Treasury, and when you go to refinance, most people today are borrowing at a fixed rate. So, what’s important to understand is that there is plenty of real estate debt outstanding where the cost has gone up to the borrower, but if you are a fixed-rate borrower and you are refinancing, it’s not that dramatic a change. Also, if the short-term rates keep going up, the chance of a recession gets greater and greater, and so that is why the long yield of the curve has continued to be shorter and shorter and actually going down. One of the big issues here is how much more will [the Fed] raise on the short end of the curve and how it relates to the long end of the curve. The bottom line is if they keep raising rates, the chance of recession continues to go up, which will have the inverse effect on the long end of the curve [and bring financing costs down] because most people today are borrowing at fixed-rate and not floating- rate.
WMRE: Has Walker & Dunlop changed its lending strategy in any significant way in response to rising rates and concerns about the health of commercial real estate?
Willy Walker: No. But you also have to be clear. We only take risk on multifamily loans. So, we don’t have any risk in our loan portfolio on office, retail, industrial, hospitality. Ninety-one percent of those multifamily loans are fixed-rate loans. So, we don’t have credit issue. Specifically to multifamily loans, we’ve always been a predominantly fixed-rate lender. But also, the loans we take risks on we originate and securitize with Fannie Mae, and Fannie Mae and Freddie Mac since the Great Financial Crisis [GFC], have been debt service coverage lenders and not leverage lenders. So, they have a floor of 1.25 debt service coverage. So, we will not do a loan that does not have that coverage. What that means is that values can move around quite a bit as it relates to cap rates, and at the same time, all of these loans that were underwritten at 1.25 debt service coverage and because the majority of them are fixed-rate loans, you have no credit issue whatsoever. So, have we changed our underwriting standards over the last year? No. The issue with that is that we’ve been doing very low loan-to-value deals because of that 1.25 debt service coverage requirement. So, most of the lending we’ve been doing in 2023 is that low 50s to 50% loan to value. What that means is that many of our borrowers are getting 55% leverage.
WMRE: From conversations you might have had with executives from banks that do hold office loans and other types of commercial loans that are more prone to experience distress than multifamily, how are they dealing with it? How much “pretend and extend” situations are happening in the marketplace?
Willy Walker: There is a lot of pretend and extend going on. That term is a very bad term. Pretend and extend, it should be more like—"reality check and let’s work together.” In other words, “pretend and extend” is a term that basically said you are going to pretend the loan is okay, you are going to extend it for a period of time and cross your fingers that everything works. It’s a really bad way of looking at loan modifications. You are not pretending anything. You are realizing that the property isn’t performing, and you are making adjustments to make sure that the owner can hold on to the property and that the lender can get their money back at some point in the future. If there is anything I would underscore in that conversation is that “pretend and extend” is a very bad term. Banks don’t need the capital back right now, they don’t need their principle balance back right now, so as long as the banking system remains healthy, and we don’t drop ourselves into some big recession, you are going to be able to work with real estate borrowers and developers to work these loans out. But there are concerns. There is a lot of work going on at a lot of banks and they don’t want to take on additional exposure right now. If you go in and say “I need a new loan,” they are not going to be excited. And so that’s a problem right now.
WMRE: Some people did make money during the Great Financial Crisis because they were willing to take some risks where they saw opportunity for the future. Do you see any new opportunities in today’s marketplace? What are they?
Willy Walker: There is always opportunity. An example is seniors housing right now is still quite challenged because you still have a hangover from the pandemic. Fundamentals haven’t gotten back to where they used to be before the pandemic. But the demographics behind seniors housing are fantastic because of the aging population and their needs. So, if you can buy into the market today, with challenged fundamentals [at an appropriate cap rate] and finance it with a fixed-rate loan and wait, you know there are going to be improving fundamentals over the next five years. And I do think we will start to see a shift in back-to-office in the U.S. I don’t think that office recovers quickly. But first, it will happen to trophy assets, trophy office is an asset class that’s performing very well right now and [it gets mixed in with regular office]. Retail—lots of people are sitting there saying “consumer sales are weak, we are going into a recession.” We are not going into a recession right now. We just got the numbers. Retail is an asset class that’s held up exceedingly well. So, there are plenty of opportunities to invest in retail properties, and with retail cap rates where they are and financing costs on retail where they are, you can actually find positive leverage on retail that is very hard to find in multifamily.
Source: Diving Into CRE Debt Stats
https://www.creconsult.net/market-trends/diving-into-cre-debt-stats/
Subscribe to:
Comments (Atom)
-
Just Listed: Golf Sumac Medical Offices | Des Plaines IL Price: $3,900,000 SF: 35,245 Stories: 3 Occupancy: 82.3% Cap Rate: 9.63% * Stabiliz...
-
REGISTER TODAY The Commercial Real Estate Symposium will provide junior and senior agents and brokers with valuable insights ...
-
🚨 Office Condo For Sale – Bartlett, IL 📍 802 West Bartlett Road, Bartlett, IL 60103 💰 Listed at $299,900 Unlock the opportunity to own a ...

