eXp Commercial is one of the fastest-growing national commercial real estate brokerage firms. The Chicago Multifamily Brokerage Division focuses on listing and selling multifamily properties throughout the Chicago Area and Suburbs.
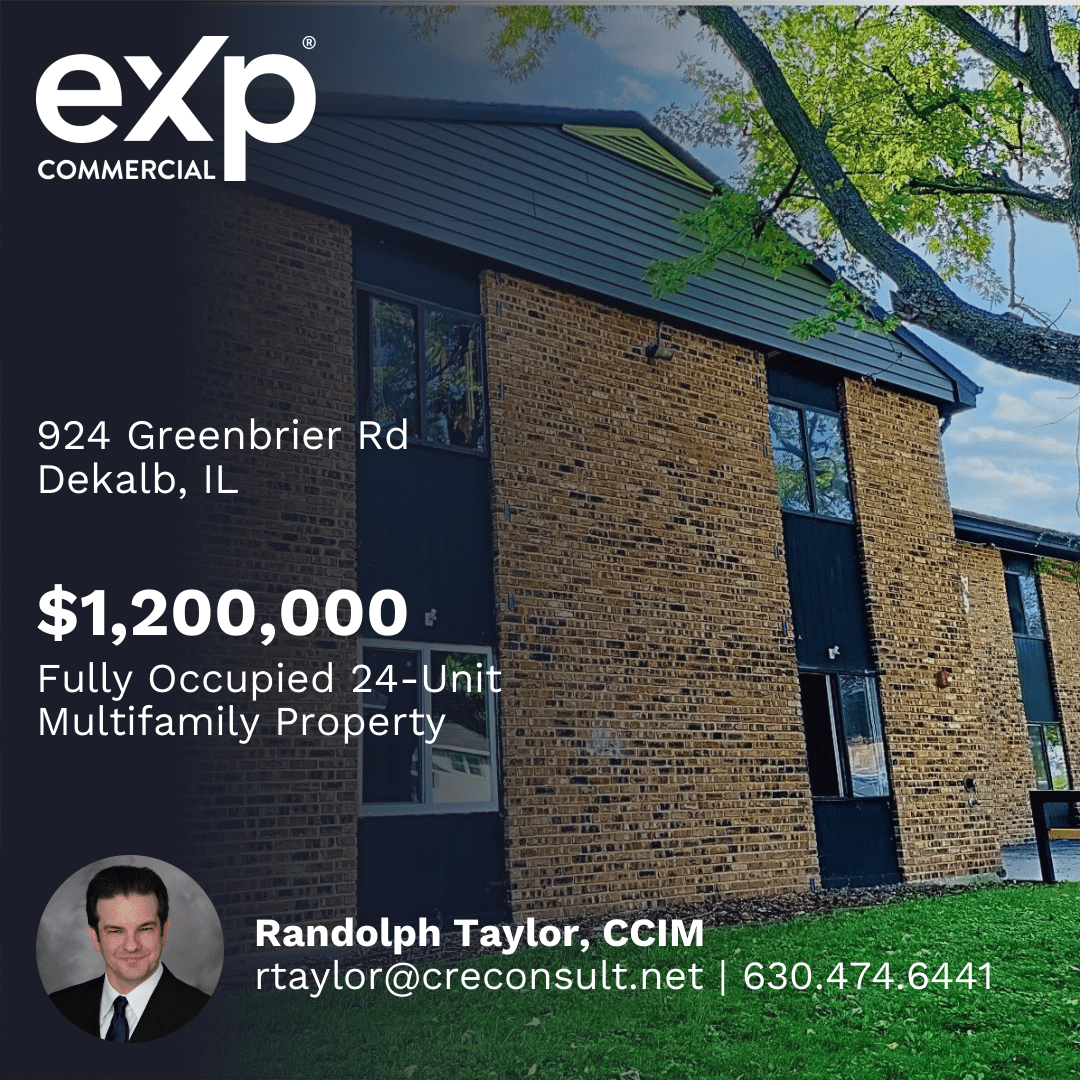
Just Listed: 24 Unit Multifamily Dekalb Price: $1,200,000 Fully Occupied Below-market rents Solid Flexicore Construction New Boiler/Newer Roof Resurfaced Parking Lot Listing Agent: Randolph Taylor rtaylor@creconsult.net | 630.474.6441
Multifamily Market Shows Early Signs of Stabilization
Following a challenging two years, 2024 has begun with some positive trends for the multifamily industry. In a recent webinar for Apartments.com, CoStar’s Jay Lybik painted a mixed but cautiously optimistic picture for the sector that has faced the brunt of high supply and weak demand in recent years. The national director of multifamily analytics highlighted the key takeaways from the first quarter and offered his predictions for the year ahead.
Slowing supply pipeline still continues to outpace demand
The first quarter of 2024 saw an increase in absorption and rebound in demand. A total of 104,000 units were absorbed in Q1, according to CoStar data. This marked the highest number since the third quarter of 2021.
However, this increase in demand is overshadowed by high supply. Even as it retreats from the 40-year high marked in 2023, new supply for 2024 remains above average. Dropping 15 percent from 583,000 last year, the 495,000 units projected to deliver this year are continuing to overwhelm demand, even as absorption picks up.
The vacancy rate is rising but stabilizing. The latest data shows a slight uptick from 7.7 percent at the end of 2023 to 7.8 percent in the first quarter of 2024. At the same time, rent growth deceleration appears to have slowed, hovering around the 1 percent range since mid-2023.
Luxury apartments struggle as mid-priced properties outperform
When broken out by price point, a clear divide emerges between luxury and mid-priced properties.
Luxury apartments, known as four- and five-star in the CoStar building rating system, make up 70 percent of new construction, which has suppressed rent growth to negative 0.2 percent.
Absorption for this class in Q1 is significantly higher than in 2023. A total of 27,000 units were absorbed in the first 90 days of 2024, compared to the 17,000 during the same period last year.
The Sun Belt continues to struggle
From a regional perspective, the Sun Belt continues to bear the brunt of oversupply. Seven of 10 markets with the highest supply/demand imbalance are in the Sun Belt: Austin, Dallas–Fort Worth, Houston, Atlanta, San Antonio, Charlotte, and Tampa.
Compared to a rent growth average of 0.8 percent nationwide, the Sun Belt has seen asking rents reverse, falling to negative 1.4 percent year over year. The five hardest hit major markets nationwide are all in the Sun Belt:
Largest year-over-year drops in rent growth
Austin (-5.7%)
Jacksonville (-3.6%)
Raleigh (-3.4%)
Atlanta (-3.0%)
San Antonio (-3.0%)
Midwest and Northeast pull ahead
Thanks to its healthy balance of supply and demand, the Midwest emerged in 2023 as a rent growth leader. Since then, the Northeast has been closing in on the Midwest’s lead. The Midwest saw a 2.5-percent increase in asking rent, as of the first quarter, while the Northeast wasn’t far behind, posting 2.1 percent in Q1.
All of the top 10 markets for rent growth are in the Midwest or Northeast. Coming in first is the Midwest’s Louisville, Kentucky, at 3.4 percent.
Greatest year-over-year increases in rent growth
Louisville, KY (3.4%)
Northern New Jersey (2.8%)
Cleveland, OH (2.4%)
Washington, D.C. (2.2%)
Norfolk, VA (2.1%)
2024 offers a mixed outlook
What’s ahead this year? Lybik painted a picture of a muted recovery. All but two major markets are projected to return to positive rent growth this year, though 40 percent will likely fall short of their five-year pre-pandemic average.
Midwestern and Northeastern markets are best positioned for success, as are three-star apartments. The road to recovery will be tougher for Sun Belt markets and luxury apartments.
Despite the positive trends of growing demand, slowing supply, and stabilizing vacancy, Lybik pointed to the health of the economy as a major wildcard.
High inflation and the potential for recession pose significant risk, he said.
“A recession is still possible, as stubborn inflation may force the Federal Reserve to resume hiking short-term interest rates,” Lybik said. “This represents a significant downside risk for multifamily fundamentals, right when demand appears the strongest in two years.”
Maximizing Your Success in Multifamily Property Sales in Naperville and Aurora
Introduction
Achieve unparalleled success in multifamily property sales in Naperville and Aurora with the strategic expertise of Randolph Taylor and the eXp Commercial team. Our dedicated approach ensures your property stands out in the competitive market. Discover innovative sales strategies on eXp Commercial's website and see how we can elevate your property's profile.
Why eXp Commercial is Your Ideal Partner
Tailored Expertise for the Naperville and Aurora MarketsRandolph Taylor brings unparalleled insights into the multifamily property landscape of Naperville and Aurora. Leveraging his extensive experience, we position your property for maximum exposure and optimal sales outcomes. Dive deeper into our market analysis techniques here.
Comprehensive Marketing Strategies At eXp Commercial, we don't just list your property; we launch it. Our comprehensive marketing strategies ensure your listing reaches a wide, qualified audience. From digital marketing to traditional advertising, we cover all bases. Learn about our unique approach here.
The eXp Commercial Advantage
Our commitment to your success is unmatched. Partnering with us means gaining access to cutting-edge tools, detailed market insights, and a team that's dedicated to achieving the best possible outcome for your multifamily property sale in Naperville and Aurora.
Conclusion
Don't leave your multifamily property sale in Naperville and Aurora to chance. Let Randolph Taylor and the eXp Commercial team guide you to success. Our expertise, tailored strategies, and unwavering dedication are the keys to unlocking your property's potential.
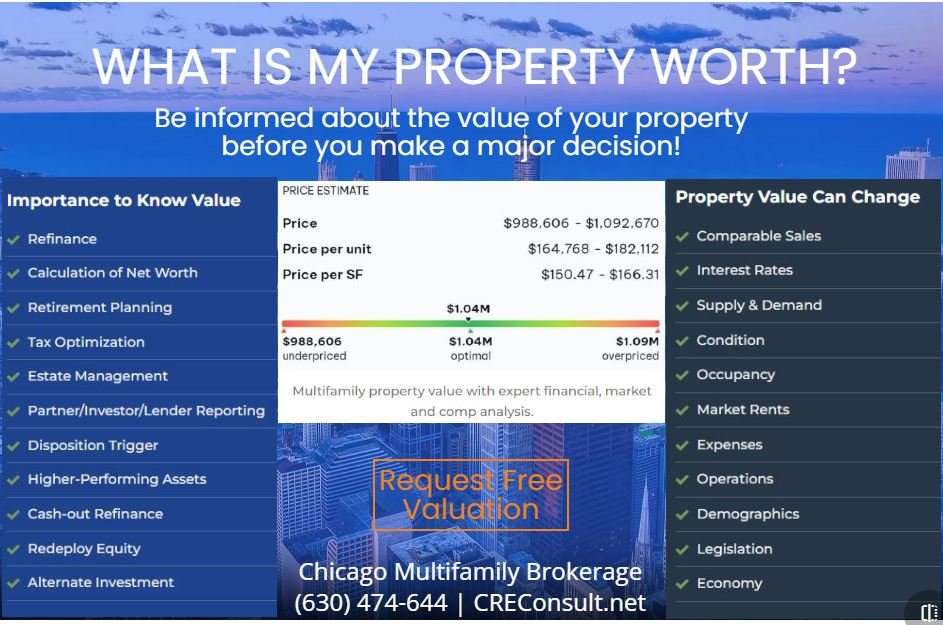
WHAT IS MY PROPERTY WORTH? Be informed about the value of your property before you make a major decision! Contact us to discuss: Broker: Randolph Taylor Multifamily Investment Sales Broker - Chicago eXp Commercial | National Multifamily Division (630) 474-6441 | rtaylor@creconsult.net https://www.creconsult.net/home-chicago-multifamily-brokerage/request-valuation/
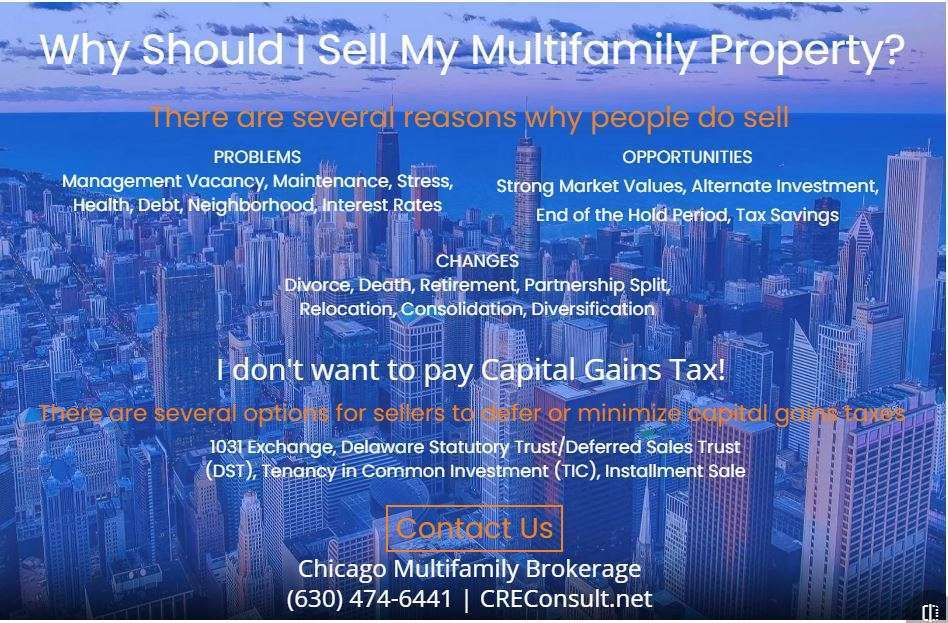
WHY SHOULD I SELL MY MULTIFAMILY PROPERTY? There are Several Reasons Why People Do Sell: Problems | Opportunities | Changes I Don't Want to pay Capital Gains Tax! There are a Number of Ways to Defer or Minimize Contact us to discuss: Randolph Taylor Multifamily Investment Sales Broker - Chicago eXp Commercial | National Multifamily Division (630) 474-6441 | rtaylor@creconsult.net https://www.creconsult.net/
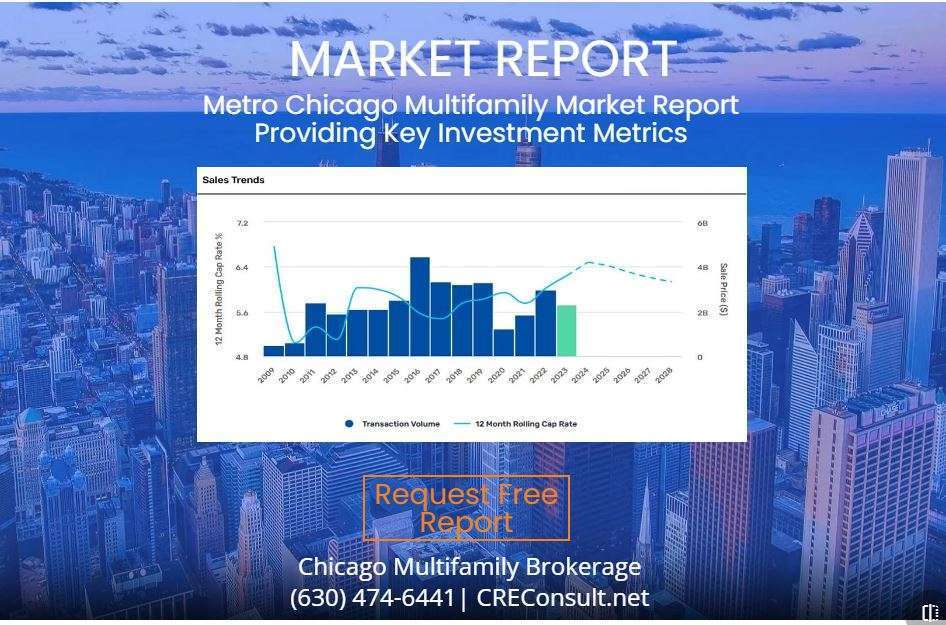
So far this year multifamily investors have shown little inclination to reverse the slow sales trend of 2023.
Last year multifamily investment volume fell by 60% from 2022 to $117.5 billion, marking the lowest annual multifamily investment volume since 2014.
This year is supposed to be a better one all around for commercial real estate as more price transparency is established and with the promise of the Fed lowering interest rates. But the early returns aren’t promising, Chad Littell, national director of U.S. capital markets analytics at CoStar Group, tells GlobeSt.com.
January 2024’s sales volume came in lower than the historical start to the year and showed a continuation of tepid transaction volume in the back half of 2023, he said.
“Two conflicting market dynamics are creating uncertainty,” according to Littell. “On the one hand, you have interest rates broadly trending lower since the third quarter of last year, which should make debt more attractive and stimulate transaction activity.
“Although the 10-year treasury yield fell roughly 100 basis points from its recent high, it didn’t appear to be enough to goose multifamily investment activity into year-end.”
Littell said one reason to consider is that net operating income (NOI) growth is slowing and, in certain markets, is turning negative.
“The question the market is digesting is how many interest rate cuts it will take to offset rising vacancy rates due to decades-high supply deliveries,” he said.
“Vacancies aren’t rising because of a fall-off in net absorption, but rather, a steady pace of absorption is being offset by new availabilities coming online.”
Littell said the second half of 2024 could see increased transaction activity as the Federal Reserve is expected to cut its policy rate while loan maturities accelerate.
“Should these rate cuts coincide with a strong labor market and continued economic surprises to the upside, the back half of 2024 could see a return to its longer-term pre-COVID pace of transaction volume,” he said.
“In the last commercial real estate downturn, multifamily transaction activity and prices bottomed together after two years before leading the other property types into a recovery.”
One stubborn problem in the space is that the bid-ask gap between buyer and seller remains very wide with apartments and that is hindering sales, Jeff Wilcox, Principal, Gantry, tells GlobeSt.com, although he adds that investment activity in Q1 2024 will most likely mirror the annualized rate of 2023 as buyers/sellers continue to hope that the Fed reduces short-term rates in the second half of the year.
“Borrowing costs, rent growth expectations, and expense growth expectations continue to drive buyer price demands lower while sellers are anchored to what they were told in 2021-2022,” Wilcox said.
He believes that the second half of 2024 will be much more active as the Fed begins to slowly lower rates, fears of inflation subside, and the economy nails the “soft landing.”
“Sellers will not get the price they may have gotten in 2021-2022 but they will feel like they are not settling for Q2 2023 prices either,” he said.
Buyers will have more clarity on the sustainability of the economy, rental projections, and limited competitive inventory deliveries, spurring them to be slightly more risk-on.”
Also supply-demand fundamentals may be better aligned as the year continues.
“Although in 2023 project completions far outweighed net absorption across the United States, it is our opinion that with construction starts dropping severely over the past 18 months, demand will outweigh new supply in 2024 and 2025,” Graham Sowden, Chief Investment Officer of RREAF says. “This will allow vacancy and rent trends to normalize over the next 18 to 24 months.”
Certain investors, meanwhile, are hunting for bargains and they are likely to find them in the multifamily space this year, Larry Connor, founder and managing partner of The Connor Group, tells GlobeSt.com.
“A significant number of properties will be hit with a valuation correction of 20% to 40%, causing many investors to run for the exits, but creating opportunity for other investors to come in and purchase properties at a discount,” Connor said.
“Even so, we see the number of properties being brought to market down 50% to 60% from a normal year. We expect to complete between $700 million and $800 million in acquisitions this year, compared to a typical year of $1 billion to $1.5 billion.”
Another example is Integra, which plans to deploy up to $150 million of equity over the next one to two years, strategically acquiring existing multifamily assets below replacement cost.
“Our focus extends to Southeast US markets with robust job and population growth, emphasizing value creation and strong cash flow opportunities,” Matt Scarola, Head of Multifamily Investments at Integra Investments tells GlobeSt.com. “As we target markets and submarkets with high short-term delivery forecasts, our approach remains grounded in recognizing complex trends of underlying job and population growth, ensuring a sustainable investment strategy.”
Brandon Polakoff, Principal and part of Avison Young’s Tri-State Investment Sales team, said in New York City, that he anticipates an increase in both sales volume and dollar volume, with the expectation we see a larger shift in the second half of the year.
“Still, significant appetite from private families/investors remains to park personal capital in the mid-market space (less debt) because NYC commercial real estate remains one of the top havens across the world,” Polakoff said.
“However, rate cuts are needed for everyone to fully jump in. At that point, we will likely achieve a herd mentality and the buyer/seller gap will narrow. This would be similar to the late summer/fall of 2021 surge coming out of COVID-19.”
James Nelson, Principal, Head of Tri-State Investment Sales, Capital Markets Group, Avison Young, said it’s important to bear in mind that the NYC 10-year average is $34.2B whereas 2023 was $9.69B.
“There should be some pent-up demand,” he said. “We could get to $15B pretty easily if there were some big-ticket sales that needed to transact.”
Maximizing Your Success in Multifamily Property Sales in Naperville and Aurora
Introduction
Achieve unparalleled success in multifamily property sales in Naperville and Aurora with the strategic expertise of Randolph Taylor and the eXp Commercial team. Our dedicated approach ensures your property stands out in the competitive market. Discover innovative sales strategies on eXp Commercial's website and see how we can elevate your property's profile.
Why eXp Commercial is Your Ideal Partner
Tailored Expertise for the Naperville and Aurora MarketsRandolph Taylor brings unparalleled insights into the multifamily property landscape of Naperville and Aurora. Leveraging his extensive experience, we position your property for maximum exposure and optimal sales outcomes. Dive deeper into our market analysis techniques here.
Comprehensive Marketing Strategies At eXp Commercial, we don't just list your property; we launch it. Our comprehensive marketing strategies ensure your listing reaches a wide, qualified audience. From digital marketing to traditional advertising, we cover all bases. Learn about our unique approach here.
The eXp Commercial Advantage
Our commitment to your success is unmatched. Partnering with us means gaining access to cutting-edge tools, detailed market insights, and a team that's dedicated to achieving the best possible outcome for your multifamily property sale in Naperville and Aurora.
Conclusion
Don't leave your multifamily property sale in Naperville and Aurora to chance. Let Randolph Taylor and the eXp Commercial team guide you to success. Our expertise, tailored strategies, and unwavering dedication are the keys to unlocking your property's potential.
While the U.S. economy remains robust, inflation pressure continues, which could keep mortgage rates higher for longer.
Home sales ticked up slightly because of lower mortgage rates in January. However, inventory remains tight and the rate lock effect has been a key barrier to home sale volumes.
Homeowners’ insurance costs are growing but are a small fraction compared to the mortgage principal and interest payments. MORE
Recent developments
U.S. economy: U.S. economic growth remained solid at 3.2% in Q4 2023 as per Bureau of Economic Analysis’ second estimate of GDP. While this is slightly lower than the Q3 growth of 4.9%, it remains above estimates of long-term potential growth. The slowdown in growth reflects a downturn in private inventory investment and federal government spending. However, consumption spending remained a key component in growth, contributing two percentage points to the overall growth. Government spending increased 4.2% over Q4 compared to the 5.8% increase in Q3 and private investment increased 0.9% over Q4 compared to the 10.0% increase in Q3. Residential investment remained positive but slowed down from the 6.7% quarter-over-quarter increase in Q3 to 2.9% in Q4 2023. As of writing, the latest nowcasts for Q1 2024 GDP growth from the New York Federal Reserve Bank1 and the Atlanta Federal Reserve Bank2 are tracking 2.1% and 2.5% respectively. In total these estimates point to an economy that continues to expand, but at a moderating pace.
The labor market remains resilient with nonfarm payroll employment increasing by 275,000 in February 2024. Total nonfarm payroll for December 2023 and January 2024 were revised down by a combined 167,000 jobs. But, even with the downward revisions, the economy still added an average of 252,000 jobs in the last two months.3 The unemployment rate ticked up to 3.9% in February, up 0.2 percentage points from January. While this is the highest level of unemployment rate since January 2022, it remains below 4% for the twenty-fifth consecutive month, the longest streak since the 1960s.
Job openings remained steady at around 8.9 million in January 2024, according to the Bureau of Labor Statistics (BLS) Job Openings and Labor Turnover Survey (JOLTS). The ratio of job openings to unemployed, a metric that the Federal Reserve has been tracking to gauge the strength of the labor market, changed little at 1.45 in January, up from 1.42 in December 2023 indicating more job openings than unemployed. Historically, smaller firms (<250 employees) have generated more jobs (Exhibit 1). Post the pandemic, with technological advancements and increase in remote work, there has been tremendous growth in small businesses adding more labor demand by smaller firms.4 However, small businesses have been struggling to fill open positions as per the National Federation of Independent Business (NFIB). As of January 2024, 39% of all owners reported job openings they could not fill.5
Inflation as measured by the price index for Personal Consumption Expenditures (PCE) excluding food and energy rose 2.8% year-over-year in January 2024 and remains at its lowest level since early 2021. So called “supercore” inflation—measured with the PCE price index excluding food, energy and housing—another metric that the Federal Reserve started tracking to gauge progress on inflation, picked up again in January 2024 with 3.5% year-over-year growth after cooling in December. While inflation has been moderating, the overall level of inflation remains above the Federal Reserve target and there is a risk that progress could halt or reverse, which may increase the amount of time before the Federal Reserve’s next rate cut.
Overall, the U.S. economy continues to follow the path it has been on in recent months. Economic growth remains robust, job growth is also strong, and inflation, while moderating, remains elevated relative to the Federal Reserve’s long-run target.
U.S. housing and mortgage market: The drop in mortgage rates from an average of 7.4% in November 2023 to an average of 6.8% and 6.6% in December 2023 and January 2024, respectively helped home sales recover from the lows of 2023. Total (existing + new) home sales for January 2024 were at 4.66 million, up 2.9% from December 2023 but were down 1.2% from January 2023. Existing home sales grew 3.1% from December 2023 to 4.0 million in January, the largest monthly gain in a year. While month-over-month existing sales increased, they are still 1.7% below the levels of January 2023. The existing housing inventory in January 2024 increased slightly by 2% from December 2023 and was at 1.01 million units representing 3.0 months of supply at the current monthly sales pace. The median price was $379,100, up 5.1% from last year. This increase contributes to the ongoing affordability struggle in the housing market. Affordability is at a nearly 30-year low which is keeping many potential homebuyers on the sidelines.
New home sales for January 2024 were at 661,000, 1.5% above December 2023 sales. With affordability becoming increasingly challenging, 62% of builders reported providing sales incentives in January while 25% reported price cutting according to National Association of Home Builders (NAHB).6 Housing starts were down 14.8% from December 2023.7 The decline was largely due to a 35.8% decline in the multifamily unit construction.
Home prices continue to exhibit strength. The FHFA Purchase-Only Home Price Index for December 2023 rose 0.1% month-over-month compared to 0.4% in November 2023 and was up 6.6% year-over-year. Despite the deceleration in December, house prices continue to outpace overall consumer prices.
Mortgage rates resumed their upward trajectory in February and averaged 6.8% for the month, as measured by Freddie Mac’s Primary Mortgage Market Survey®. This increase was mainly due to the stronger than expected inflation measures with the markets pushing out the expectation of the Fed pivot to the second half of the year. Mortgage activity declined over the month on these higher rates. Overall activity was down 8.8% year-overyear on average in February. Refinance activity was up 2.9% as compared to last year and purchase applications were down 13.7% year-over-year.8
Banks, on balance, reported tightening lending standards for most loan categories during Q4 2023, according to the Federal Reserve Board’s Senior Loan Officer Opinion Survey on Bank Lending Practices (SLOOS).9 For commercial and industrial (C&I) loans as well as for all commercial real estate (CRE) loans, banks reported tighter standards and weaker demand during Q4 2023. Banks also reported tighter lending standards and weaker demand for all categories of residential real estate (RRE) loan categories, with the exception of government residential mortgages and government-sponsored enterprise (GSE) eligible residential mortgages. Regarding banks’ future expectations, they are expecting the lending standards to tighten for CRE, credit card and auto loans but for C&I and RRE loans, they expect lending standards to remain unchanged. Banks also reported that they are expecting a deterioration in credit quality—as measured by delinquencies and chargeoffs- across most loan types over 2024.
To summarize, the stability in rates brought back some activity into the housing market in January, with increases in existing and new home sales. However, tight inventory is still a key barrier to home sale volumes.
Outlook
The U.S. economic outlook remains broadly positive. We continue to expect modest economic growth, albeit at a slower pace than the previous year, resulting in moderating payroll employment growth and a modest uptick in the unemployment rate. While we expect inflation to eventually moderate, in the short run, a growing economy will keep inflation above the 2% target level. Therefore, we expect the Federal Reserve to not cut rates until the summer at the earliest and potential upside surprises on inflation could push rate cuts out even further. As a result, treasury yields will remain elevated in the near term, keeping mortgage rates elevated. We forecast mortgage rates to stay above 6.5% through this quarter and next.
The housing market remains challenged due to high mortgage rates and a lack of inventory for sale. However, we expect a modest recovery in home sales as mortgage rates drift down in the latter half of the year which is under a scenario where inflation moves closer to the target, prompting the Federal Reserve to cut the federal funds rate. The recovery, however, will be limited as the rate lock effect will prevent homes from coming on the market. We expect upward pressure on home prices to remain as more first-time homebuyers continue to flood the housing market that is plagued by a lack of supply. As a result, we forecast home prices to increase 2.5% in 2024 and 2.1% 2025.
Under our baseline scenario, we expect the dollar volume of purchase origination to improve modestly in 2024 and 2025. Despite firm price growth, our view on originations is subdued since a modest recovery in home sales coupled with a rising share of cash purchases will restrict purchase origination volumes from growing significantly. Although we expect mortgage rates to drift down, there will be limited refinance activity as many homeowners have locked in historically low mortgage rates and the incentive to refinance is close to non-existent for a large share of homeowners. Together, we expect total mortgage origination to remain low through most of 2024 but start to increase at the end of the year and see modest increases in 2025.
While our outlook remains optimistic, caution is warranted considering the fight against stubborn inflation may drag on longer. And if the expectation of deteriorating credit quality is realized, it could be detrimental to housing demand, however we do not expect any major negative credit event under our baseline scenario.
MARCH 2024 SPOTLIGHT:
The cost of homeowners’ insurance
The cost of homeownership has risen significantly in recent years. This is largely driven by high mortgage payments fueled by elevated mortgage rates, but homeowners’ (HO) insurance costs also have a part to play – although at a smaller scale compared to mortgage principal and interest payments. HO insurance provides financial protection against physical damage to a property.10 As such, it helps safeguard home values, especially in the event of large, unexpected losses resulting from natural disasters such as tornadoes, hurricanes and wildfires. However, as a recurring cost of owning a home, albeit a relatively smaller component, surging insurance premiums could add extra cost burdens on many households in this high borrowing cost environment. Using data from Uniform Closing Database (UCD)11 we estimate the cost of HO insurance over time and across the U.S.
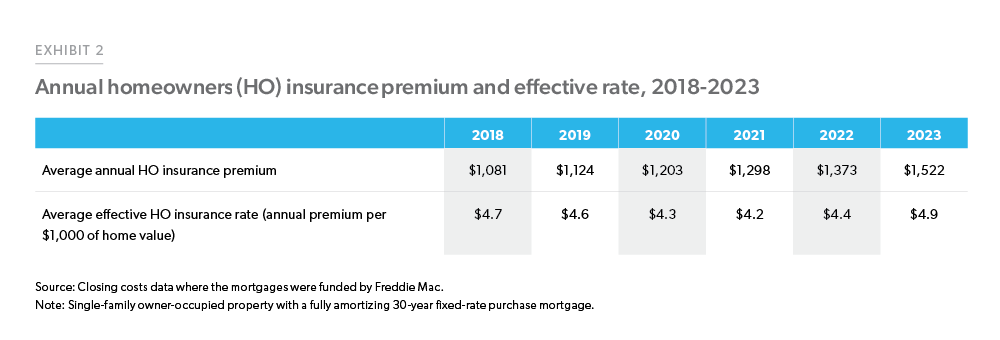
Based on our estimates, the average annual HO insurance premium (without adjustment) was $1,081 in 2018 among Freddie Mac borrowers for a single-family owner-occupied home with a conventional 30-year fixed-rate mortgage. By 2023, the average borrower had to pay an annual premium of $1,522, which was 10.8% higher than in 2022, and 40.8% higher than in 2018 (Exhibit 2).
Over the last five years, the value of homes owned by Freddie Mac borrowers, and therefore the value insured by HO insurance policies, has also changed. To facilitate comparison, we calculated the effective rate paid by each borrower by scaling the annual HO insurance premium over the home value. Note that the value of a home also includes the value of the land it sits on. Therefore, the actual effective HO insurance rates paid by policyholders are likely to be higher than our estimates, considering that HO insurance premiums are set based on the cost of rebuilding the home.
On average, the effective HO insurance rates have remained fairly stable. In 2023, the average borrower paid $4.90 in HO insurance premium for every $1,000 of their home’s value, compared to the 2018 rate of $4.70 per $1,000,12 showing a slight increase of $0.20.
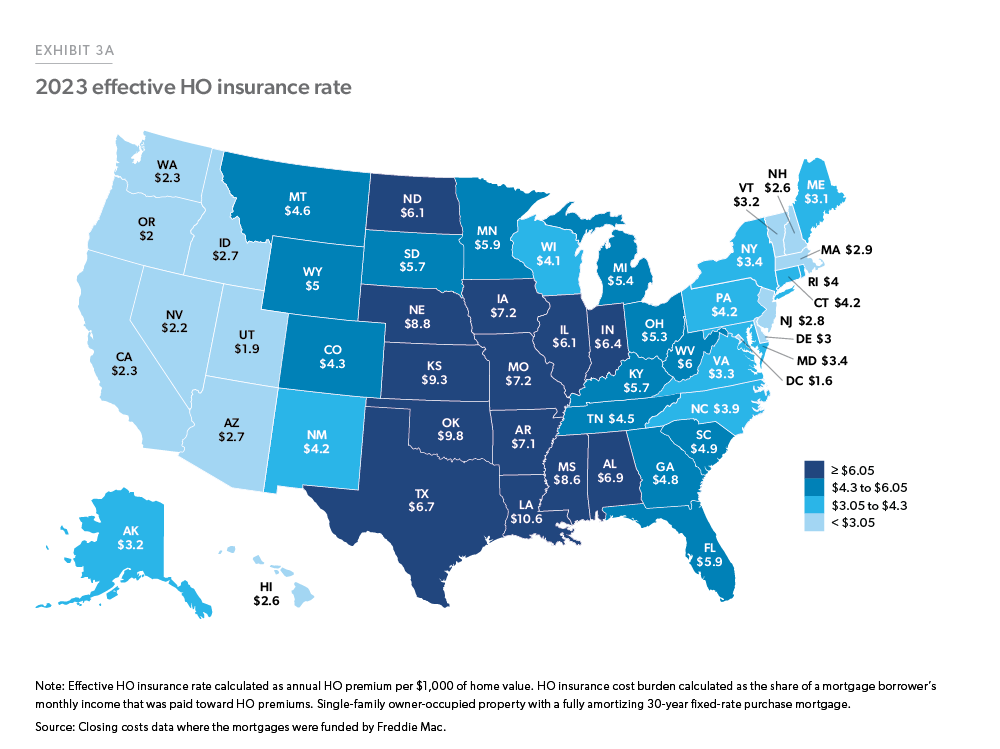
There is a large difference in the effective HO insurance rates paid by mortgage borrowers across the U.S. (Exhibit 3A). In 2023, mortgage borrowers from LA, OK, KS, NE, and MS paid an average HO insurance premium of over $8 for every $1,000 home value, whereas borrowers from CA, WA, NV, OR, UT, and DC paid less than $2.5 for every $1,000 home value. The higher rates observed in the central U.S. are consistent with aggregated statistics collected by the National Association of Insurance Commissioners (NAIC).13 While exposure to natural hazards is one of many factors that affect HO insurance rates across different states, varying regulatory environments may also play a role.14 In CA, for instance, insurance companies offering HO insurance are subject to strict regulation, which limits the rates they can charge. This may in part explain why we observe a relatively lower HO insurance rate in CA, compared to other similarly disaster-prone states such as LA and MS.
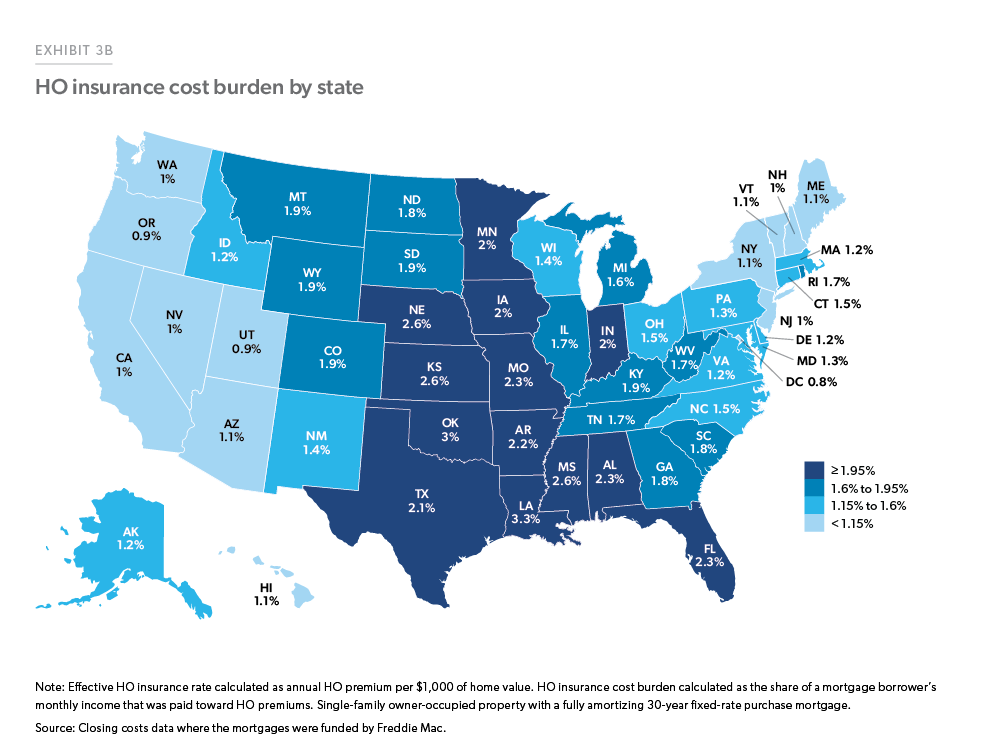
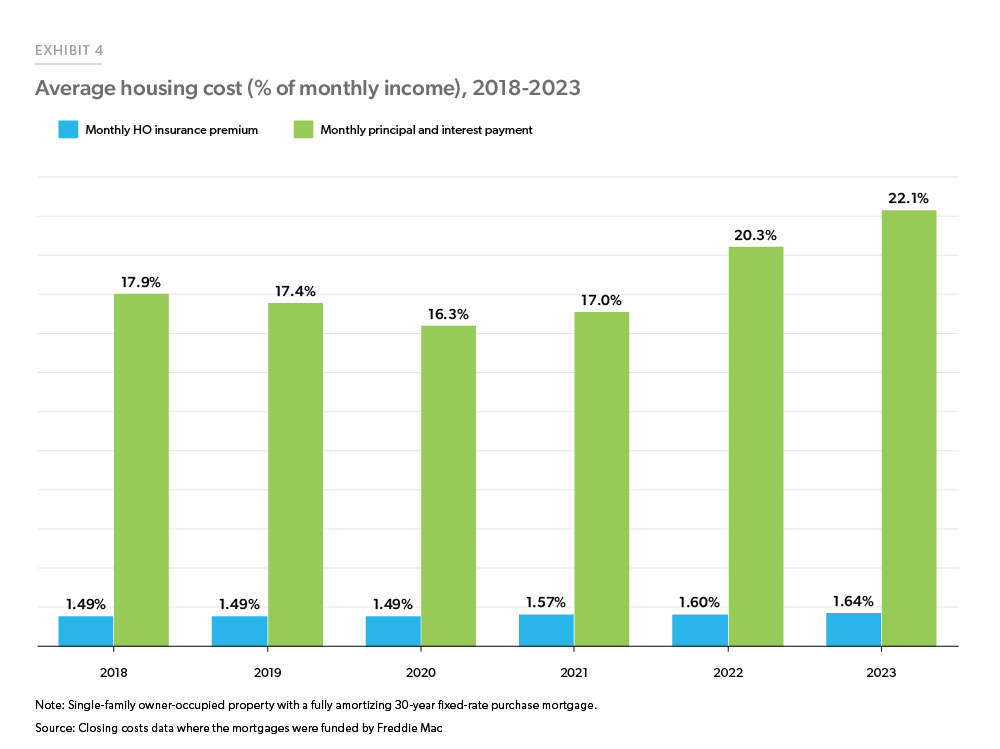
As HO insurance premiums continue to rise, one question of interest is how much of a financial burden these costs place on borrowers. To quantify the extent of associated cost burdens, we calculated the share of a borrower’s monthly income that was paid toward HO insurance premiums. Our analysis in Exhibit 4 shows that, in 2018, HO insurance premiums accounted for an average of 1.49% of a borrower’s monthly income. In 2023 the share had moved up by 10% to 1.64% of an average borrower’s income. The impacts were particularly significant in certain states such as LA, OK, KS, NE, and MS, where borrowers paid over 2.5% of their monthly income towards HO insurance premiums (Exhibit 3B). During the same period, borrowers also had to allocate a greater share of their income towards mortgage principal and interest payments, resulting in high housing cost burdens. Note that while we control for the type of property and occupancy status over time the average Freddie Mac borrower profile has changed between 2018 and 2023 and therefore the variation in insurance cost and P&I may arise from the changing borrower mix. Nevertheless, Exhibit 4 demonstrates that while insurance costs have added to cost burdens, the net impact is much smaller than the impact of higher mortgage principal and interest payments.
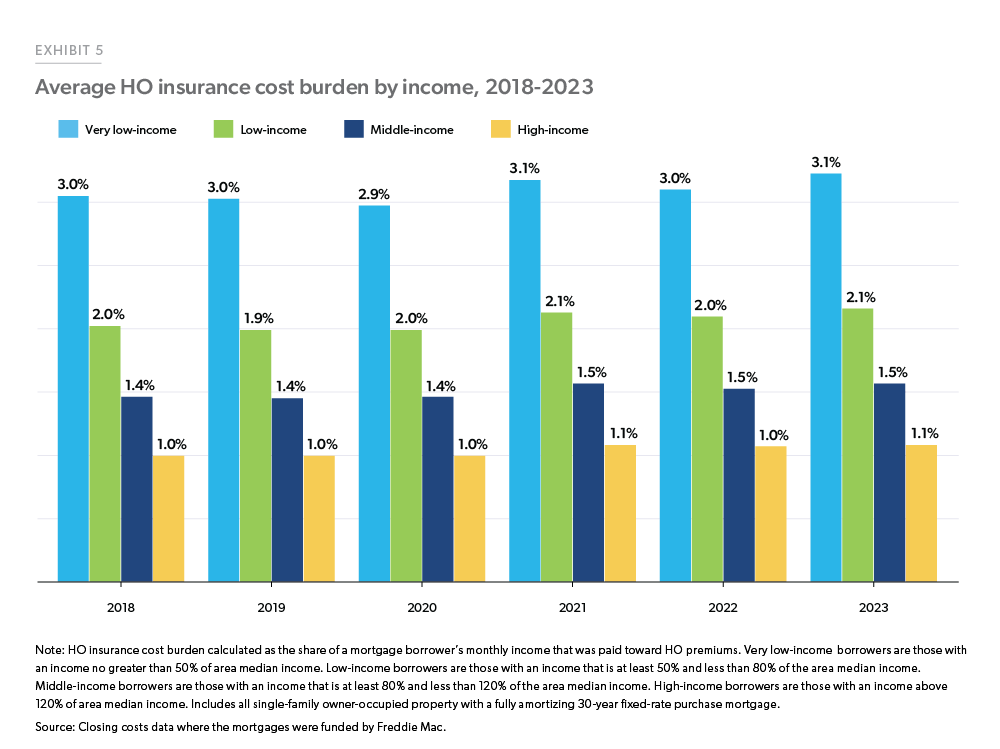
Despite widespread cost burdens across geographies, some homeowners, especially those with lower income, are affected more by increased costs of HO insurance. We find that between 2018 and 2023, very low-income borrowers (those with an income no greater than 50% of area median income) were consistently most burdened by such costs. As shown in Exhibit 5, in 2023, the HO insurance premiums took up 3.1% of their monthly income, which was significantly higher than low-income (2.1%), middle-income (1.5%), and high-income groups (1.1%).15
To conclude, as a component of ongoing housing expenses, HO insurance costs are growing but are a small fraction compared to the mortgage principal and interest payment. However, even a small incremental increase in HO insurance cost will impact those at the margin. Our findings highlight substantial heterogeneity in such costs and the cost burdens experienced by borrowers. We find that the effective HO insurance rates were the highest in the central U.S., leading to notable cost burdens in several states within this region. Among all income groups, lower-income borrowers were more challenged. While the costs of HO insurance remain a small fraction of housing expenses, it’s a trend that we will continue to track going forward.
CHICAGO MULTIFAMILY BROKERAGE No Matter Where You Are In The Investment Cycle We Can Help You! A Commercial Real Estate Brokerage firm specializing in listing and selling multifamily properties in the Chicago metropolitan area. Randolph Taylor Multifamily Investment Sales Broker - Chicago eXp Commercial | National Multifamily Division (630) 474-6441 | rtaylor@creconsult.net https://www.creconsult.net/
Just Listed: Golf Sumac Medical Offices Des Plaines IL Price: $3,900,000 SF: 35,245 Stories: 3 Occupancy: 82.3% Cap Rate: 9.63% * Stabilized Medical Office Building with Value-Added Potential * Established Medical Tenants * 5 Minutes from Advocate Lutheran General Hospital * 1/2 mile to I-294 and Milwaukee Avenue * Recent Building Modernization * Value Add Through Leasing of Vacant Space
Listing Agent: Randolph Taylor rtaylor@creconsult.net | 630.474.6441
Just Listed: 24 Unit Multifamily Dekalb Price: $1,200,000 87.5% Occupancy Below-market rents Solid Flexicore Construction New Boiler/Newer Roof Resurfaced Parking Lot Listing Agent: Randolph Taylor rtaylor@creconsult.net | 630.474.6441
As the commercial real estate market navigates through the uncertainties of 2023, the 'largest apartment deals 2023' stand out, showcasing significant transactions despite economic shifts. This article delves into the most noteworthy apartment sales, offering an in-depth analysis of trends and their implications for the market.
Following record-setting sales in 2021 and 2022, investments in U.S. apartments plummeted in 2023 amid the rising cost of debt and economic uncertainty. However, the asset class remains an attractive commercial real estate investment compared to other asset types. And six apartment communities changed hands for over $200 million during the year.
More than 5,400 apartment properties changed hands at a value of $119 billion during 2023, according to data from MSCI Real Capital Analytics. The overall sales volume in 2023 was down 61% year-over-year. This was also well below the record-setting sales that averaged $332 billion per year in 2021 and 2022, when a total of about 25,000 properties changed hands as the result of pent-up demand following the onset of the pandemic.
Recent activity was also well below the $169 billion annual average logged during the five years leading up to the pandemic (2015-2019). The average price per unit was also down, registering at $204,216 in 2023, off 13% year-over-year. While that was the lowest level since 2020, it was well above the per unit pricing from 2015 to 2019 which averaged $151,000. Meanwhile, cap rates for apartment transactions in 2023 were up 60 basis points (bps) year-over-year, averaging 5.3%. That was the highest cap rate in four years. Still, apartment cap rates during 2023 remained the lowest among major property types.
Following are the largest single-asset market-rate apartment transactions during 2023, all selling for over $200 million and representing every region of the country.
Solow Tower Apartments
The largest single-asset apartment transaction during 2023 was the sale of Solow Tower Apartments in New York. In April, Manhattan-based real estate investor Black Spruce Management acquired a 45-story residential tower in Manhattan’s Upper East Side. Black Spruce purchased the high-rise from New York-based Solow Realty, a division of Soloviev Group, for approximately $403 million. The 322-unit building at 265 E. 66th St. was built in 1979 and renovated in 2015. The purchase price came to roughly $1.25 million per unit. Amenities include a doorman, concierge, fitness center, pool and sundeck.
Southgate Towers
In January, Denver-based Apartment Income REIT Corp. (AIR Communities) purchased the 495-unit Southgate Towers apartment community in Miami from Virginia-based Gumenick Properties. The development traded for approximately $241 million, ranking as the second-largest single-asset apartment transaction during 2023. The sale price came to around $487,900 per unit. The property sits on four acres on West Avenue overlooking Biscayne Bay in Miami Beach, within the Downtown Miami/South Beach submarket. The pair of 14-story buildings were built in 1958 and Gumenick completed a $40 million renovation in 2016. The community features a fitness center, yoga studio, lap pool, resort-style pool, EV charging stations, pool-side cabanas, grilling stations, community lounge and community pier.
The Elm
The third-largest apartment transaction to take place in the nation during 2023 was the sale of an asset in the Washington, DC market. At the end of August, Washington, DC-based Carr Properties sold The Elm on Wisconsin Avenue in Bethesda. Denver-based Apartment Income REIT Corp. (AIR Communities) bought the two-tower community with 456 units for $220 million or roughly $515,600 per unit. Carr completed construction on the transit-oriented development in 2001. The 28-story apartment towers are connected on the 28th floor which features a rooftop pool and fitness center, and on the 17th floor, there is a landscaped terrace.
Camden Martinique (The Grand Costa Mesa)
In late December, Irvine, CA-based Advanced Real Estate purchased the Camden Martinique apartment community in Anaheim. Houston-based Camden Property Trust sold the development for $232 million, the nation’s fourth-largest apartment transaction last year. The 714-unit community traded for roughly $325,000 per unit. The four-story development off Pinecreek Drive in Costa Mesa was built in 1986. Advanced Real Estate plans to invest $45 million to remodel the complex which will include adding resort-style pools and spas, an extensive dog park and barbecue areas. The renovation is expected to take four years to complete. The community has been rebranded The Grand Costa Mesa.
727 West Madison (One South Halsted)
In August, a joint venture between California-based Ares Management and locally based F&F Realty sold a 45-story apartment tower in Chicago to Pontegadea, a Spain-based real estate company. The 492-unit apartment tower traded for nearly $232 million, ranking as the fifth-largest transaction in the nation during 2023. The sales price equated to roughly $471,000 per unit. The oval-shaped multifamily tower at 727 W. Madison St. (formerly known as One South Halsted) in The Loop was built in 2019 and is Chicago’s tallest building west of the Kennedy Expressway. Amenities at 727 West Madison include a resort-style pool and spa, pool-side cabanas, grilling stations, fitness center, yoga studio, resident lounge with demonstration kitchen, club room with billiards, 24-hour concierge, theater room, coworking space, dog spa, dog park and bicycle storage.
Palisade at Westfield UTC
Property Reserve Inc. of Salt Lake City acquired the 300-unit Palisade apartment community in early December. The 23-story building on Lombard Place in San Diego’s La Jolla/University City submarket was built in 2019 and contains 300 units. New York-based JP Morgan Chase sold the development for $203 million, the sixth-largest transaction in the nation during 2023. The purchase price came to nearly $677,000 per unit. Amenities include a 4,300-square-foot indoor/outdoor rooftop sky lounge, a resort-style pool, fitness center, resident lounge, yoga and spin studios, co-working café, outdoor kitchen, karaoke room, private event space, bike storage, pet run and steam rooms.
Maximizing Your Success in Multifamily Property Sales in Naperville and Aurora
Introduction
Achieve unparalleled success in multifamily property sales in Naperville and Aurora with the strategic expertise of Randolph Taylor and the eXp Commercial team. Our dedicated approach ensures your property stands out in the competitive market. Discover innovative sales strategies on eXp Commercial's website and see how we can elevate your property's profile.
Why eXp Commercial is Your Ideal Partner
Tailored Expertise for the Naperville and Aurora MarketsRandolph Taylor brings unparalleled insights into the multifamily property landscape of Naperville and Aurora. Leveraging his extensive experience, we position your property for maximum exposure and optimal sales outcomes. Dive deeper into our market analysis techniques here.
Comprehensive Marketing Strategies At eXp Commercial, we don't just list your property; we launch it. Our comprehensive marketing strategies ensure your listing reaches a wide, qualified audience. From digital marketing to traditional advertising, we cover all bases. Learn about our unique approach here.
The eXp Commercial Advantage
Our commitment to your success is unmatched. Partnering with us means gaining access to cutting-edge tools, detailed market insights, and a team that's dedicated to achieving the best possible outcome for your multifamily property sale in Naperville and Aurora.
Conclusion
Don't leave your multifamily property sale in Naperville and Aurora to chance. Let Randolph Taylor and the eXp Commercial team guide you to success. Our expertise, tailored strategies, and unwavering dedication are the keys to unlocking your property's potential.
Just Listed: Golf Sumac Medical Offices Des Plaines IL Price: $3,900,000 SF: 35,245 Stories: 3 Occupancy: 82.3% Cap Rate: 9.63% * Stabilized Medical Office Building with Value-Added Potential * Established Medical Tenants * 5 Minutes from Advocate Lutheran General Hospital * 1/2 mile to I-294 and Milwaukee Avenue * Recent Building Modernization * Value Add Through Leasing of Vacant Space
Listing Agent: Randolph Taylor rtaylor@creconsult.net | 630.474.6441
Just Listed: 24 Unit Multifamily Dekalb Price: $1,200,000 87.5% Occupancy Below-market rents Solid Flexicore Construction New Boiler/Newer Roof Resurfaced Parking Lot Listing Agent: Randolph Taylor rtaylor@creconsult.net | 630.474.6441
Just Listed: 24 Unit Multifamily Dekalb Price: $1,200,000 87.5% Occupancy Below-market rents Solid Flexicore Construction New Boiler/Newer Roof Resurfaced Parking Lot Listing Agent: Randolph Taylor rtaylor@creconsult.net | 630.474.6441
The loan-to-value ratio (LTV) is a common metric used in commercial real estate analysis and computations. LTV is the ratio of the bank's loan amount to the value of the commercial property. It is calculated by dividing the loan amount by the value of the property and expressed as a percentage. In this post, we review the LTV formula, how to calculate it, what its significance is, and how it is used in real estate financing. We include examples of how to use the LTV ratio in calculations.
The Loan to Value (LTV) expresses the ratio of the loan amount to the property value as a percentage. This simple metric is used by appraisers to determine the market capitalization rate or by lenders to determine the size of the loan and to quantify credit quality of existing loans.
The LTV ratio measures the cushion between outstanding loan amount and the property value. Higher LTV implies higher risk for the lender and vice versa. In underwriting, the LTV always appears together with other underwriting metrics such as the debt service cover ratio (DSCR or just DCR) and the debt yield ratio as these determine the feasibility of the financing.
The loan to value (LTV) is the (principal) amount of the loan divided by the property value:
The LTV is expressed as a percentage rate. To calculate the loan amount for a known or given LTV rearranging the formula yields
Lenders use this formula to determine the loan amount for specific financing requirements.
First, a lender estimates the value of the property or hires an appraiser to provide a valuation. This property value is then used in the LTV formula.
As an example, lender determines the LTV for a property appraised at $4,000,000 and a loan amount of $1,000,000 as 1,000,000/4,000,000 = 25%.
In most cases, the LTV is known and we wish to determine the loan amount. Suppose credit policy requires maximum LTV of 75% and the property value is $10,000,000. Here, using the rearranged LTV formula gives 10,000,000 x 75% = $7,500,000 as the loan value.
Bank or lenders typically use the minimum of property appraised value when calculating LTV. For construction or renovation projects, the denominator of the LTV formula includes total project costs instead of just property value. In case the loan is solely to cover construction costs, one uses the loan to cost ratio (LTC) rather than the LTV.
If the LTV ratio equals 100% this means the outstanding loan amount equals the property value. LTV higher than 100% implies the property is worth less than the outstanding loan amount which should not be the case. Contrary, LTV lower than 100% means the property is worth more than the outstanding loan amount.
Lenders require the LTV to be much lower than 100% to have a safety margin. Actual LTVs vary significantly depending on the property type, borrower credit risk, and the bank’s internal credit policy. Usually, LTV ratios range from 40% to 70%.
Now we look at examples of how the LTV is used to calculate the maximum loan amount, how appraiser use LTV to determine the market cap rate, and finally, how to calculate cash-on-cash return using LTV and weighted average cost of capital.
The LTV is commonly used by lenders in a maximum loan analysis which determines the maximum loan amount a lender can support. Here is an example of a maximum loan analysis.
The analysis above first calculates a maximal LTV loan as $1,875,000 using the LTV formula. Then, maximal supportable loan is calculated using DSCR, resulting in $1,719,766. Lender would take the smaller of the two values and the maximal supportable loan amount would be $1,720,000 after rounding up.
While appraising, one would often use the LTV in a band of investment calculation, which is a weighted average cost of capital calculation that helps determine the market capitalization rate. In the formula below, Rp is the free return on the property, Rd is return to the debt on the property, and Re is the return on the levered equity in the property, respectively.
$$R_p = LTV times R_d + (1 - LTV) times R_e$$
Appraisers survey local lenders (to extract typical loan terms for subject property) and investors (to find out the typical required cash-on-cash returns) in order to determine overall capitalization rate for a given market and property type.
Example: For the subject property, lenders underwrite loans at 75% LTV, amortized over 25 years, and at an interest rate of 5%. This results in a mortgage constant of 0.07015. Investor surveys show the cash-on-cash return required by most investors is 11%. The over capitalization rate is estimated as:
$$R_p = 75% times 0.07015 + 25% times 0.11 = 8%$$
The above analysis is often used during slow market periods or in tertiary markets where it is hard to find extensive market data.
Employing the weighted average cost of capital formula is also useful to calculate cash on cash returns in case we have insufficient information or data. For this purpose, one rearranges the formula to solve for the return on equity (ROE).
$$R_e = fracR_p - LTV times R_d1 - LTV$$
We can use this formula to solve for cash on cash using LTV, the return on debt, and the return on the property.
Example: Considering the example of the previous section. Note the mortgage constant 0.07015 is our return on debt, and the overall capitalization of 8% is our return on the property. Solving for the cash on cash return on equity yields
$$R_E = frac0.080113 - 75% times 0.07015025% = 11%$$
Hence, LTV ratio together with the mortgage constant and the cap rate can be used in a swift calculation of the cash on cash return.
The loan-to-value ratio is commonly used in CRE and is an integral metric for real estate analysis involving financing and acquisition. This post reviewed the definition of LTV, how to calculate the LTV ratio, and its meaning. We showcased several application of using LTV in calculating maximum supportable loan, the band of investment calculation, and the weighted average cost of capital calculation.
But commercial brokers, attorneys and policy watchers are greeting what amounts to potentially earth-shattering changes in commission structure on the residential side with a general shrug of the shoulders, despite a few exceptions that pertain mostly to condo sales and crossover agents who dabble in commercial real estate deals that turn up on multiple listing services.
“I don’t think it’ll change the big picture on the CRE side,” said Shams Merchant, a Fort Worth-based real estate attorney with Jackson Walker, pointing out the fact that commercial transactions have always been different than residential sales, with commercial landlords and sellers free to negotiate commissions with buyers or tenants' brokers as an incentive to lease or sell a property.
On CRE's side is the fact that “there’s no industry standard” to spark antitrust concerns and no organized clamor to do so, Merchant said.
In mid-March, NAR agreed to pay $418M in damages over four years to settle lawsuits levied by home sellers who argued the organization's longstanding rules on broker commissions resulted in excessive fees. As part of the settlement, NAR said it would revisit its standard 6% sales commission fee for residential Realtors in a move some real estate observers said would “blow up the market” for brokers that are among the world's best-paid.
The rule changes from NAR’s settlement will ban it from allowing a seller’s agent to set compensation for a buyer’s agent, remove commission information from multiple listing services, no longer require agents to subscribe to MLS and mandate that buyer agents enter into individualized buyer-broker agreements with clients.
Researchers say the shift could result in Realtors’ commissions falling by as much as 50% annually and up to 2 million U.S. agents leaving the field. But commercial real estate brokers and transactions likely won’t be impacted to a significant degree, according to experts who spoke to Bisnow.
“We deal directly with our clients on listings, so we’re not using the MLS,” said R.J. Jimenez, an Oklahoma City-based industrial broker with NAI Sullivan Group. “The software we use isn’t proprietary to Realtors only, so I think that’s what helps out.”
What's more, Jimenez said, no agency holds a monopoly on commissions in the commercial sphere. In the aftermath of the NAR settlement, Jimenez launched a social media thread asking brokers if they anticipated any changes on the commercial side due to the settlement.
Answers ranged from “It doesn't” to “We get paid based on how much value we bring to the sale. Not whether the buyer likes the pool and kitchen.” Some speculated the rules change could prompt more residential agents to move over to the commercial side, while others tossed doubt on that idea, saying that “good selling agents will educate their seller on paying a buyers agent so as to not reduce that buyers pool that cannot afford to pay for their agent.”
While the fallout may push some Realtors out of the profession, it's unlikely that they'll move in droves to the commercial real estate sector because they're just so different, sources told Bisnow.
It takes years of consistency for commercial brokers to get to a place where deals are regularly happening, while many residential agents do real estate part-time or as a side job, Merchant said.
“You can’t do that on the commercial side," he said. "It’s a full-time job."
Since the settlement announcement, NAR has stressed that it does not set commissions, only requiring that listing brokers communicate an offer of compensation. But most U.S. agents specify a commission of 5% or 6%, according to the New York Times, leading to the antitrust charges.
The impact of the NAR settlement on day-to-day CRE exchanges is expected to be minimal, but the lawsuit could potentially seep into some limited segments, Merchant said.
“The mom and pop owners who own one or two properties might be more reluctant now to pay the tenant broker’s commission,” he said.
Those types of property owners don’t have as much capital to pay out tenant brokers’ commissions, and the NAR lawsuit shows them they don’t have to. That could lead to more tenant brokers entering into exclusive representation agreements with their tenants, he said. Those agreements would specify that if the landlord does not cover their commission, the tenant will, he said.
“This is common, but it may become more common going forward,” Merchant said.
In addition, residential Realtors are already sometimes involved in commercial transactions and will have to shift to abide by NAR rules, said Ed DiMarco, a Realtor based in Naples, Florida.
DiMarco, who sometimes works with small-to-midsize commercial property transactions, said that he would always choose to be a member of NAR. Naples has a smaller commercial market, and most listings are on an MLS, he said.
“I probably find more [of my] listings on the actual MLS managed by the National Association of Realtors,” DiMarco said. “They've also been going after commercials for over a decade now, real hard, and they have some great tools.”
The lawsuit settles what DiMarco has always seen as a conflict of interest. A broker’s expectation to be paid by the seller rather than their own client can make them partial to the seller, he said. DiMarco has always done buyer agreements for that reason, no matter what the seller might be offering.
“Now it’s going to be standard, and I think that will also help a lot of agents … who have been afraid to ask for them because you can always find agents that don’t require them,” DiMarco said.
In smaller markets like his, Realtors are often involved in commercial transactions, DiMarco said, adding the NAR lawsuit outcome will absolutely impact commercial brokers commissions, an argument he outlined in a LinkedIn blog post.
The lawsuit will also impact developers of residential condo towers, like those represented by Preston Patten, an Austin-based shareholder and attorney at Winstead law firm. If a buyer of a residence has a broker, they will likely have more upfront cautionary measures and paperwork, he said.
But for office, industrial, and other commercial asset classes, Patten said he doesn’t expect much change.
“It will be business as usual from my perspective,” he said.
One company that handles residential listings might be set to benefit from the lawsuit's fallout, however. CoStar’s stock price rose 8% on March 20, the same day that the settlement news broke.
CoStar’s Homes.com does not sell homebuyer leads to buyer’s agents, instead providing them free to the property’s listing agent, theoretically insulating it from effects on buyer agents that the new rules impose, according to YahooFinance. CoStar did not immediately respond to a request for comment.
Homes.com doesn’t monetize buyer agency and take a portion of agent’s commissions like its competitors do, CoStar said in an investor slide deck, according to YahooFinance.
“I do think CoStar is in a position as it stands, depending on how they play their cards, to get ahead of the game with this move,” DiMarco said.
But players in the commercial world at firms like JLL and CBRE are very sophisticated and specialized, so their processes will remain the same, Merchant said.
“In commercial, we’ve always done it differently anyway. The seller broker never had to upfront set the commission like they did in residential,” he said. “That was the whole lawsuit. They would have to set the commission up front and provide it through the MLS. We’ve never done that in commercial.”