Introduction
In 2025, the real estate world looks different. Warehouses are booming, retail is rebounding, and suburban office spaces are outshining their urban counterparts. These changes are creating new opportunities—and challenges—for investors. In this article, we’ll break down the trends shaping today’s real estate market and what they mean for your next move.
Section 1: Commercial Real Estate Is Not One-Size-Fits-All
Smaller Deals Are Shaping the Market
Even though the headlines focus on billion-dollar buildings, most real estate deals today are much smaller. In fact, over 80% are under $10 million. These deals, often led by families or small firms, have a major impact on local markets.
Industrial Growth Is Leading the Way
Warehouses and storage facilities are in high demand. In places like Québec, rents could increase by up to 12% in 2025. This demand comes from the ongoing rise in e-commerce and the need for better supply chains (Colliers Forecast).
A Tale of Two Office Markets
Office buildings show a big divide. Older offices in city centers are seeing vacancy rates near 30%. On the other hand, suburban offices built after 2010 have rates closer to 11%. This shows how age and location now matter more than ever.
“Suburban offices built after 2010 are averaging about 11% in vacancy, compared to almost 30% for older downtown spaces.”
Section 2: Rates, Tariffs, and Market Uncertainty
Interest Rates Shake Up Values
Since 2022, interest rates have jumped up and down. That makes it tough to figure out how much a property is really worth. Buyers want lower prices, and sellers want yesterday’s rates. As a result, deals are slowing down.
Timing Is Everything
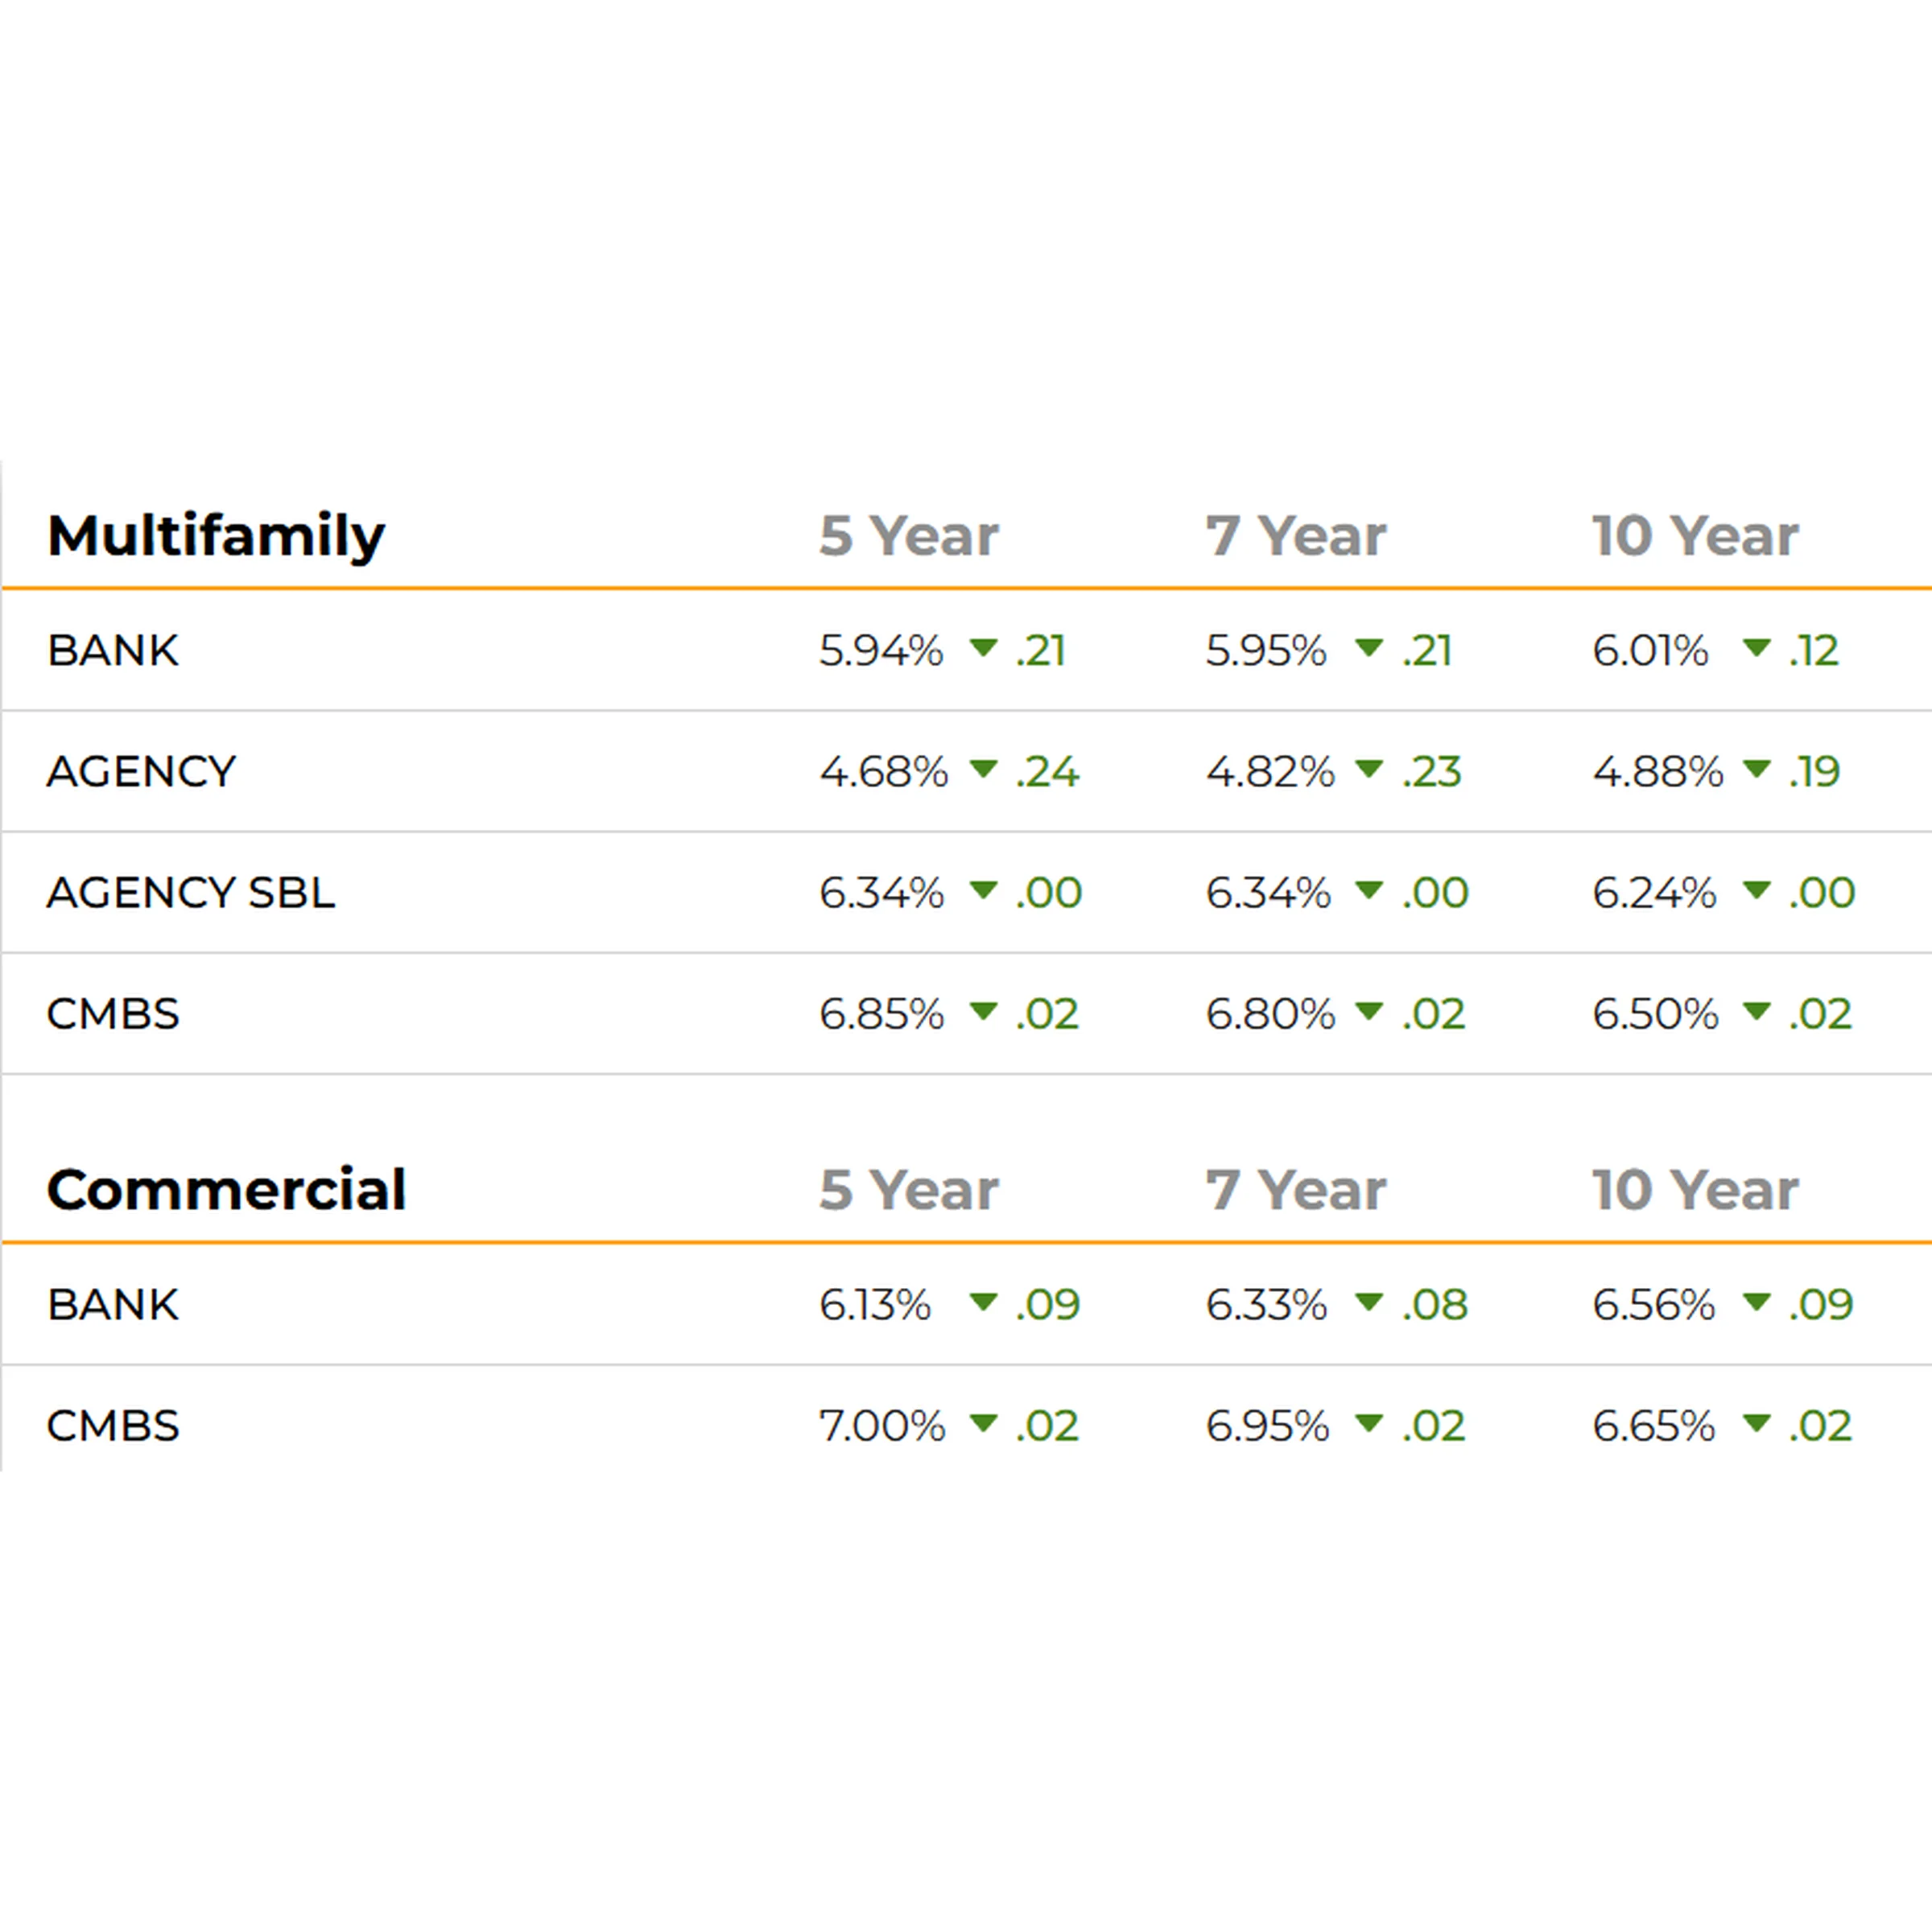
Even though there’s a pause now, lower mortgage rates are expected in 2025. That could make it easier to buy or sell. If you can wait out the current uncertainty, better conditions may be just around the corner.
Tariffs Add to the Pressure
Building costs are changing fast because of tariffs. Since these affect materials and labor, developers are putting projects on hold. That slowdown could keep supply tight in some markets, pushing up rents and values.
Section 3: Retail and Multifamily Stay Strong
The Retail Comeback Is Real
Retail is bouncing back—especially in local neighborhoods. Empty malls are being turned into gyms, health clinics, or delivery hubs. Since fewer new stores are opening, prime retail locations are seeing stable rents and low vacancies.
Renting Keeps Growing
Buying a home is tough right now. Prices are high, and interest rates are still a factor. Because of this, more people are choosing to rent. That’s good news for multifamily housing, which is seeing record demand in many cities.
Conclusion
The real estate market today is complex but full of opportunity. Smaller deals are becoming more common, and industrial spaces are seeing rapid growth. Offices are split between struggling downtown towers and thriving suburban buildings. Meanwhile, retail and rental housing continue to perform well.
Helpful Links
Learn more: CRE Investment Strategy Guide
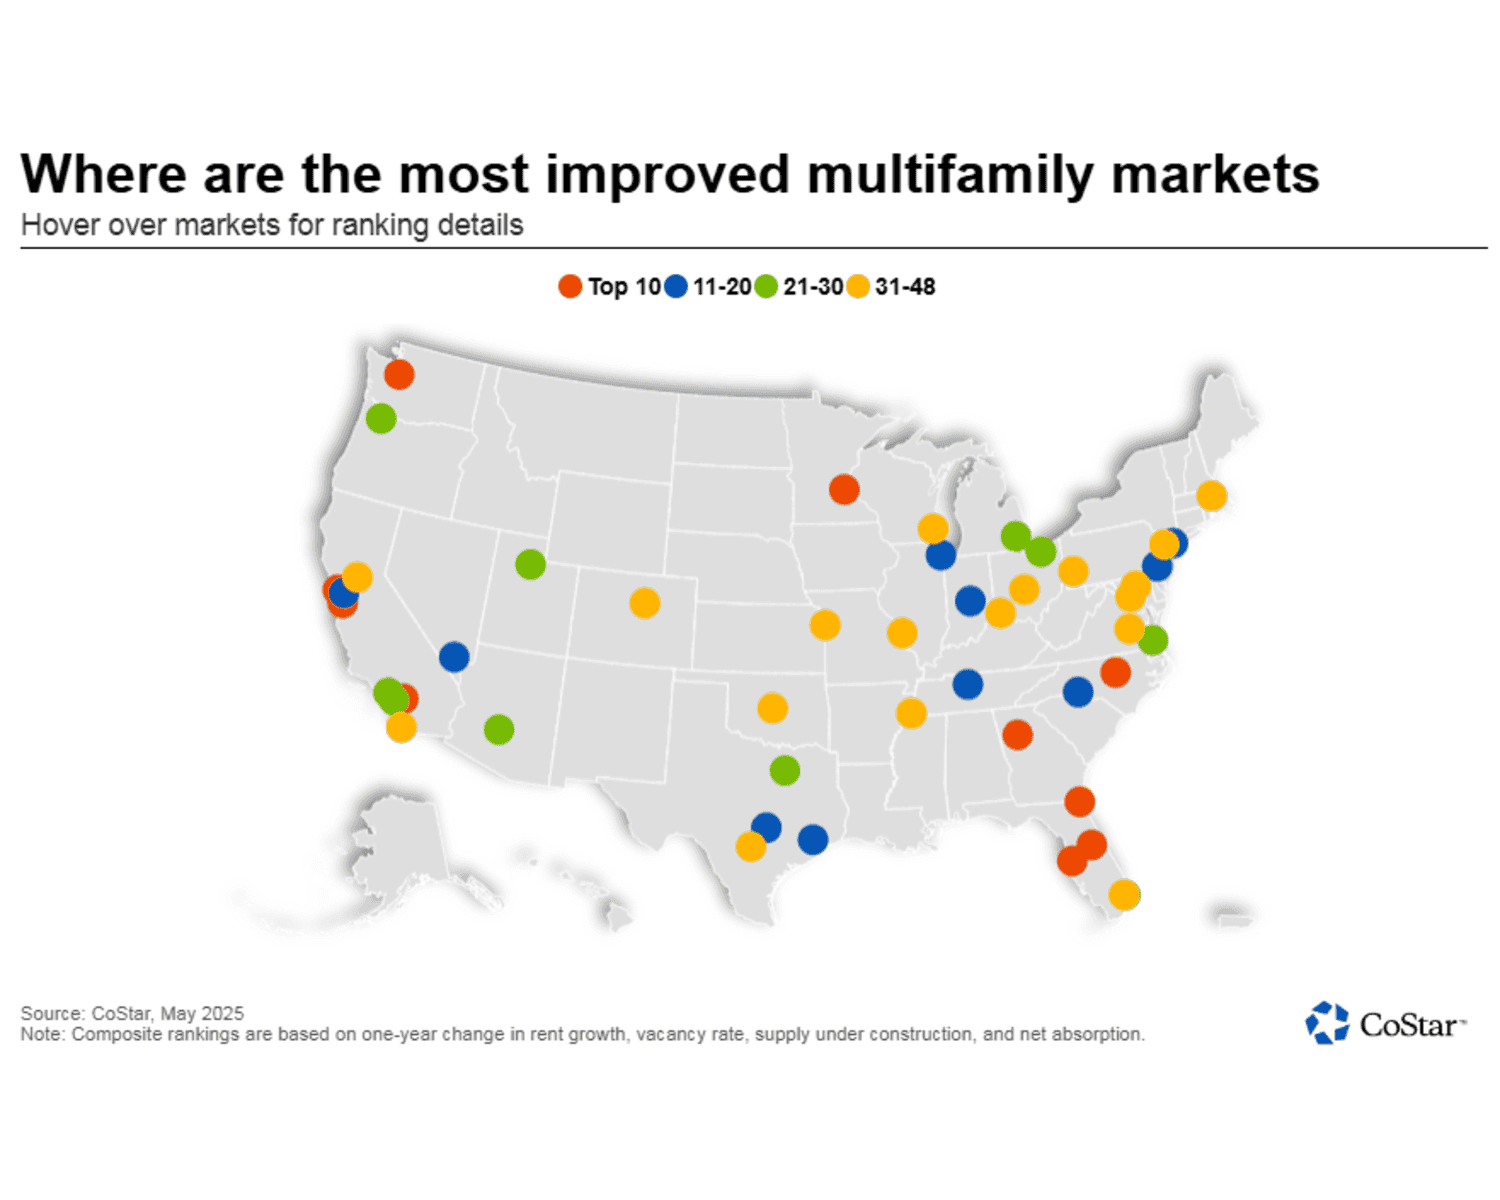
Read next: Multifamily Market Insights
Data: Colliers 2025 Industrial Report
Rate trends: Federal Reserve Monetary Policy
https://creconsult.net/commercial-real-estate-market-2025/?fsp_sid=1035