Tuesday, August 1, 2023

Types of Commercial Real Estate

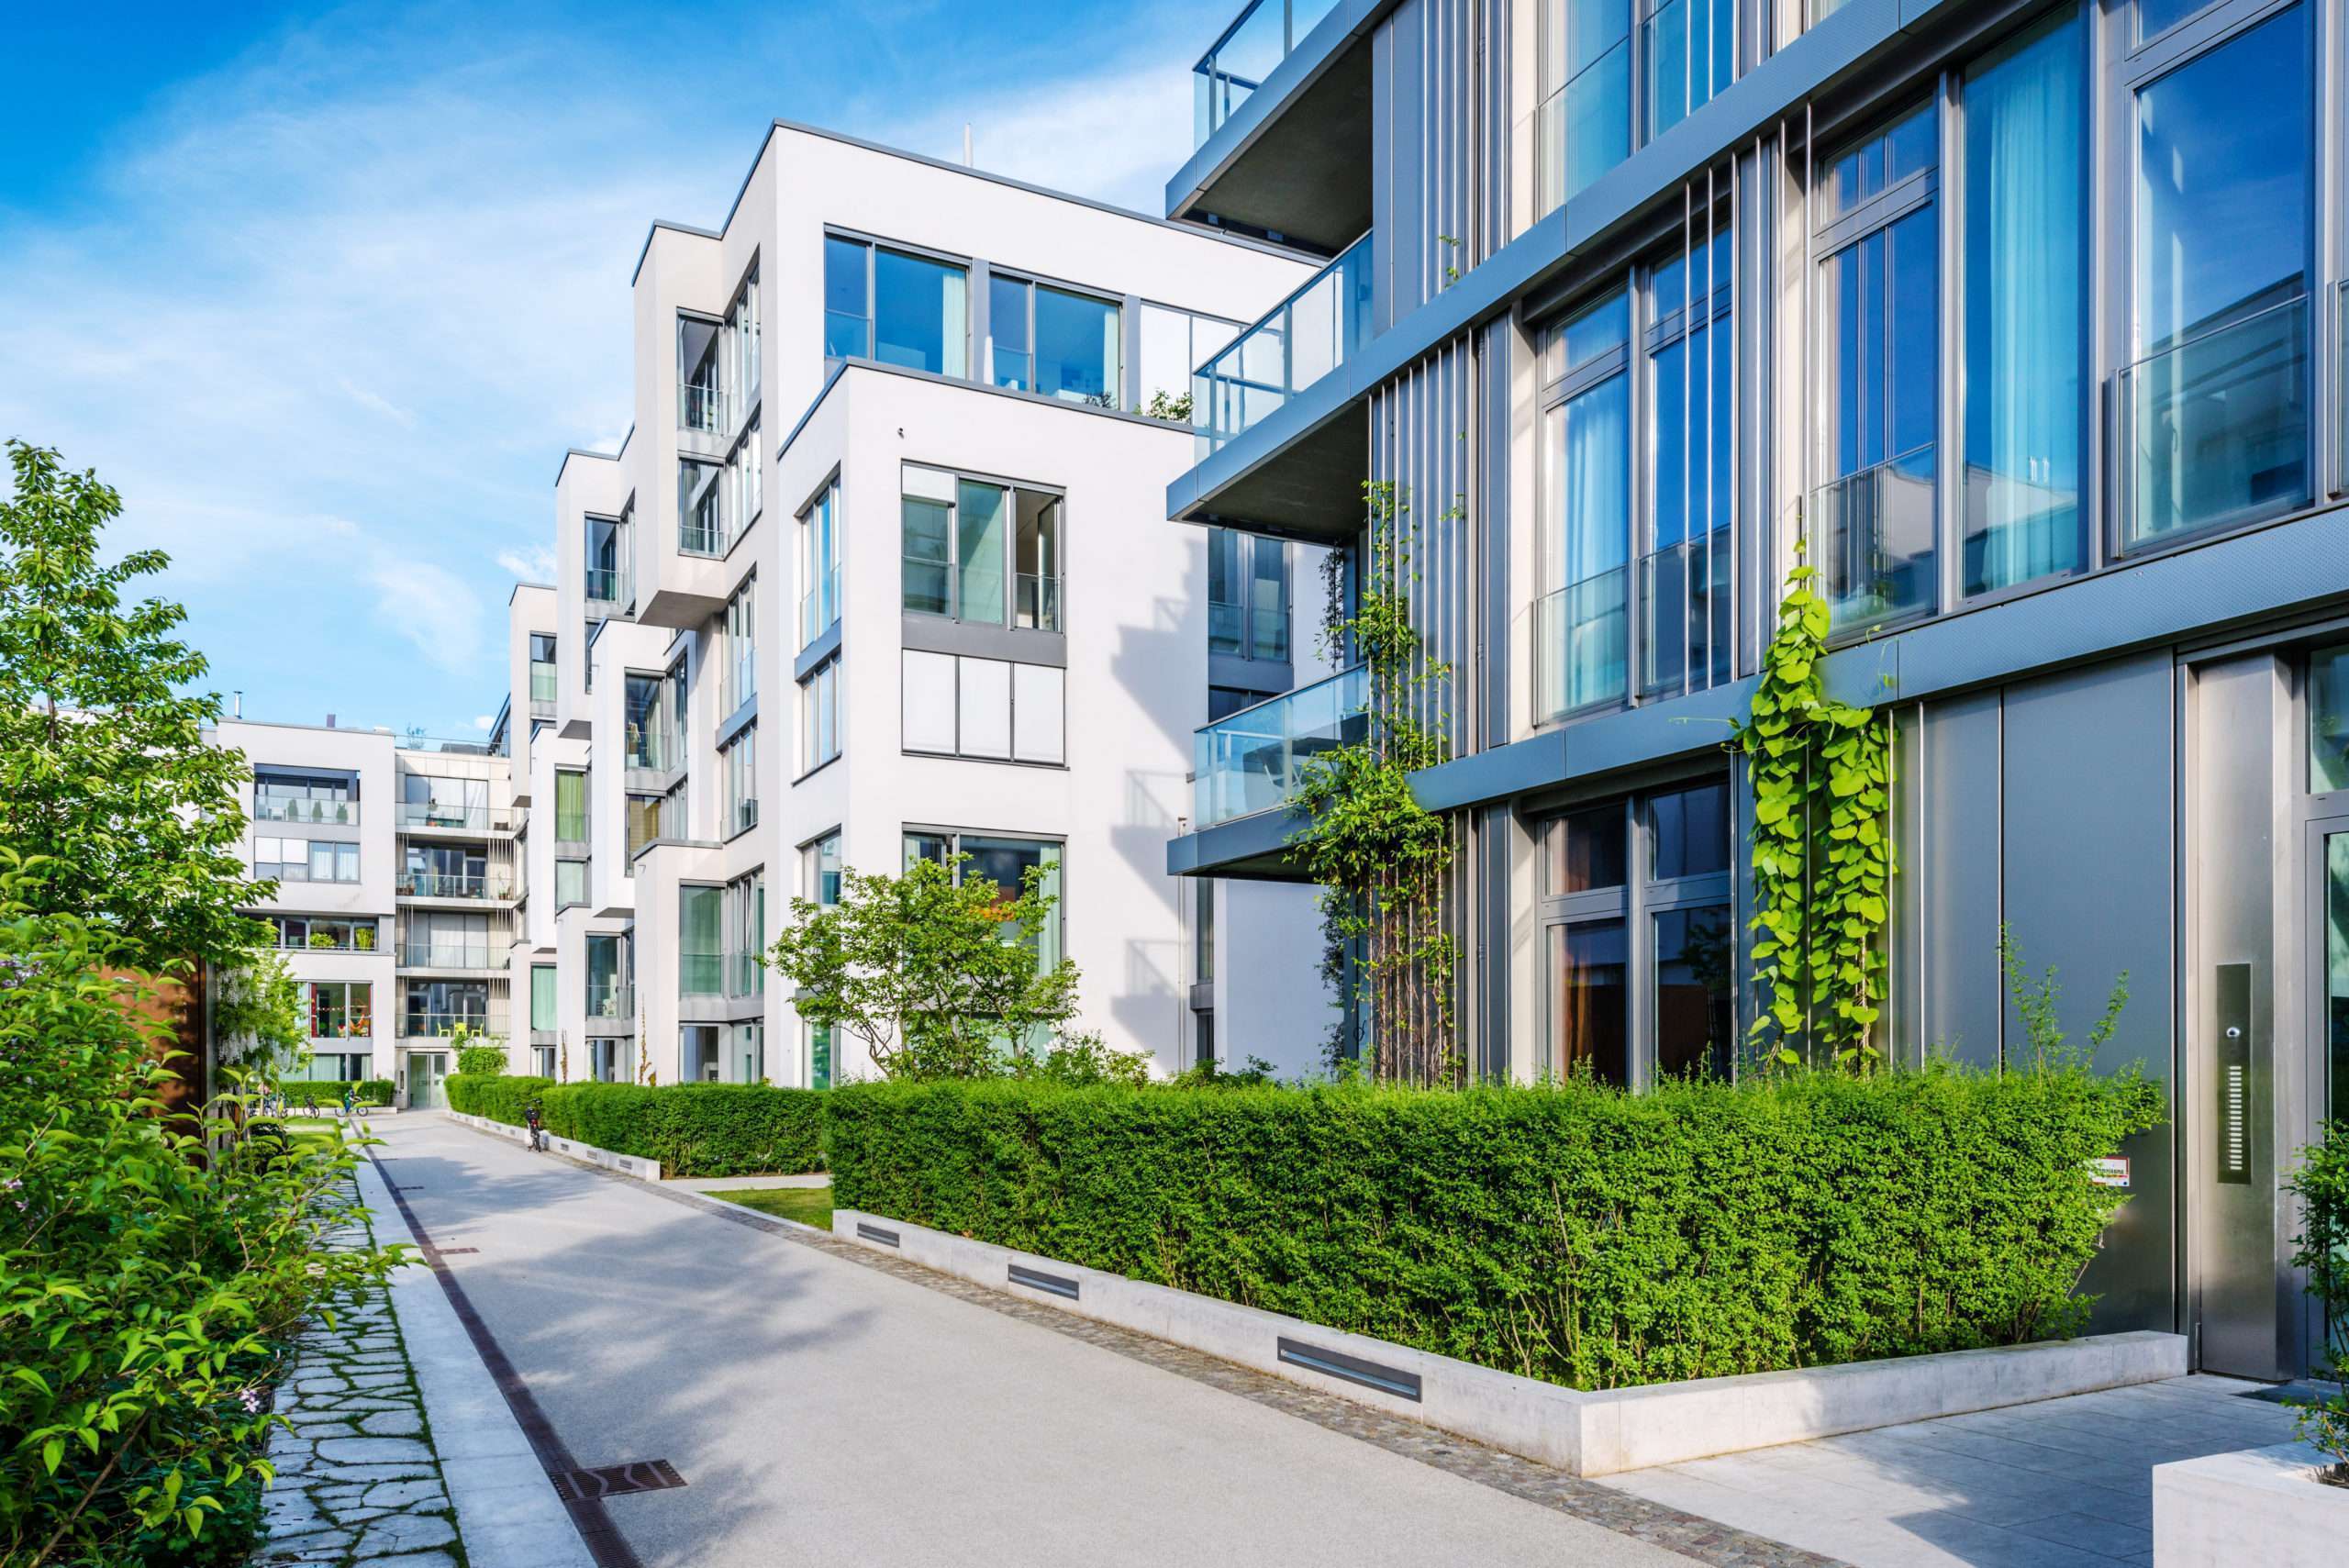
Commercial real estate can be broken down into several different categories. At a high level, when people think of different types of commercial real estate, they typically think about shopping centers, office buildings, or warehouses. But the commercial real estate industry is much more precise when it comes to defining property types. Below is a list of different types of commercial real estate with a description of how each category is typically defined.

Office

Classification. Office buildings are usually loosely grouped into one of three categories: Class A, Class B, or Class C. These classifications are all relative and largely depend on context. Class A buildings are considered the best of the best in terms of construction and location. Class B properties might have high quality construction, but with a less desirable location. And Class C is basically everything else.

Central Business District (CBD). Office buildings located in the central business district are in the heart of a city. In larger cities like Chicago or New York, and in some medium sized cities like Orlando or Jacksonville, these buildings would include highrises found in downtown areas.

Suburban office buildings. This classification of office space generally includes midrise structures of 80,000-400,000 square feet located outside of a city center. Cities will also often have suburban office parks which assemble several different midrise buildings into a campus-like setting.

Industrial

Heavy manufacturing. This category of industrial property is really a special use category that most large manufacturer’s would fall under. These types of properties are heavily customized with machinery for the end user, and usually require substantial renovation to re-purpose for another tenant.

Light Assembly. These structures are much simpler than the above heavy manufacturing properties, and usually can be easily reconfigured. Typical uses include storage, product assembly, and office space.

Flex warehouse. Flex space is industrial property that can be easily converted and normally includes a mix of both industrial and office space.

Bulk Warehouse. These properties are very large, normally in the range of 50,000-1,000,000 square feet. Often these properties are used for regional distribution of products and require easy access by trucks entering and exiting highway systems.

Retail

Strip Center. Strip centers are smaller retail properties that may or may not contain anchor tenants. An anchor tenant is simply a larger retail tenant which usually serves to draw customers into the property. Examples of anchor tenants are Wal-Mart, Publix, or Home Depot. Strip centers typical contain a mix of small retail stores like Chinese restaurants, dry cleaners, nail salons, etc.

Community Retail Center. Community retail centers are normally in the range of 150,000-350,000 square feet. Multiple anchors occupy community centers, such as grocery stores and drug stores. Additionally, it is common to find one or more restaurants located in a community retail center.

Power Center. A power center generally has several smaller, inline retail stores, but is distinguished by the presence of a few major box retailers, such as Wal-Mart, Lowes, Staples, Best Buy, etc. Each big box retailer usually occupies between 30,000-200,000 square feet, and these retail centers typically contain several out parcels.

Regional Mall. Malls range from 400,000-2,000,000 square feet and generally have a handful of anchor tenants such as department stores or big box retailers like Barnes & Noble or Best Buy.

Out parcel. Most larger retail centers contain one or more out parcels, which are parcels of land set aside for individual tenants such as fast-food restaurants or banks.

Multifamily

Garden Apartments. Suburban garden apartments started popping up in the 1960s and 1970s, as young people moved from urban centers to the suburbs. Garden apartments are typically 3-4 stories with 50-400 units, no elevators, and surface parking.

Midrise Apartments. These properties are usually 5-9 stories, with between 30-110 units, and elevator service. These are often constructed in urban infill locations.

Highrise Apartments Highrise apartments are found in larger markets, usually have 100+ units, and are professionally managed.

Hotels

Full service hotels. Full service hotels are usually located in central business districts or tourist areas, and include the big name flags like Four Seasons, Marriott, or Ritz Carlton.

Limited service hotels. Hotels in the limited service category are usually boutique properties. These hotels are smaller and don’t normally provide amenities such as room service, on-site restaurants, or convention space.

Extended stay hotels. These hotels have larger rooms, small kitchens, and are designed for people staying a week or more.

Land

Greenfield Land. Greenfield land refers to undeveloperd land such as a farm or pasture.

Infill Land. Infill land is located in a city has has usually already been developed, but is now vacant.

Brownfield Land. Brownfields are parcels of land previously used for industrial or commercial purposes, but are now available for re-use. These properties are generally environmentally impaired.

Special-Purpose

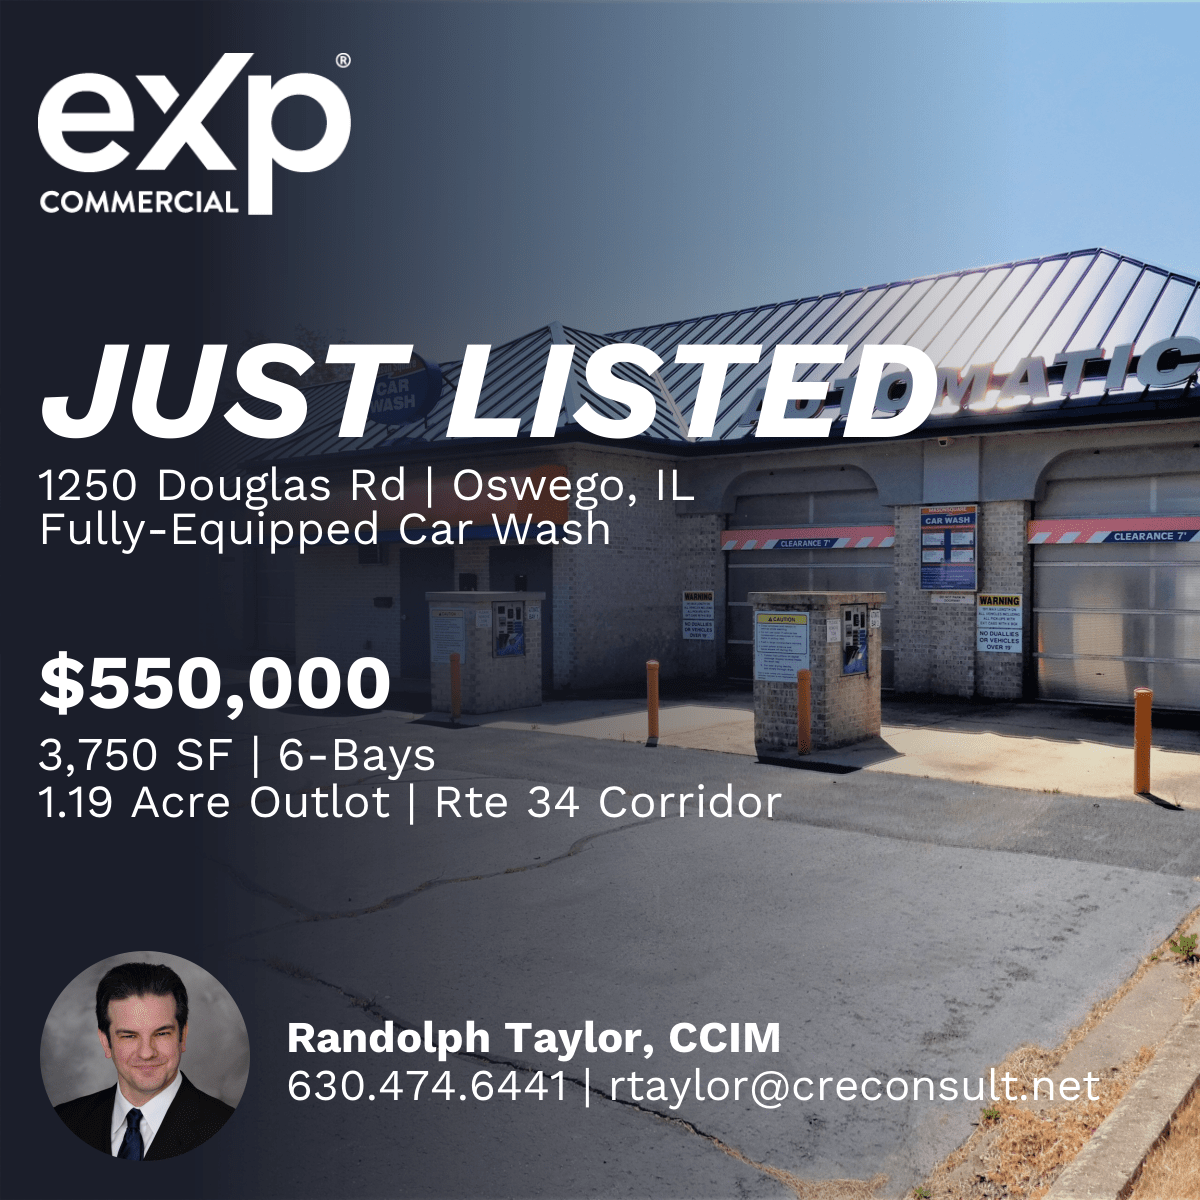
The above categories of real estate cover the major types of commercial real estate. However, there are plenty of other types of commercial real estate that investors construct and own. Examples of special purpose commercial real estate include self-storage, car washes, theme parks, bowling alleys, marinas, theaters, funeral homes, community centers, nursing homes, and churches.

Source: Types of Commercial Real Estate

https://www.creconsult.net/market-trends/types-of-commercial-real-estate/

Partners

eXp Commercial Partners provide our clients with the best-in-class services needed to complete a streamlined, cost-effective, successful commercial real estate transaction and assist you throughout the ownership cycle, including Capital Markets, 1031 Exchange Intermediary, Cost Segregation, Property Tax and Title Services
https://www.creconsult.net/partners/

Monday, July 31, 2023

Why Should I Sell My Multifamily Property?

Why should I Sell My Multifamily Property?

There are a number of reasons why people decide to sell their multifamily property, but most can be categorized into three groups: Problems, Opportunities, and Changes.

With this decision though comes the consideration of capital gains tax and how to ensure you are getting the most for the sale of your property.

There are several reasons why people do sell:

Problems:             

  • Management
  • Vacancy
  • Maintenance
  • Stress
  • Health
  • Debt
  • Neighborhood
  • Interest Rates

Opportunities: 

  • Strong Market Values
  • Alternate Investment
  • End of the Hold Period
  • Tax Savings

Changes:               

  • Divorce
  • Death
  • Retirement
  • Partnership Split
  • Relocation
  • Consolidation
  • Diversification

What do I do with the sales proceeds? I don't want to pay Capital Gains Tax!

There are several options for sellers to defer or minimize capital gains taxes:

  • 1031 Exchange
  • Delaware Statutory Trust/Deferred Sales Trust  (DST)
  • Tenancy in Common Investment (TIC)
  • Installment Sale

How do I know I am getting the most money for my property?

We not only market properties for sale. We make a market for properties we represent. Each offering is thoroughly underwritten, aggressively priced, and accompanied by loan quotes to expedite the sales process. We leverage our broad national marketing platform syndicating to the top CRE Listing Sites with direct outreach to our investor database and an orchestrated competitive bidding process that yields higher sales prices. 

What is my property worth?

Contact Us to discuss what information is needed to complete a Complimentary Commercial Broker Opinion of Value (BOV). 

I’m not interested in selling at this time.

This is understandable as only about 5% of the market trades in any given year. We are also happy discuss any purchase or refinance interests and recommend some physical and operational changes you can make to add value to your property you will appreciate when you eventually sell.  


Have you thought of selling your property and would like to know what it's worth? Request a valuation for your property below:

Request Valuation

eXp Commercial Chicago Multifamily Brokerage focuses on listing and selling multifamily properties throughout the Chicago Area and Suburbs.

We don’t just market properties; we make a market for each property we represent. Each offering is thoroughly underwritten, aggressively priced, and accompanied by loan quotes to expedite the sales process. We leverage our broad national marketing platform syndicating to the top CRE Listing Sites for maximum exposure combined with an orchestrated competitive bidding process that yields higher sales prices for your property.


https://www.creconsult.net/market-trends/why-should-i-sell-my-multifamily-property/

Good Time for Investors to Unload


Real estate investors have done well. Rents have risen and home price appreciation has been quite exceptional. In the past three years, the typical rental rate and typical home price have soared by 16.4% and 35.5%, respectively. Over the past five years, those figures are 24.9% and 50.8%. These returns were occurring at a time of low-cost financing.

Now it’s time for investors to sell. Home prices have already retreated in some markets—especially in the west, where the median price is 8% lower than a year ago.

There are 44 million renter households: Half live in midsized to large apartment buildings, while the other half rent single-family, duplex, triplex or quadplex units. Although apartments are not necessarily as competitive as single-family rental units, a 40-year high in multifamily construction means many units will be hitting the market in the upcoming months and into next year. Rent growth has already turned the corner from acceleration to deceleration, still rising in most markets but at a slower pace. Looking at single-family construction, builders are still underproducing compared to the historical average, but new-home sales are back to pre-COVID levels. Home builders are making profits, stock prices for publicly listed construction companies have risen by around 50% in the past year, and inventory of new homes is plentiful.

That’s not the case for existing homes. The latest inventory of 1 million is a historic low, and that’s hindering existing-home sales. Multiple offers are still happening on mid-priced homes. We need 50% growth in listings to reach pre-pandemic 2019 levels. We need 100% growth to reach an adequate supply. This is where investors come in—or rather, come out. The National Association of REALTORS® is calling for a federal incentive to help bring needed inventory to the market: temporary capital gains relief for investors who sell to a first-time buyer or first-generation buyer.

Source: Good Time for Investors to Unload

https://www.creconsult.net/market-trends/good-time-for-investors-to-unload/

Sunday, July 30, 2023

Mason Square

Fully Equipped Car Wash For Sale
1250 Douglas Rd. | Oswego, IL | 3,750 SF | 6 Bays | 1.19 Acres
Mason Square Car Wash, a fully equipped and operational 6-bay carwash in southwest suburban Chicago’s Oswego, IL. Ideally located on an out-lot of the Mason Square Shopping Center along heavily trafficked Route 34, averaging 45,000 vehicles per day,
Listing Agent: Randolph Taylor 630.474.6441 | rtaylor@creconsult.net
https://www.creconsult.net/fully-equipped-car-wash-oswego-il-route-34/

Capital Expense vs. Operating Expense in Real Estate

Running a commercial real estate asset on a day-to-day basis can be expensive. As such, it is important for operators to manage costs relative to rental income to ensure that the given property is profitable. From a management standpoint, costs can be grouped into two buckets: Operating Expenses (or “OpEx”) and Capital Expenses (or “CapEx”). While they are both categories of expenses, there are material differences between capital expenses and operating expenses.

In this article, we define capital expenses and operating expenses and explain the difference between CapEx and OpEx in real estate.

What Are Capital Expenses?

Capital expenses in real estate are large costs that are incurred outside of the normal day-to-day operations of the property. In many cases, CapEx includes things like:

  • Big ticket repairs like HVAC or roof replacement
  • Major renovations like facade replacement
  • New carpet, paint, and/or drywall
  • Parking lot repaving
  • Elevator repairs

Capital expenditures and the assets that are purchased with them are recorded on the property’s balance sheet. For example, replacing a commercial grade HVAC system is incredibly expensive. The cost is recorded as a line item on the income statement, but the value of the fixed asset is recorded on the balance sheet.

Because capital expenses are infrequent, their cost can occasionally catch the property owner by surprise. For example, a major storm can cause significant water damage, and the cost to repair it may not have been anticipated within the budgeted.

To avoid any major impact to operational cash flow, it is important that property owners set aside operational funds at regular intervals as part of the capital budgeting process for each accounting period. This way, capital expenses can be paid for from a separate “bucket” of funds without creating “lumpiness” in Net Operating Income.

What Are Operating Expenses?

The easiest way to think about Operating Expenses is as the day-to-day costs associated with running the property. For a commercial real estate asset, operating expenditures include things like:

  • Property taxes
  • Property insurance
  • Repairs and Maintenance
  • Administrative Expenses
  • Utilities
  • Depreciation Expense
  • Property Management

Each of these expenses is listed as a separate line item on the property’s income statement. A property’s Gross Income less its Operational Expenses results in a metric called Net Operating Income or “NOI,” which is a primary driver of a property’s value.

Capital Expenses vs. Operating Expenses: Key Differences

From an accounting standpoint, there are important differences between operational expenditures and capital expenditures.

OpEx are expenses that are short-term in nature, and they are used up in the accounting period in which they are purchased. In many cases, this means that they are used up monthly, quarterly, or annually. For example, property taxes are an operational expense and they cover a period of one year.

CapEx are longer term investments. They are expenses that are incurred with the intent to earn a return on the cost. For accounting purposes, the cost is spread out over several years of the asset’s useful life. For example, it may cost $100,000 to install a new roof on a property. The entire cost is incurred up front, but an accounting concept known as “depreciation” allows it to be spread out over the life of the asset with a little bit of the cost incurred each year.

Capital Expenses & Value-Add Investment Strategy

At First National Realty Partners, we are value-add investors. This means that we intentionally seek out properties that need a little bit of work. If we can acquire them at a price that is below its replacement value, we will invest a certain amount of capital (capital expenses) to improve the property’s condition. With an upgraded property, we are able to leverage our extensive tenant relationships to lease space at higher rates than would have been possible without the renovations.

There is a specific relationship between the amount of the initial capital investment and the amount of rent that the market will support. As a result, we invest a significant amount of time and resources to understand what level of rents the market will bear and use those as a guide for informing the amount of CapEx that we are willing to deploy.

Non-Real Estate Uses for CapEx and OpEx

While the bulk of this article discusses how capital expenses and operating expenses are used in a real estate context, they are also used in regular business operations. Consider the case of a company that manufactures shoes.

Operational Expenses are the normal day-to-day business expenses that are needed to fund the company. These would include things like salaries, insurance, raw materials, and other items that make up the cost of goods sold.

Capital Expenses would be associated with longer term assets, the purchase of which will provide some level of future benefit. For example, the company could purchase a new piece of machinery that would allow them to manufacture more shoes in the same period of time. The cost of the asset is recorded up front, but IRS rules allow the company to “depreciate” the value over the estimated useful life of the machinery. For tax purposes, the amount of depreciation can be taken as a tax deduction in the sense that it reduces net operating income and the company’s overall tax burden.


Source: Capital Expense vs. Operating Expense in Real Estate

https://www.creconsult.net/market-trends/capital-expense-vs-operating-expense-in-real-estate/

Saturday, July 29, 2023

Multifamily Dealmakers Report More Activity

A number of market participants agree that multifamily sales activity is on the upswing despite the current low transaction numbers.

As the Federal Reserve nears the end of its tightening cycle, a small but growing share of National Multifamily Housing Council survey respondents are starting to report a pickup in apartment deal flow.

That is the one positive from NMHC’s Quarterly Survey of Apartment Market Conditions for July 2023. But it is reflected by a group of dealmakers in the space that were surveyed by GlobeSt.com.

Survey Results

Otherwise, survey results in all metrics were below the breakeven level (50), extending lengthy consecutive monthly results in that direction.

Market tightness was 26, sales volume 40, equity financing 22, and debt financing 18.

“Both debt and equity capital continue to pull back from the apartment market amidst an environment of rising interest rates and slowing rent growth,” NMHC’s Vice President of Research, Caitlin Sugrue Walter said.

As a result, transaction volume fell for the fifth consecutive quarter, with current apartment owners unwilling to offer the lower prices buyers deem necessary to compensate for this diminished economic outlook, Sugrue Walter said.

The Market Tightness Index indicated looser market conditions for the fourth consecutive quarter. More than half of respondents (57%) reported markets to be looser than three months ago, while only 9% thought markets have become tighter.

About one-third said that they thought market conditions were unchanged over the past three months.

The Sales Volume Index reading of 40 marked the fifth consecutive quarter of decreasing deal flow, albeit with considerably less consensus among respondents than in preceding quarters.

Just over one-third reported lower sales volume, down from 56% of respondents who reported lower sales volume in April and 82% of respondents in January.

Meanwhile, 14% of respondents in July thought that volume was higher than three months ago, while nearly half of respondents (47%) reported no change in volume.

The Equity Financing Index showed considerably lower than the breakeven level (50). It was the sixth consecutive quarter in which equity financing became less available.

Fifty-seven percent of respondents reported equity financing to be less available than three months ago, while 40% of respondents believed availability to be unchanged. No respondents reported an increase in the availability of equity financing.

The Debt Financing Index reading of 18 indicated the eighth consecutive quarter in which debt financing became less available. Two-thirds of respondents reported that conditions have worsened for debt financing, 26% thought that conditions were unchanged, while just 3% reported that now is a better time to borrow than three months ago.

More Activity is Being Reported

Outside of the NMHC survey, apartment professionals say they are seeing some deals.

Roberto Casas, co-lead of the multi-housing group with JLL Capital Markets, tells GlobeSt.com that deal activity is picking up compared to the first half of the year as asset valuation activity increases due to loan maturities and fund level redemptions.

“There remains a dearth of available product in the market, leading to amplified buyer activity in the multihousing sector, and today, private buyers are proving to be the most active,” Casas said. “Additionally, we continue to see capital pivot to the multi-housing sector and new entrants to the market.”

Kevin Crook, Investors Management Group Director of Acquisitions & Dispositions, tells GlobeSt.com, that the recent uptick in activity is a positive sign. “I’d compare the transaction market this year to a middle school dance, with everyone hesitant to engage. If feels like buyers and sellers are finally moving to the center, ready to negotiate deals again.

“These periods of disconnect have delivered some of our best buying opportunities. We’ve negotiated price discounts, moved forward on the strength of the fundamentals, and capitalized on a great basis as the market recovered. We’re looking to duplicate that kind of success again in the coming months of the market correction.”

Scott Larson, Managing Principal of Pangea Mortgage Capital, tells GlobeSt.com he expects that the modest increase in overall multifamily transaction volume he is seeing will continue in the fourth quarter “as some transactions can only be extended for so long. We have seen a decrease in volume in the Southeast, but this is offset but increased volumes in the Midwest and West.”

Henry Manoucheri, CEO of Universe Holdings, tells GlobeSt.com that this is a great time to buy since there is limited availability and no competition like before.

“Even though Universe Holdings has remained active since the Fed started raising interest rates last year, we have recently noticed a modest uptick in deal flow and competition,” he said.

“The property fundamentals remain strong and as rates increase at a slower rate, people can buy homes. They will be forced to rent putting increasing pressure on rising rents. However, in the coming months, the larger institutions who have been on the sidelines will need to become more active since they will need to deploy all the capital (dry powder) prior to year’s end.”

‘Second Half Will be Explosive’ Narrative Revised

Jay Remillard, Managing Director at CP Capital US, tells GlobeSt.com, “A lot of people I’ve spoken with recently are actively buying and selling, though not yet to the levels they had hoped to hit by this point in the year. Outliers are core funds, who are still largely on the sidelines.”

Remillard said the “second half of 2023 will be explosive” narrative has been revised due to the Fed not yet officially slamming the brakes on rate hikes, but hopefully it will soon.

“The fourth quarter could see a wave of deals trying to get done before year-end, but most people aren’t expecting a healthy, ‘fully functioning’ market until next year.”

Brennen Degner, Managing Partner and CEO, DB Capital Management, tells GlobeSt.com he is starting to see sellers test the market with more realistic pricing.

“While there is still a significant bid/ask spread, it does seem to be narrowing a bit which bodes well for both the immediate and long-term future,” Degner said.

“As a result, we believe the pipeline for deals will continue to open over the next 12 months. We are already seeing more opportunities in Denver, Phoenix, and Las Vegas, which had all but shut over the past months.”

Peter Margolin, Commercial Loan Originator at Alliant Credit Union, tells GlobeSt.com that he is seeing a “fair amount” of multifamily transactions.

“Within multifamily more broadly, we are also seeing a decent amount of student housing opportunities,” Margolin said.

Littell added that while multifamily transaction activity has been on a clear downward trend, it is expected to level off over the coming quarters and not materially improve across all markets until there is more certainty around pricing.

CoStar: YoY Transaction Volume Down 58%

This uptick in activity, though, is climbing up from a deep trough.

Chad Littell, national director of US capital markets analytics at CoStar Group, tells GlobeSt.com that nationwide, year-over-year transaction activity is down 58% during the 12 months that ended in June 2023.

“The markets experiencing the largest decelerations in rent growth have taken the bulk of these transaction declines,” Littell said. “In contrast, markets with relative strength in maintaining rent growth and moderate supply deliveries have seen more stable transaction activity.”

By way of illustration, Littell said cities throughout the West, Sun Belt, and Southeast that were enjoying between 15% and 30% year-over-year rent growth 18 months ago have decelerated to just a few percent and, in many cases, are now showing negative annualized rent growth.

“As a result, the number of transactions in Atlanta, Austin, Dallas, Phoenix, Las Vegas, Miami, Nashville, and Tampa is down between 30% and 70% compared to the 12 months ending in the second quarter of 2022,” he said.

“The total consideration that changed hands during this period is no better. In most of these markets, sales activity is down between 50% and 80% compared to the 12 months ending in the second quarter of 2022. Seeing dollar volumes decline more sharply than transaction counts tell us that the average transaction size is also falling as large players take a more cautious approach.

Littell said markets faring better are generally secondary and tertiary markets, with Chicago being the notable primary market exception.

“Its transaction counts are up despite a 24% decline in dollar volume,” Littell said. “Its commonality shared with other relative winners may result from its Midwest location.”

Other notable secondary markets showing relative strength in activity, according to CoStar, include Canton, OH; Green Bay, WI; Fort Collins, CO; New Haven, CT; and Springfield, IL, all showing increased transaction counts and higher total dollar volumes trading hands than a year ago.


Source: Multifamily Dealmakers Report More Activity

https://www.creconsult.net/market-trends/multifamily-dealmakers-report-more-activity/

Price Reduction – 1270 McConnell Rd, Woodstock, IL Now $1,150,000 (Reduced from $1,200,000) This fully occupied 16,000 SF industrial propert...