Sunday, September 10, 2023

Midwest spotlight: A look at multifamily performance

The multifamily market saw record-breaking rent growth that was backed by high demand in 2022, but that is no longer the case for several regions in 2023. While the volatility in the current market has taken its toll on the sector’s high-paced expansion, not every region in the U.S. is experiencing setbacks. In fact, the Midwest has recently emerged as a thriving area for multifamily investment.

The Midwest offers several advantages compared to other U.S. regions, including its diverse economy, growing population, and stable housing market. All of which makes the region an excellent place for investors looking to expand their portfolios.

Why Invest in the Midwest?

The level of transaction activity in the multifamily market can be influenced by factors such as population growth, government regulations, property taxes, income levels, supply trends, real estate regulations, and more. In the past, larger metros like Chicago and Minneapolis attracted more capital to the Midwest because they offered high levels of the listed market drivers. However, recently, secondary markets have become popular as well, indicating that there is a strong demand for multifamily properties that are well-located.

The region has experienced steady economic growth and low unemployment rates, which provide a stable market for commercial real estate services. The cost of living and doing business is lower in the Midwest than in other parts of the country, leading to lower property prices and higher rental yields.

Additionally, developers are finding it easier to acquire land in the Midwest’s secondary markets and receive the necessary permits to build in a timely manner due to lower barriers to entry compared to other regions.

The region’s transportation infrastructure, including highways, airports, and railways, makes the Midwest a strategic location for businesses and residents. Finally, the region’s diverse economy, with a mix of manufacturing, agriculture, and healthcare industries, ensures a stable demand for commercial real estate.

The Midwest’s growing population, with approximately 68 million residents, creates strong rental housing demand. The median household income for the Midwest was $66,143, according to the 2021 Census Report. The demand for rentals is further boosted by the fact that many people prefer renting to owning due to financial or lifestyle reasons. In fact, homeownership has declined nationwide, with 36 percent of American households now renting instead of owning.

The Midwest generally has more tax-friendly regulations for investors, making the region more attractive. South Dakota is income tax-free, while other Midwest states boast some of the lowest state income tax rates, such as Indiana at 3.16 percent and Michigan at 4.25 percent. Capital gains taxes are also lower in the Midwest compared to coastal markets. North Dakota, with a capital gains rate of 2.90 percent compared to California’s 13.30 percent, is one Midwest state worth highlighting.

Key Midwest Players

Multifamily real estate has been booming in the Midwest in recent years, with several states experiencing strong growth in the rental property market. Chicago has been the epicenter of multifamily investment in Illinois and is currently one of the leading markets for new deliveries. Smaller cities such as Rockford and Aurora have begun providing more affordable rental options. Ohio has seen investment in the cities of Cleveland and Columbus, focusing on redeveloping historic buildings. Columbus, in particular, experienced substantial growth with an expanding downtown to attract young professionals to the area.

In Minnesota, the Twin Cities of Minneapolis and St. Paul have been a hotbed of multifamily investment, with a high demand for rental properties and substantial capital investment. Meanwhile, in Missouri, St. Louis has experienced significant investment in the downtown area and surrounding neighborhoods due to the revitalization brought by the growing tech industry and talent pool. On the other hand, Kansas City has been focusing on suburban construction.

Overall, the Midwest has experienced substantial growth in the multifamily real estate market, driven by a growing population, a robust economy, and a focus on urban revitalization. With a mix of large and small cities experiencing significant development, the region offers a range of opportunities for investors and renters alike.

Illinois – Chicago, Rockford, and Peoria

From Q1 2022 to Q1 2023, around 5,600 units were absorbed in Chicago, which exceeds the average annual net absorption of 4,100 units for the market. Strong demand has led to a decrease in vacancies, further contributing to rent growth in the market. Year-over-year rent gains posted a 4.1 percent increase. The area experienced $5 billion in annual sales volume with an average cap rate of 5.7 percent from Q1 2022 to Q1 2023. Chicago’s two largest submarkets, Downtown and North Lakefront, experienced a high percentage of sales from Q1 2022 to Q1 2023.

In Q1 2023, apartment rents in the Rockford market increased by an annual rate of 5.3 percent. There are 33 units under construction in Rockford, the largest under-construction pipeline in over three years. As of Q1 2023, vacancies in the metro area were slightly below the 10-year average but have remained relatively stable from Q1 2022 to Q4 2022; currently, the vacancy rate is 3.5 percent.

Apartment rents in the Peoria market increased by an annual rate of 9.2 percent in Q1 2023. The current market cap rate decreased since last year to seven percent. This is the lowest rate observed in Peoria in the previous five years, although the city’s cap rate is typically higher than in other regions. The area has had an annual sales volume of $118 million within the last 12 months. Within the past three years, 390 units have been delivered, a cumulative inventory expansion of 3.4 percent, and 160 units are currently under construction.

Ohio – Cleveland and Columbus

The Cleveland market experienced its most active year for deliveries since 2015, adding over 2,000 units in 2022. From Q1 2022 to Q1 2023, total multifamily sales in Cleveland amounted to $159 million, approximately 16 percent higher than the annual average, with a market cap rate of 7.5 percent. The average monthly asking rent in Cleveland is $1,100 per unit, making it a cost-effective market for renters.

From Q1 2022 to Q1 2023, multifamily sales in Columbus amounted to $2.0 billion, which is almost twice the prior three-year average. The majority of development and delivery activity within the submarket occurs in neighborhoods that are adjacent to downtown Columbus and surrounding Ohio State University, playing a significant role in contributing to the submarket’s strong overall performance. In the second half of 2022, quarterly volume reached record levels, with more than $650 million worth of transactions occurring in the third and fourth quarters combined. The market’s affordability and potential for higher yields likely contribute to the substantial sales volume in recent months. ¬¬¬

Minnesota – Minneapolis, Rochester, St. Cloud

Minneapolis achieved an all-time high in annual net deliveries for the fifth consecutive year, with 11,000 units added in 2022. This number is approximately 15 percent higher than the previous record set in 2021. In 2022, the annual sales volume in Minneapolis reached the second-highest level on record, totaling $2.1 billion. Minneapolis’ multifamily investment market has remained strong and durable, thanks to investments made by all types of buyers, including private and institutional capital. These investors are focusing on areas with lower volatility and higher yields that are less vulnerable to the potential impact of rising interest rates and a potential recession in 2023.

In Q1 2023, apartment rental rates in the Rochester market increased at an annual rate of 2.4 percent, and over the past three years, they have increased by an average annual rate of 3.6 percent. There are 940 units under construction, the highest under-construction pipeline in more than three years.

The St. Cloud rental market saw a 3.3 percent rise in apartment rents in Q1 2023, with an average yearly increase of 3.8 percent in the past three years. Home to a state university, the area experienced a 12 month sales volume of $92 million and a market cap rate of 6.7 percent. Additionally, there are currently 210 units being constructed in addition to the 670 units completed in the past three years.

Missouri – St. Louis, Kansas City, Springfield

Over the past year, the St. Louis area has delivered 3,700 units, significantly higher than the annual average of 2,300 units over the past five years. The price per unit is $140,000, representing a 48 percent rise in the past five years. The region’s multifamily market is still considered affordable, with rental rates 30 percent lower than the national average, at $1,140 per month.

The number of units in the Kansas City construction pipeline is 7,900, which accounts for 4.6 percent of the total inventory, one of the highest levels in the Midwest. The 12-month total sales volume is $1.1 billion, with more than half contributed by the sale of Class A properties.

Springfield’s population has increased by 19,000 individuals in the last five years, representing a four percent growth rate. During this time, the number of households in Springfield has grown by 9.7 percent. The yearly sales volume has averaged $49.0 million in the past five years, with a peak investment volume of $160 million during that period. From Q1 2022 to Q1 2023, $1.9 million of multifamily assets have been sold.

Takeaways

Overall, investing in multifamily properties in the Midwest can be a good option for those looking for a stable, income-producing investment with the potential for long-term growth. Many units are currently underway throughout the region, posing additional opportunities for years to come. As more investors move to this area to take advantage of the low cost of living, high demand, and steady economic growth, the region is set to thrive. Multifamily remains resilient despite economic volatility, and Midwest markets are excellent examples of adaptability in times of high-interest rates and slowing rent growth.


Source: Midwest spotlight: A look at multifamily performance

https://www.creconsult.net/market-trends/midwest-spotlight-a-look-at-multifamily-performance/

Saturday, September 9, 2023

The Dangers of Selling Commercial Property Too Late

The Dangers of Selling Commercial Property Too Late

The last downturn

cost those who chose to sell commercial property an average of

30.3% of their property value


Reason #1

Why people sell commercial property too late:

Complacency


Complacency is the most dangerous state to ignore.

It’s the moment before the market corrects and values decline. When the market goes through this initial correction, our natural tendency is to be complacent because initial corrections actually look like a cool-off period.

Then we expect the market to pick up again and continue with its growth phase.

But, the market continues to deteriorate and worries creep in as we wonder what is going on. Next, it is normal to say to yourself that your investments are good ones that they’ll ultimately come back.

When the market continues to soften until it seems there is no hope in coming back, that’s the absolute bottom of the market and the worst time to sell.


This point of capitulation is one of surrender and of asking how the government could let something like this happen.


Reason #2

Why people sell commercial property too late:

Ownership and Identity


In order to avoid loss, people will overvalue what they own.

That is what Richard Taylor, Daniel Kahneman, and Jack L. Knetsch identified with the Endowment Effect. In fact, Kahneman and Knetsch won the Nobel Peace Prize for their research in this area of behavioral economics.


It’s normal for people to overvalue what they own.


In a study with Cornell undergrads, broken into groups and given identical coffee cups, Kahneman and Knetsch told one group to value the cups they owned and the other group to value the cups they would purchase.

They found the undergrads with the coffee cups were unwilling to sell their coffee cups for less than $5.25 while their less fortunate peers were unwilling to pay more than $2.25 to $2.75.

But, it was Carey Morewedge’s research into the Endowment Effect that revealed that it’s not loss aversion that leads to overvaluation, it’s ownership and identity.

Morewedge found that it’s our sense of possession that creates the feeling of an object being mine, which then becomes a part of our identity.


Reason #3

Why people sell commercial property too late:

Loss Aversion


Why is it so difficult to sell commercial property in a market decline?

According to Brafman and Brafman, authors of Sway: The Irresistible Pull of Irrational Behavior people will go to great lengths to avoid perceived losses.

What’s more, people also succumb to their will to recover what once was.  They will spend whatever it takes not to lose, be it time, money, or emotional resources.

Imagine watching someone playing craps in Las Vegas. When they are on a roll, taking in their winnings, they race through the growth phase, reaching the peak of the game.

They feel ecstatic.

But what happens when the tide turns and they start to lose?

They enter the complacency stage, call it a short turn of bad luck, and keep playing.  They believe they will return to the top. But their bad luck continues.

By waiting to avoid losses, people hold off and then sell at the wrong time — maximizing their losses.


They lose their winnings, keep playing and generate losses. They would rather hold onto the idea of getting back to where they were at almost any cost than realizing their loss and moving on to another opportunity.


Reason #4

Why people sell commercial property too late:

Self Reliance Time Traps

Time Trap #1: Self-Education


People will self educate online because it is free and immediately available. A review of the search term on Google for “commercial real estate trends” returned 152 million results. A search for “commercial real estate trends YouTube” turned up 310 million results!

No doubt, an abundance of free information in the form of market data, blogs, market reports, and online opinions on what’s happening in the market is available.

Time Trap #2: Friends, Family, and Non-Commercial Advisors


When we aren’t sure what to do, we often consult friends, family, and non-commercial real estate advisors for input. Unfortunately, these people will not want to be the ones to say sell because it is easier to say no and risk being wrong than to say yes and risk not being right.

Plus, most of these folks will not have the data that you have seen here. These people are more likely to share anecdote based advice like “My friend made a killing in real estate. You should hold on, it will come back.” Remember, people who made this mistake lost in 2008-2010.

Time Trap #3: Hire a Traditional Broker


It is easy to find a traditional broker, given that 1 in 164 people in the United States today have a real estate license. According to the National Association of Realtors, there are about 2 million active real estate licensees in the United States.

The problem is that most traditional brokers do not specialize in Commercial Real Estate, Investment Sales and further specialization by property type. 


Have you thought of selling your property and would like to know what it's worth? Request a valuation for your property below:

Request Valuation

eXp Commercial Chicago Multifamily Brokerage focuses on listing and selling multifamily properties throughout the Chicago Area and Suburbs.

We don’t just market properties; we make a market for each property we represent. Each offering is thoroughly underwritten, aggressively priced, and accompanied by loan quotes to expedite the sales process. We leverage our broad national marketing platform syndicating to the top CRE Listing Sites for maximum exposure combined with an orchestrated competitive bidding process that yields higher sales prices for your property.


https://www.creconsult.net/market-trends/the-dangers-of-selling-commercial-property-too-late/

The Complete Guide to Determining Tax Basis on Commercial Real Estate

Are you thinking of selling a commercial income property? If so, it is important to calculate the correct tax basis to avoid higher capital gains tax when the property is sold. It is also necessary to determine the tax basis before you sell since the tax basis plays a role in determining depreciation.

In this blog, we’ll discuss the ins-and-outs of tax basis, also known as cost basis, then move on to how to calculate it, and finally, what it might mean to your bottom line.

What is Tax Basis?

Tax basis is the cost of the property paid in cash plus debt obligations or other property. It is determined by adding settlement and closing costs to the purchase price of the property.

According to the IRS, the following costs can be included when calculating tax basis:

  • Abstract fees (abstract of title fees)
  • Charges for installing utility services
  • Legal fees (including title search and preparation of the sales contract and deed)
  • Recording Fees
  • Surveys
  • Transfer taxes
  • Owner’s title insurance
  • Any amount the seller owes that you agree to pay, such as back taxes or interest, recording or mortgage fees, charges for improvements or repairs, and sales commissions.

On the contrary, the following costs cannot be included when calculating tax basis:

  • Casualty insurance premiums
  • Rent for occupancy of the property before closing
  • Charges for utilities or other services related to occupancy of the property before closing
  • Charges connected with getting a loan. The following are examples of these charges:
  1. Points (discount points, loan origination fees)
  2. Mortgage insurance premiums
  3. Loan assumption fees
  4. Cost of a credit report
  5. Fees for an appraisal required by a lender
  6. Fees for refinancing a mortgage.
  7.  

The basis of your investment property can either go up or down, depending on various factors. Thus capital improvements increase the basis, while depreciation decreases the cost basis.

Without proper tax basis planning, you will end up paying double taxes …

Once for the adjusted basis minus the depreciation claimed while you owned the property, and a second time for the 25% depreciation recapture tax, which is the difference between the property’s depreciated value and its adjusted basis.

Depreciation in Relation to Tax Basis

The IRS allows CRE investors to deduct depreciation from a commercial real estate building, as well as any capital improvements made, but it does not include land as a depreciable asset. While there are benefits to depreciation deductions while you own an investment property, these deductions will result in a higher capital gains tax when the property is sold.

For example, if the value of the sold property is higher than its depreciated value, you will have to pay further depreciation recapture taxes (which is 25%, a bit higher than the usual capital gains tax which is 15–23.8%). In the case of a sale, you will have to be very mindful of planning the recapture taxes.

1031 Exchanges & Tax Basis

The benefit of the IRS’s 1031 exchange code is clear here, as it allows you to defer capital gains tax through a properly structured exchange. Capital gains taxes range from 15% – 23.8%, depending on your tax bracket.

When selling an investment property and buying another with a 1031 exchange, the basis of the old property is transferred to the new property. For example, if the original property was sold for $2,500,000 with an adjusted cost basis of $750,000, then $750,000 would be carried forward to the new property.

If the purchase price of the replacement property was $3,000,000, then your adjusted basis would now be the original cost basis ($750,000) plus the difference in price between the original property and the replacement property ($500,000).

The new tax basis is 1,250,000, and is referred to as “boot.”

Cost Basis Calculation

1. First, calculate all of the closing costs related to the purchase of the investment property. Then add that number to the original purchase price.

2. Next, deduct any lender fees, points, loan assumption fees, or mortgage insurance premiums from the above number, since the IRS does not allow them to be included as settlement costs when determining cost basis (see list above).

3. Then, calculate the amount spent on capital improvements. According to the IRS, capital improvements improve the value of the property. Examples include replacing a roof or HVAC system, adding on a wing or extending a portion of the property, or extensive interior renovations that allow you to add more tenants or increase space within a commercial property. They may also include:

    • Changing a property’s use to a different use
    • Rebuilding a property that has already “met its useful life”
    • Replacing a major part of the property
    • A repair that creates an increase in efficiency, productivity, or capacity
    • Fixing a defect or design flaw

4. Finally, deduct the amount of depreciation that was claimed on the income property.

This final amount is now your adjusted cost basis.

When it comes to owning an investment property, be sure to keep all documents that pertain to repairs, improvements, or replacements, and use these documents to calculate depreciation and cost basis on a yearly basis. However, since knowing which expenses count as capital repairs can be complex, it is best to consult your accountant or tax professional.

To Wrap It Up – Understanding Tax Basis Can Preserve Thousands of Dollars in Capital

It is very important to know and adjust the tax basis of your commercial real estate property. If it is lower when selling or foreclosing the property, you will consequently have to pay higher capital gains tax. Whether you plan to sell or not, be precise with your cost basis calculation and consult with your financial advisors. A proper calculation can provide the most wealth-preserving advantages.


Source: The Complete Guide to Determining Tax Basis on Commercial Real Estate

https://www.creconsult.net/market-trends/the-complete-guide-to-determining-tax-basis-on-commercial-real-estate/

Friday, September 8, 2023

What is an Estimated Net Proceeds Sheet and How is this Important to Estimate Capital Gains Tax Exposure

A seller's net proceeds sheet is a document that estimates the amount of money a seller will receive after all closing costs have been paid. The amount of the net proceeds will vary depending on the purchase price of the property, the seller's existing mortgage balance, the amount of real estate taxes due, and other closing costs.

The following factors affect the net proceeds of a sale:

  • Purchase price: The higher the purchase price, the higher the net proceeds.
  • Mortgage balance: The lower the mortgage balance, the higher the net proceeds.
  • Closing costs: Closing costs can vary depending on the state and the type of transaction.
  • Other expenses: Other expenses, such as real estate taxes and home warranty fees, can also reduce the net proceeds.

The net proceeds of a sale are important to capital gains tax exposure because they determine the amount of profit that is subject to tax. The seller's taxable gain is calculated by subtracting the adjusted basis of the property from the net proceeds. The adjusted basis is the original purchase price of the property plus the cost of any improvements that have been made.

For example, if a seller sells a property for $500,000 and has an adjusted basis of $300,000, then the seller's taxable gain is $200,000. The seller will owe capital gains tax on this amount.

The amount of capital gains tax that a seller owes will depend on the seller's income tax bracket and the length of time that the property was held. For example, a seller in the 22% income tax bracket who held the property for less than one year will owe a capital gains tax of 22% on the $200,000 gain.

Selling a property can be a profitable transaction, but it is important to understand the factors that affect the net proceeds and how this can impact your capital gains tax exposure. By understanding these factors, you can make informed decisions about when to sell your property and how to minimize your tax liability.

Here are some tips for sellers to minimize their capital gains tax exposure:

  • Hold the property for at least one year: If you hold the property for at least one year, you will be taxed at the long-term capital gains rate, which is typically lower than the short-term capital gains rate.
  • Make improvements to the property: Any improvements that you make to the property can increase the adjusted basis, which will reduce your taxable gain.
  • Donate the property to charity: If you donate the property to charity, you may be able to claim a charitable deduction, which can offset your taxable gain.

By following these tips, you can minimize your capital gains tax exposure and keep more of the money you earn from selling your property.

https://www.creconsult.net/market-trends/what-is-an-estimated-net-proceeds-sheet-and-how-is-this-important-to-estimate-capital-gains-tax-exposure/

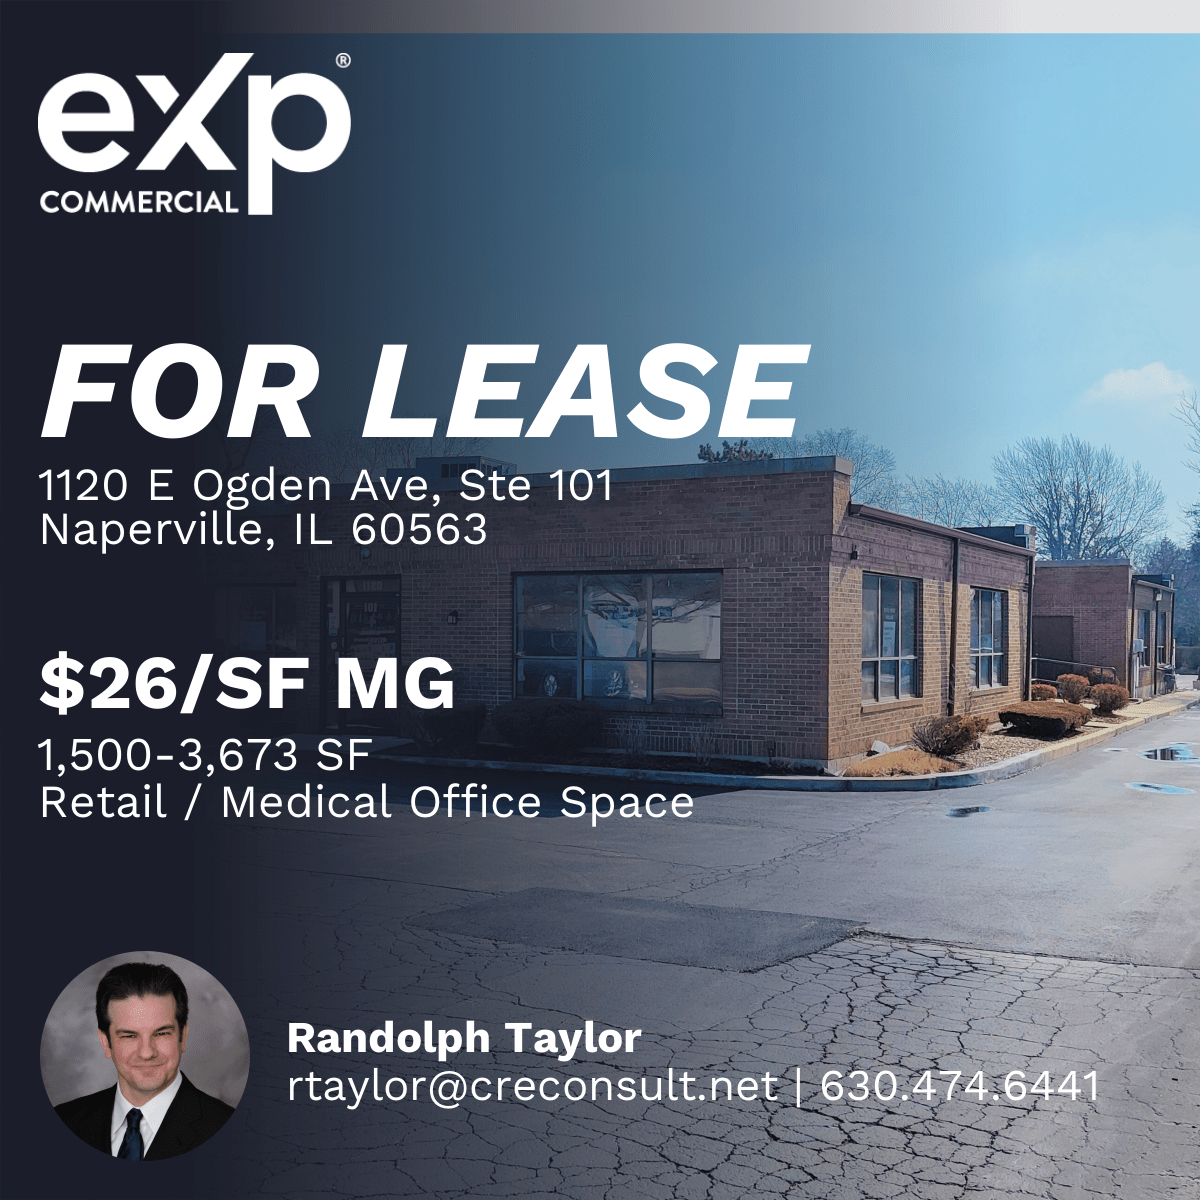
1120 E Ogden

Retail / Medical Office Space for lease in Naperville, IL
1,500–3,673 SF | $26/SF MG
1120 E Ogden Ave., Suite 101, Naperville, IL 60563
Broker: Randolph Taylor, rtaylor@creconsult.net, 630.474.6441

https://www.creconsult.net/retail-office-for-lease-1120-e-ogden-ave-suite-101-naperville-il-60563/

Thursday, September 7, 2023

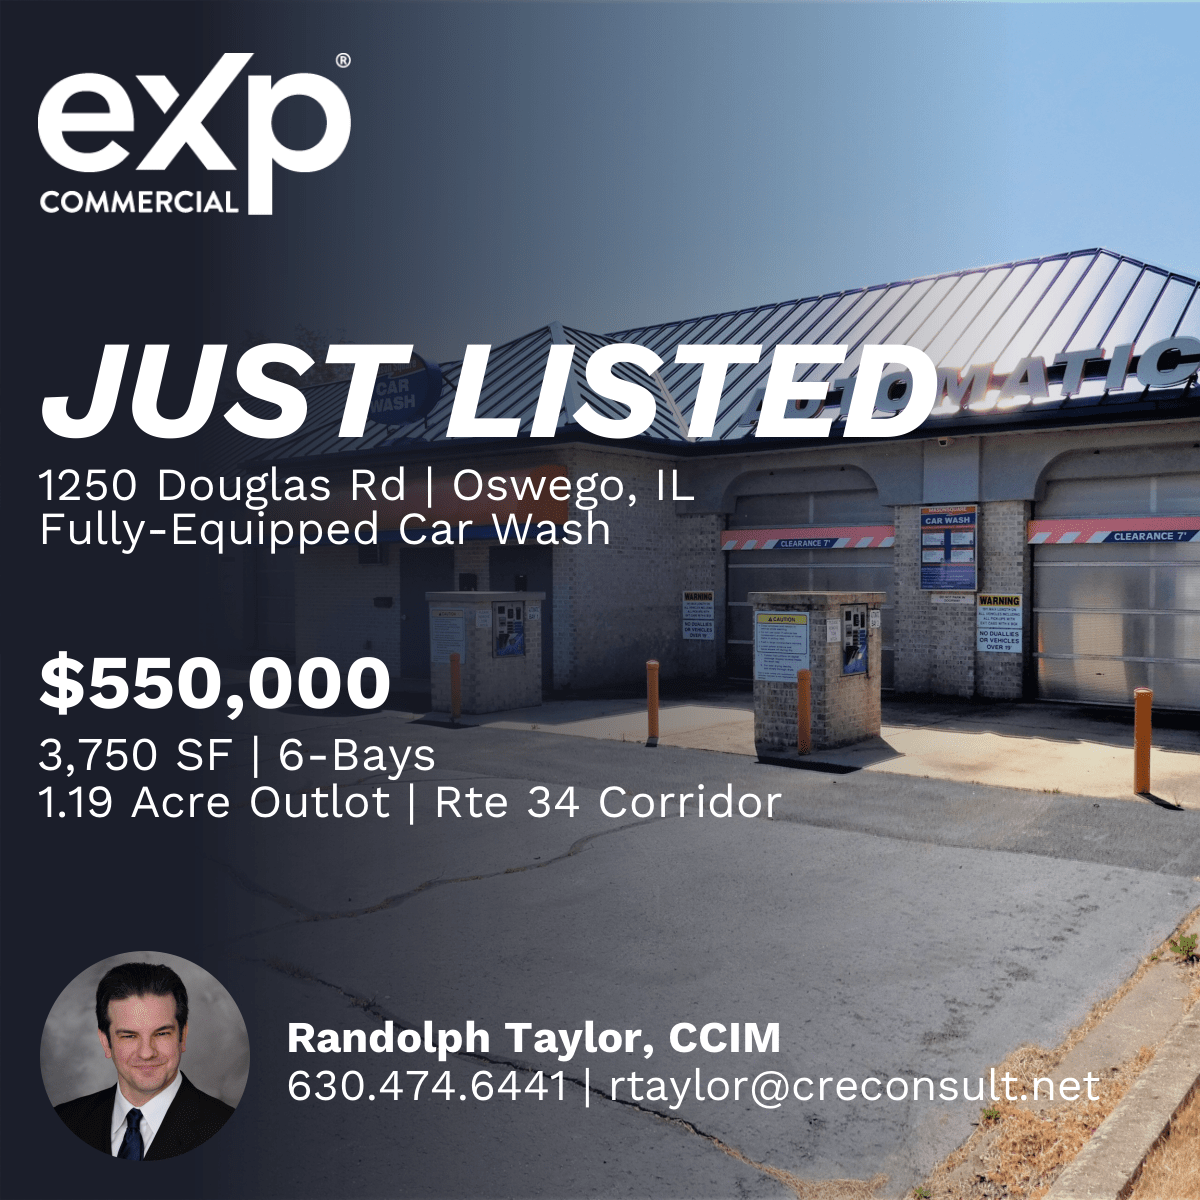
Mason Square

Fully Equipped Car Wash For Sale
1250 Douglas Rd. | Oswego, IL | 3,750 SF | 6 Bays | 1.19 Acres
Mason Square Car Wash, a fully equipped and operational 6-bay carwash in southwest suburban Chicago’s Oswego, IL. Ideally located on an out-lot of the Mason Square Shopping Center along heavily trafficked Route 34, averaging 45,000 vehicles per day,
Listing Agent: Randolph Taylor 630.474.6441 | rtaylor@creconsult.net
https://www.creconsult.net/fully-equipped-car-wash-oswego-il-route-34/

Here's who qualifies for 0% capital gains taxes for 2023

How to calculate your capital gains tax bracket

With higher standard deductions and income thresholds for capital gains, it's more likely you'll fall into the 0% bracket in 2023, Lucas said.

For 2023, you may qualify for the 0% long-term capital gains rate with taxable income of $44,625 or less for single filers and $89,250 or less for married couples filing jointly.

The rates use "taxable income," which is calculated by subtracting the greater of the standard or itemized deductions from your adjusted gross income.

For example, if a married couple makes $100,000 together in 2023, their taxable income may easily fall below $89,250 after subtracting the $27,700 married filing jointly standard deduction.

By comparison, you may have been in the 0% long-term capital gains bracket for 2022 with a taxable income of $41,675 or less for single filers and $83,350 or less for married couples filing jointly.

Other tax-planning opportunities

With taxable income below the thresholds, you can sell profitable assets without tax consequences. For some investors, selling may be a chance to diversify amid market volatility, Lucas said.

"It's there, it's available and it's a really good tax-planning opportunity," he added.

Whether you're taking gains or tax-loss harvesting, which uses losses to offset profits, "you really have to have a handle on your entire reportable picture," said Jim Guarino, a CFP, certified public accountant and managing director at Baker Newman Noyes in Woburn, Massachusetts.

That includes estimating year-end mutual fund payouts in taxable accounts — which many investors don't expect — and may cause a surprise tax bill, he said.

"Some additional loss harvesting might make a lot of sense if you've got that additional capital gain that's coming down the road," Guarino said.

Of course, the decision hinges on your taxable income, including payouts, since you won't have taxable gains in the 0% capital gains bracket.


Source: Here’s who qualifies for 0% capital gains taxes for 2023

https://www.creconsult.net/market-trends/heres-who-qualifies-for-0-capital-gains-taxes-for-2023/

Multifamily Investment Opportunity – Showings Scheduled Join us for a showing of two fully occupied, cash-flowing multifamily properties id...