Wednesday, January 17, 2024

The New Era of Rental Prices

The New Era of Rental Prices

For renters who've felt the sting of rapidly increasing costs, there's a sigh of relief on the horizon. The rapid inflation of rent prices, which has been a pressing concern for many in recent years, is showing signs of stabilization.

From Skyrocketing to Stabilizing: The New Era of Rental Prices

rental prices across the US

Analysis based on average monthly rent data for provided by CoStar Group. The data includes newly posted rents, not lease renewals, for 1,660 counties for June of each year from 2019 to 2023. Counties with fewer than 1,000 multi-units, according to Census Bureau data, were excluded.

Good news is on the horizon for renters: The rapid escalation in rental prices, which had previously seemed unstoppable, appears to be taking a pause.

Rental rollercoaster: Between 2020 and 2022, rents surged by a striking 15%, the most rapid increase in nearly a century. However, the fervor has calmed. Rent growth has reverted to pre-pandemic rates, seeing an annual growth of about 1 to 3 percent. Interestingly, in cities that recently witnessed surging rents like Austin and Atlanta, prices are now dropping. As Igor Popov, chief economist at Apartment List, observes, the rental market is "taking a breath.

Why the slowdown? A significant factor in this slowdown is the surge in housing construction. An impressive nearly 1 million new apartment units are currently under construction nationwide. By the end of 2023, over half of these are expected to be on the market. Concurrently, the demand for rentals is waning as the U.S. adjusts to post-pandemic life. The appetite for apartment living has decreased, with fewer individuals moving out and more staying in familial homes. This change has created a discrepancy between available apartments and interested renters, thereby stabilizing price growth.

more new apartments over 50 years

The Sun Belt phenomenon: The Sun Belt region, which includes parts of the Southern U.S., experienced a unique scenario. Initially, during the pandemic, there was a spike in demand as individuals sought warmer climates and more affordable living conditions, moving away from urban centers like New York. This shift led to a boom in rental prices in cities like Phoenix, Dallas, and Miami. However, the rush to meet this demand has led to an oversupply, causing rents to stabilize and even decrease in some areas.

sun belt cities rent price growth

➥ THE TAKEAWAY

The new normal: While renters can find solace in stabilizing prices and even some reductions, it's crucial to note that the cost of renting remains substantially higher than pre-pandemic levels in many areas. Areas like Atlanta, despite witnessing recent rent reductions, still have renters paying substantially more than before the pandemic. The introduction of incentives like months of free rent indicates a market adjusting to new realities, but the days of pre-pandemic affordability seem to be a distant memory for now.

Source: The New Era of Rental Prices

https://www.creconsult.net/market-trends/the-new-era-of-rental-prices/

Tuesday, January 16, 2024

Mid-Priced Apartment Demand Soars Amid Economic Uptick

Mid-Priced Apartment Demand Soars Amid Economic Uptick

Plus: CoStar's analysis shows a continued dip in CRE sale prices in October, aligning with the ongoing trend of increased rates.

Leasing Surge in Mid-Priced Apartments with Improved Economy

In 2023, the U.S. multifamily market has seen a significant upswing in renter demand, especially for mid-priced apartments rated three stars. This shift marks a recovery from a sluggish performance in the latter half of 2022.

A surge in demand: There has been a 77% increase in occupancy over the last year, with 260,000 more units being filled than vacated. This surge is primarily in mid-priced, three-star properties, contrasting with the disappointing absorption of only 146,000 units in 2022.

Influencing the market: The market slump in 2022 was driven by a combination of high inflation, increased oil prices, and recession fears, which significantly impacted consumer confidence and demand, especially in mid- and low-priced properties. This led to renters seeking more affordable housing solutions or delaying household formation.

Improving economy: The rebound in 2023 has been fueled by improved consumer confidence, lower inflation, strong wage growth, and reduced recession fears. These factors have notably increased the demand for three-star properties by 54,000 units in the first three quarters of the year.

➥ THE TAKEAWAY

Positive outlook: The high-end segment of the market, comprising four- and five-star properties, has remained stable, thanks to the lower rent-to-income ratio of its renter households. Looking ahead, if the economy avoids a recession, multifamily demand could return to pre-pandemic levels by 2024, although supply is expected to exceed demand for the third consecutive year.


Source: Mid-Priced Apartment Demand Soars Amid Economic Uptick

https://www.creconsult.net/market-trends/mid-priced-apartment-demand-soars-amid-economic-uptick/

Chicago Multifamily Brokerage | eXp commercial

Chicago Multifamily Brokerage | eXp Commercial No Matter Where You Area In The Investment Cycle We Can Help You! Commercial Real Estate Brokerage firm specializing in the listing and sale of multifamily properties in the Chicago area and suburbs. Website: https://www.creconsult.net Phone: 630.474.6441 Email: rtaylor@creconsult.net

Monday, January 15, 2024

1031 Exchange: A Comprehensive Guide

1031 Exchange Rules: A Comprehensive Guide

In the world of real estate investment, savvy investors are constantly seeking strategies to maximize their returns while minimizing tax liabilities. To accomplish these objectives, the Section 1031 of the Internal Revenue Code-authorized 1031 exchange has grown in popularity. This comprehensive guide will provide an in-depth exploration of 1031 exchange rules, shedding light on the intricate details that investors must adhere to for a successful exchange. From understanding the concept of a 1031 exchange to meeting strict deadlines and utilizing qualified intermediaries, we will cover everything you need to know to make the most of this lucrative tax-saving strategy.

First, our Disclaimer: We are not licensed CPAs or attorneys. This article is not intended to provide deal-specific professional advice. This article discusses the general framework of 1031 exchanges. Anyone engaging in this tax strategy should seek professional accounting and/or legal advice.

What is a 1031 exchange?

At its core, a 1031 exchange, also known as a like-kind exchange, is a tax-deferral strategy that enables real estate investors to sell a property and reinvest the proceeds in a similar, like-kind property without recognizing any gain for tax purposes. By doing so, investors can defer the tax obligation associated with any gain, allowing them to reinvest the entire sale proceeds into a new property, ultimately increasing their purchasing power and potential for wealth accumulation.

To qualify for a 1031 exchange, both the relinquished property (the property being sold) and the replacement property (the property being acquired) must be held for investment, business, or income-producing purposes. Personal-use properties, such as primary residences or vacation homes, do not qualify for like-kind exchanges

The Benefits of a 1031 Exchange

The advantages of a 1031 exchange are multifaceted and offer real estate investors unique opportunities for growth and wealth accumulation.

Tax Deferral: One of the most powerful benefits of a 1031 exchange is the ability to defer all taxes associated with a real estate transaction.  When selling an investment property, the list of taxes is overwhelming. The most popular is the federal capital gains tax, usually 20%. But this is only the beginning of the list. If the property is located in (or the seller resides in) a state with income taxes, the transaction is also subject to state income taxes; the average state rate is 7.5%. The IRS assumes you have a good accountant who depreciated the property. Most of us do, but even if you did not, the IRS assumes you did and levies a 25% depreciation recapture tax on the amount you deducted (or should have deducted) for depreciation. In addition to these taxes, the IRS also levies a net investment income tax (NIIT) of 3.8% on your profit. Depending on where you live and how long you have owned the property, these taxes can exceed 30% of your sales proceeds. By engaging in a 1031 exchange, investors can defer these taxes, allowing the capital that otherwise would go to state and federal governments to reinvest the full proceeds into a replacement property, thereby maximizing their investment potential.

Increased Purchasing Power: With taxes deferred, investors have access to a larger pool of funds to invest in higher-value replacement properties—properties that better fit the investor’s values and portfolio goals. This increased purchasing power enables investors to upgrade their portfolio, acquire properties with higher income potential, or diversify their holdings to align with their long-term investment objectives.

Portfolio Diversification: 1031 exchanges offer investors an opportunity to diversify their real estate holdings without incurring immediate tax liabilities. This flexibility allows investors to adapt their portfolio to market conditions, economic trends, and changing investment strategies, all while maintaining tax-deferred status.

Wealth Accumulation: By deferring capital gains taxes, investors can compound their investment returns over time, accelerating wealth accumulation and financial growth. As the real estate market appreciates and property values increase, investors can harness the power of compounding to achieve substantial long-term gains.

Understanding 1031 Exchange Rules

To ensure a successful 1031 exchange, investors must adhere to a set of rules and guidelines established by the Internal Revenue Service (IRS). These rules cover various aspects of the exchange, from identification periods to the use of qualified intermediaries:

Like-Kind Property Requirement

One fundamental rule of a 1031 exchange is the requirement that both the relinquished and replacement properties must be of “like-kind.” While the term “like-kind” may sound restrictive, it is relatively broad when applied to real estate. Essentially, any type of real estate used for business, trade, or investment purposes can qualify as like-kind to another. For example, an investor can exchange a residential rental property for a commercial office building or an industrial warehouse for a retail shopping center. The like-kind requirement does not focus on the specific type of property but rather the nature or character of the investment. As long as both properties are held for investment purposes, they generally qualify for a 1031 exchange.

Using a Qualified Intermediary (QI)

A Qualified Intermediary (QI) is a critical player in facilitating a 1031 exchange. As a neutral third-party entity, the QI serves as the intermediary between the buyer of the relinquished property and the seller of the replacement property. The QI’s primary role is to receive the sale proceeds from the relinquished property and hold them in escrow until they are used to acquire the replacement property. Using a QI is mandatory in a 1031 exchange to avoid disqualification of the exchange due to constructive receipt of funds. If the investor were to directly receive the sale proceeds, the IRS would view this as taxable income, disqualifying the exchange. The QI ensures that the exchange is strictly on a like-kind basis and adheres to all 1031 exchange rules.

The first step in a 1031 exchange should be to select your QI. This must be done before you close the transaction on the relinquished property. When selecting a QI, it is essential to choose a reputable and experienced entity with a thorough understanding of the exchange process. The QI should be a qualified intermediary who has no personal relationship with the investor to maintain impartiality.

Identification Period

The IRS imposes a strict timeline for identifying potential replacement properties after selling the relinquished property. Known as the identification period, this timeframe lasts for 45 calendar days, commencing on the date the relinquished property was closed.

During the identification period, investors must identify the replacement properties they intend to acquire. There are two popular identification rules most investors choose from:

a) Three-Property Rule: Investors can identify up to three potential replacement properties, regardless of their value. This allows for more flexibility in finding suitable replacements.

b) 200% Rule: Investors can identify any number of potential replacement properties, but the total value of all identified properties cannot exceed 200% of the relinquished property’s sale price. This rule offers investors more options while maintaining a degree of fairness in the exchange process.

180-Day Exchange Period

Beyond the identification period, investors must complete the 1031 exchange by acquiring the replacement property within 180 calendar days of selling the relinquished property. The 180-day exchange period begins on the date of the relinquished property sale and ends when the replacement property is acquired.

It is essential to note that the 180-day exchange period includes the 45-day identification period. Therefore, investors must act decisively during the identification period to identify suitable replacement properties and move forward with the acquisition process.

One-Property Rule

While investors can identify multiple replacement properties during the identification period, they must ultimately close on one or more of the identified properties to complete the exchange successfully. This rule is known as the one-property rule. Investors can choose one of the identified replacement properties or purchase multiple identified properties, as long as the total value of the acquired properties is equal to or greater than the relinquished property’s sale price.

Holding Period

To qualify for a 1031 exchange, both the relinquished and replacement properties must be held for investment, business, or income-producing purposes. The IRS requires that the investor’s intent for both properties be for long-term investment rather than short-term speculation or personal use.

The holding period plays a critical role in demonstrating the investor’s intent to qualify for the tax-deferred benefits of the 1031 exchange. While there is no specific holding period requirement set by the IRS, investors are advised to hold both the relinquished and replacement properties for a reasonable period to substantiate their intent.

By deferring capital gains taxes and unlocking the potential for increased purchasing power, portfolio diversification, and wealth accumulation, a 1031 exchange empowers investors to make strategic real estate decisions with long-term benefits in mind.

Tips for a Smooth 1031 Exchange

Navigating the rules of a 1031 exchange can be complex, but with careful planning and expert guidance, investors can execute a successful exchange. Here are some essential tips to make the process as smooth as possible:

Plan Ahead: Planning is the cornerstone of a successful 10-31 exchange. Begin considering the exchange long before selling the relinquished property to ensure ample time for property identification and replacement property research.

Consult with professionals: Engage with experienced tax advisors, real estate attorneys, and qualified intermediaries early in the process. Their expertise will help you navigate the rules and ensure compliance with IRS regulations.

Identify Replacement Properties Wisely: During the 45-day identification period, carefully consider potential replacement properties and their feasibility. Be mindful of the specific rules governing the number of properties that can be identified to avoid disqualification.

Choose a Reliable Qualified Intermediary: The Qualified Intermediary is a crucial component of the 1031 exchange process. Selecting a reputable and experienced QI will facilitate a seamless and efficient exchange.

Consider Replacement Property Financing: Ensure that you have access to the necessary funds to acquire the replacement property within the 180-day exchange period. Explore financing options in advance to avoid delays or missed opportunities.If you sell a property for $2 million with $1 million of debt that gets paid off at closing, you must still exchange that property for a property that costs at least $2 million. In the current market, many investors are not prepared for the cost and difficulty of getting replacement financing.

Document Your Intent: Maintain clear documentation of your intent to hold the properties for investment or business purposes. This documentation will be crucial in substantiating your qualification for the 1031 exchange.

Common Pitfalls to Avoid

While a 1031 exchange can be a game-changing tax strategy, there are common pitfalls that investors must avoid to ensure a successful exchange:

Failing to Use a Qualified Intermediary: Attempting to handle the exchange funds directly or using an unqualified intermediary can lead to constructive receipt of the proceeds, disqualifying the exchange. This is an unforgivable sin. Once you take constructive receipt of the funds, your exchange is disqualified. Engage a QI while your relinquished property is under contract.

Missing Deadlines: Strict adherence to the 45-day identification period and the 180-day exchange period is essential. Missing these deadlines can lead to the disqualification of the exchange and tax liability.

Inadequate Replacement Property Research: Rushing through the identification process without thorough research on potential replacement properties may lead to unsuitable investments. Many exchangers begin searching for their replacement property before they even put the relinquished property on the market.

Non-Like-Kind Property Exchange: Failure to invest in a property that qualifies as like-kind can disqualify the exchange and trigger capital gains taxes. You cannot sell a rental property and buy a vacation home. If the replacement property is used for personal purposes, it will not qualify for the 1031 exchange, resulting in tax liability.

Forgetting to Account for Closing Costs: Make sure to account for any closing costs, including title fees and brokerage commissions, to avoid potential boot, which could result in partial taxation.

Conclusion

The 1031 exchange offers real estate investors a powerful tool for deferring capital gains taxes and maximizing investment potential. However, successful execution requires a thorough understanding of 1031 exchange rules, strict adherence to deadlines, and the use of a qualified intermediary. By deferring taxes, increasing purchasing power, and diversifying portfolios, investors can leverage the 1031 exchange to build long-term wealth and achieve their financial goals.


Source: 1031 Exchange: A Comprehensive Guide

https://www.creconsult.net/market-trends/1031-exchange-a-comprehensive-guide/

Sunday, January 14, 2024

Forecasters Expect 1% GDP in Foreseeable Future

Forecasters Expect 1% GDP in the foreseeable future.

Three-quarters of the economists think the chance of a recession is a coin flip at most.

The National Association for Business Economists released its December 2023 economic outlook from a panel of 40 professional forecasters. Their take: 2023 will have seen stronger growth than they expected in October, but they think that growth will slow to 1% sometime between now and the fourth quarter of 2024.

A slowdown in growth, by the way, is not necessarily a recession. “Fewer respondents than in the October 2023 Outlook survey expect a recession within the next 12 months, with more than three in four assigning a probability of 50% or less,” said NABE President Ellen Zentner, chief U.S. economist, Morgan Stanley, in prepared remarks. “While most respondents expect an uptick in the unemployment rate going forward, a majority anticipates that the rate will not exceed 5%. Too much monetary policy tightness and broadening conflicts in Ukraine and the Middle East are cited as the largest downside risks for the U.S. economy.”

Looking at core inflation—looking at goods and services absent food and energy because their volatility makes it difficult to find trends—the forecasters largely expected it to continue slowing, but they doubted that it would hit the 2% level the Federal Reserve has been seeking before the end of 2024. The median forecast still sees headline CPI to reach 2.4% year over year by the fourth quarter of 2024.

If correct, that is a counter to market expectations of rate cuts in 2024, at least if the Fed keeps the ground that it has staked out. The central bank has made it clear that there won’t be rate cuts until inflation reaches that 2% level. Counting on a Fed retreat may be counterproductive and lead not only to disappointment but also to poor planning for the future.

But the panelists are largely convinced that even if 2% inflation isn’t in hand, there will be rate cuts. “More than two-thirds expect the [2% inflation] target will be reached in 2025 or later,” NABE Outlook Survey Chair Mervin Jebaraj, director, Center for Business and Economic Research at the University of Arkansas, says in prepared remarks. “Still, more than 80% of panelists believe interest-rate cuts will begin in 2024, with most expecting cuts to start in the second or third quarter of 2024. Expectations for the 10-year Treasury bond yield for year-end 2023 and 2024 are higher than in the October 2023 survey—at 4.6% and 4.1%, respectively.”


Source: Forecasters Expect 1% GDP in Foreseeable Future

https://www.creconsult.net/market-trends/forecasters-expect-1-gdp-in-foreseeable-future/

Saturday, January 13, 2024

Single-Family Starts Exceed Multifamily

Single-Family Starts Exceed Multifamily

Single-family permits that start in October 2023 were 13% higher in the U.S. than the prior year

From September to October this year, multifamily starts and multifamily permitting rose in the U.S. as a whole. But on an annual basis, the picture was not so rosy, according to a report by RealPage Analytics.

The seasonally adjusted annual rate (SAAR) for multifamily starts fell 31.8% from last October—"a"much steeper decline than seen in the year-to-date unadjusted starts data,” the report stated. However, the SAAR was up 4.9% from September to 382,000 units.

October permits for multifamily housing also fell 27.8% from the prior year to 469,000 units. But that figure was 2.2% higher than in September.

On the other hand, multifamily completions rose 14.3% from the previous October, though they were down 12.6% in October compared to September to 408,000 units. There was no change in the number of units under construction from one month to the next, but the total of 987,000 was 8.3% higher than the prior year.

“The sharp annual decrease in multifamily permitting brought the SAAR of total residential permitting down 4.4% from last October to 1.487 million units, and multifamily starts were down 4.1% from last year to 1.372 million units,” the report noted.

The annual slump in multifamily permitting was felt in three of the four Census regions: the Midwest, South, and West. The only exception was the Northeast, where permitting rose 28.3% to 56,000 units. In contrast, the only region to see a year-over-year increase in the number of multifamily starts was the Midwest, where they rose 25.9% to 124,000 units. Compared to September, permits were down in the Midwest and West and up in the South and Northeast, while starts were down in the Northeast and South and up in the Midwest and West.

By metro, New York led the nation in multifamily permitting, though the rate slowed from the previous year. Others in the top 10 for permits granted were Austin, Dallas, Phoenix, Houston, Atlanta, Washington, DC, Los Angeles, Miami, and Raleigh-Durham.

The story for single-family housing was somewhat different. Though unchanged from September, single-family permitting and starts in October 2023 were 13% higher in the USA than the prior year, with 968,000 permitted units and 970,000 starts. “Single-family completions were down slightly (-0.9%) for the month but were up 2% for the year to 993,000 units. The number of single-family units under construction was essentially unchanged from September’s pace of 669,000 units, but that was 14.5% less than one year ago,” the blog noted.


Source: Single-Family Starts Exceed Multifamily

https://www.creconsult.net/market-trends/single-family-starts-exceed-multifamily/

Friday, January 12, 2024

National Multifamily Report – November 2023

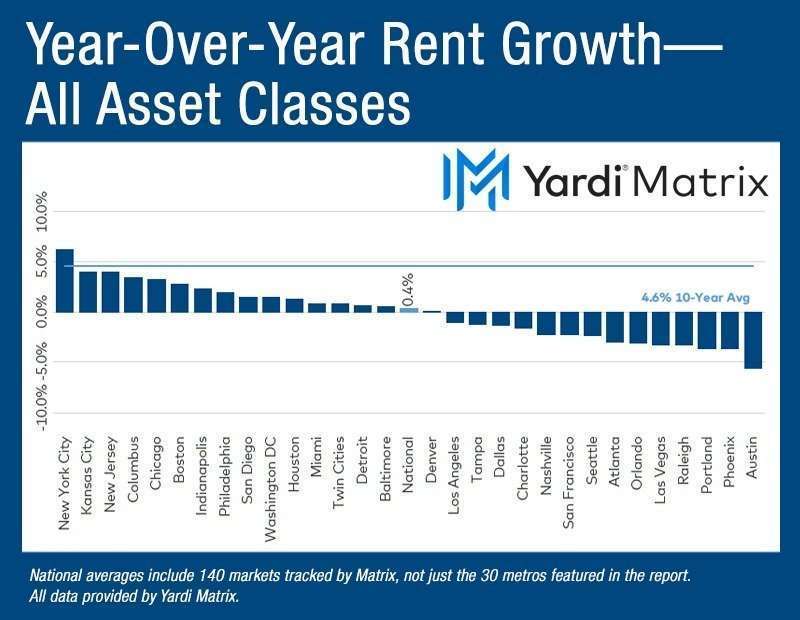
Year-over-year rent growth remained unchanged at 0.4 percent, according to Yardi Matrix.

Year-over-year multifamily rent growth, all asset classes. Chart courtesy of Yardi Matrix

The seasonal winter slowdown led to tepid performance across the U.S. multifamily market, with the average national asking rent declining $6 to $1,713 in November, down for the third consecutive month, according to the Yardi Matrix’s latest survey of 140 markets. On a year-over-year basis, the U.S. rate rose 0.4 percent, unchanged from September. Meanwhile, the occupancy rate remained at 94.9 percent. Rents declined in the SFR segment, too, down $8 to $2,117 in November, for a 0.7 percent year-over-year increase. Occupancy was unchanged in October, at 94.9 percent.

Since March 2020, the average asking rent increased 23.5 percent, boosted by markets in the Sunbelt and the suburbs of primary metros. Examples include low-cost and fast-growing metros such as Knoxville (51.5 percent), Albuquerque (45.5 percent), Savannah (44.9 percent), Charleston (41.8 percent) and Mobile (40.7 percent); second and retirement homes areas such as Southwest Florida Coast (49.1 percent), West Palm Beach (43.3 percent) and Asheville, N.C. and Tucson (both 40.1 percent). Large and expensive markets saw the smallest growth (San Jose (4.0 percent), Urban Los Angeles (10.3 percent), New York City (12.0 percent), Urban Chicago (14.4 percent) and Urban Philadelphia (16.9 percent). More so, Urban San Francisco is the only market with rents below pre-pandemic levels (-2.5 percent).

Rent growth split geographically between gains and losses

Rent performance was uneven across the map but balanced enough between year-over-year gains and losses. Among Yardi Matrix’s top 30 metros, the Northeast and Midwest regions led gains, with New York City (6.2 percent year-over-year), Kansas City (4.0 percent), New Jersey (4.0 percent), Columbus (3.4 percent) and Chicago (3.2 percent) posting the highest advances. In contrast, Sunbelt and West metros lagged. More so, negative rent growth is intensifying, with seven of Yardi Matrix’s top 30 metros posting rent contractions of 3.0 percent or more year-over-year, with most of these located in Sunbelt markets where developers brought online robust volumes of deliveries. Occupancy declined or remained flat year-over-year as of October in all but four markets: Chicago (up 0.4 percent), Denver (0.3 percent), Seattle (0.1 percent) and Washington, D.C. (0.1 percent). Atlanta posted the largest occupancy decrease down 1.3 percent.

On a monthly basis, the U.S. multifamily asking rent declined 0.3 percent in November, down 0.2 percent in the Renter-by-Necessity segment and down 0.4 percent in the Lifestyle segment. Specifically, rent growth was negative in 27 of the top 30 metros in Lifestyle and 20 in the RBN segment. The largest declines in both segments were recorded in Raleigh (-1.1 percent in Lifestyle and -1.3 percent in RBN) and Charlotte (-0.9 percent in Lifestyle and -1.1 percent in RBN). Only five metros posted gains in month-over-month rent growth, led by Kansas City (0.6 percent), New York (0.5 percent) and Houston (0.4 percent). Austin, Nashville and Charlotte led in completions as a percentage of stock, which caused significant rent and occupancy declines.

Renewal rent growth moderated to 6.0 percent year-over-year in September, down 40 basis points from August. With a few exceptions, the highest renewal rents were in metros where asking rents increased, such as New York (8.2 percent), Boston (7.4 percent), Indianapolis (7.2 percent), Kansas City (6.9 percent) and New Jersey (6.8 percent). Bottom-ranking metros were San Francisco (2.5 percent), Phoenix (2.6 percent) and Dallas (3.2 percent)—in these metros asking rents turned negative. Meanwhile, the national lease renewal rate clocked in at 65.2 percent in September, hovering between 64.7 percent and 66.0 percent for the last five months. The highest rate was recorded in New Jersey (81.5 percent) and the lowest in Los Angeles (47.6 percent).

Single-family rents declined $8 in November to $2,115, a 0.7 percent year-over-year increase, down 30 basis points from October, marking the largest one-month decrease in years. Rent growth was entirely sustained by the RBN segment, up 3.2 percent year-over-year, while lifestyle rents slid 0.1 percent during the period. Meanwhile, occupancy stood at 95.9 percent for the fifth consecutive month in October. According to Yardi Matrix’s database, 58,000 SFR properties were under construction in November. Leading in construction pipelines were Jacksonville (2,256 units underway), Orlando (1.365 units), Savannah, Ga. (1.343 units), and Huntsville, Ala. (1,142 units).

Source: National Multifamily Report – November 2023

https://www.creconsult.net/market-trends/national-multifamily-report-november-2023/

Multifamily Investment Opportunity – Showings Scheduled Join us for a showing of two fully occupied, cash-flowing multifamily properties id...