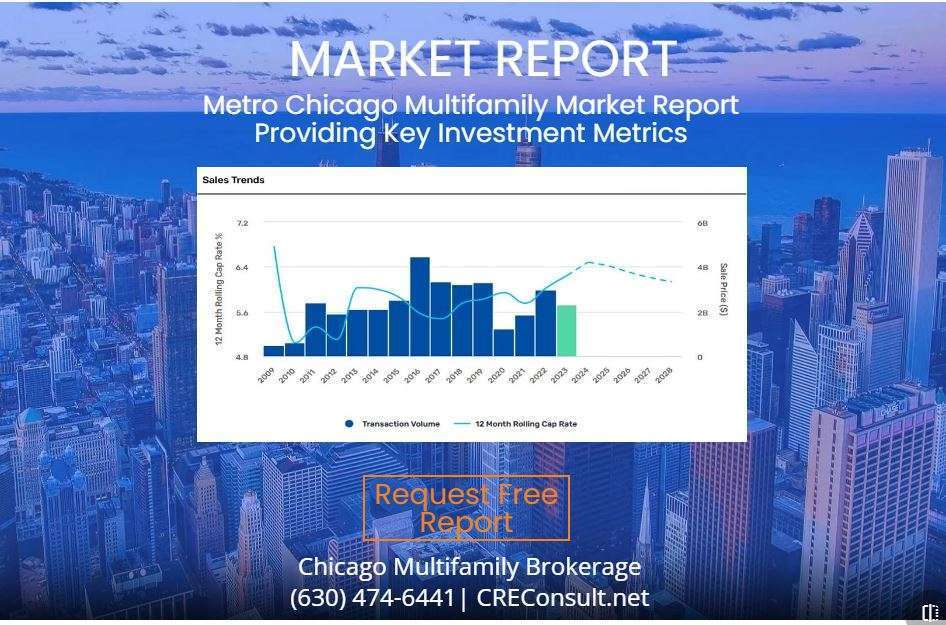
eXp Commercial is one of the fastest-growing national commercial real estate brokerage firms. The Chicago Multifamily Brokerage Division focuses on listing and selling multifamily properties throughout the Chicago Area and Suburbs.
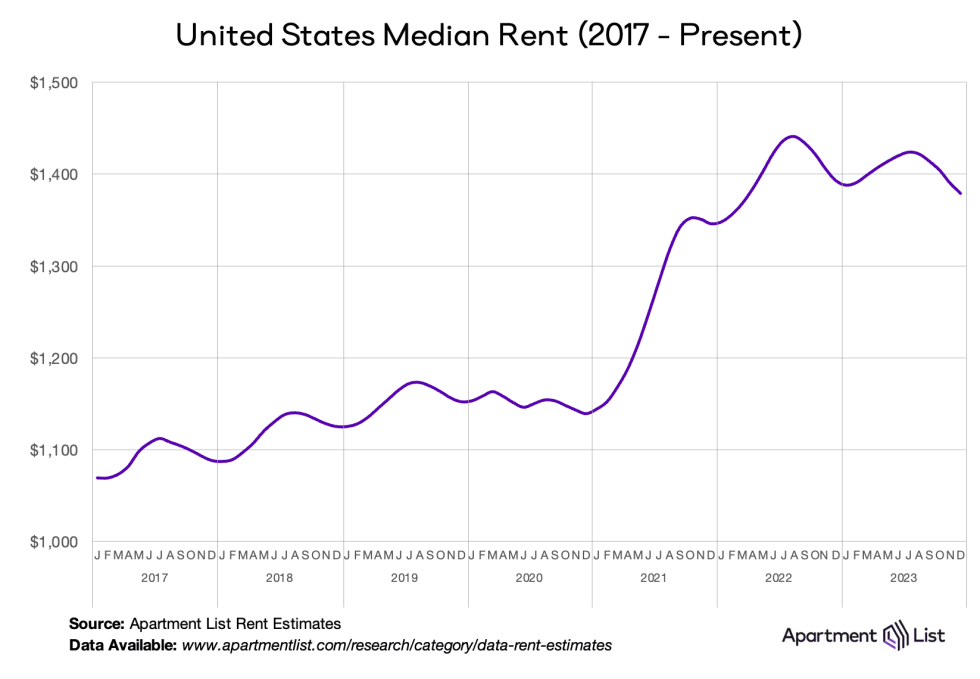
Happy New Year and welcome to the January 2024 Apartment List National Rent Report! The rental market closed out 2023 with a fifth straight month of negative rent growth, as the nationwide median rent fell by 0.8 percent to $1,379.1 The recent declines are in line with the rental market’s typical seasonal pattern, as fewer renters are looking to move at this time of year, although this year’s dip has been a bit sharper than what we normally see.
Year-over-year rent growth has bottomed out but remains in negative territory at -1 percent, meaning that on average, apartments across the country are slightly cheaper today than they were one year ago. This stands in sharp contrast to the prevailing conditions of 2021 and 2022, when rent prices were surging and year-over-year growth peaked at 18 percent nationally. But despite this cooldown, the national median rent is still nearly $250 per month higher than it was just three years ago.
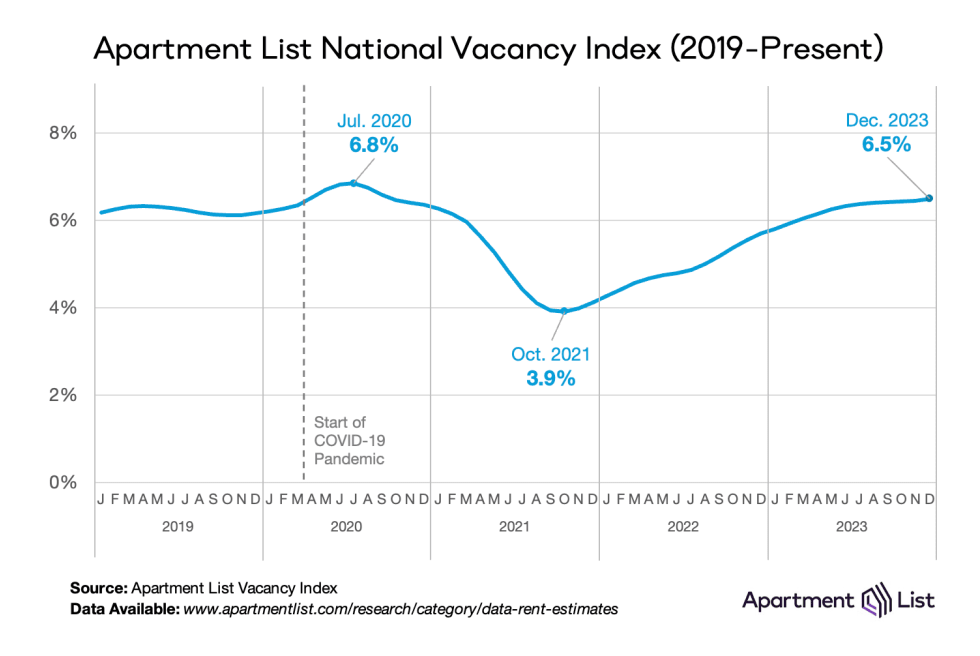
On the supply side of the market, our national vacancy index stands at 6.5 percent, slightly higher than the pre-pandemic average. This represents the culmination of vacancies gradually easing for two full years after a historic tightening in 2021. And with the construction pipeline of new apartments still near record levels, we expect that there will continue to be an abundance of vacant units on the market in the year ahead.
Regionally, rents fell in December in 83 of the nation’s 100 largest cities, and prices are down year-over-year in 60 of these 100 cities. The sharpest rent declines over the past year has been in Oakland, CA, where rents are down by 9.3% year-over-year. Atlanta, GA; Portland, OR; and Austin, TX have all also seen rents fall by more than 5 percent.
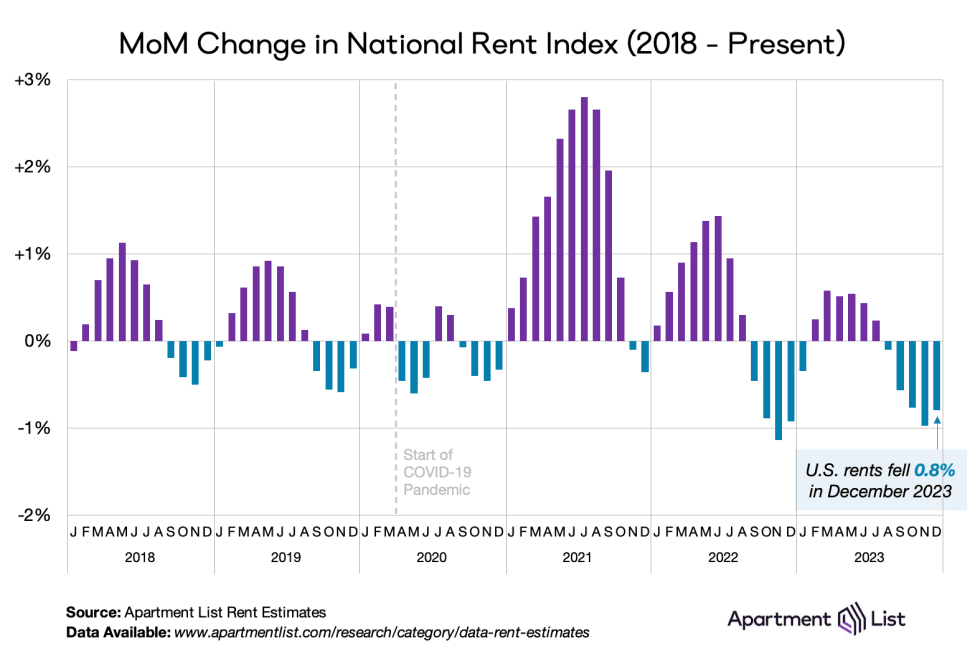
Rents are down 0.8% month-over-month, down 1% year-over-year
Rent growth follows a seasonal pattern – rent increases generally take place during the spring and summer, whereas the fall and winter usually see a modest price dip. We are now squarely in the midst of the rental market’s off-season, as reflected in recent price trends. Rents began to dip last August, and have now fallen for five straight months as of December’s 0.8 percent decline.
December’s decline was a bit more modest than the 1 percent dip that we saw in November. But this is also the second steepest December rent decline that we’ve seen in the history of our index (going back to 2017). The only time that December brought a sharper decline was in 2022, when rents fell by 0.9 percent as the market shifted into the period of sluggishness that still persists. For comparison, from 2017 to 2020, December declines averaged 0.3 percent.
On a year-over-year basis, rents nationally are down 1 percent. Year-over-year rent growth fell to zero in June for the first time since the early stages of the pandemic, and has now been in negative territory for seven consecutive months.
Over the course of 2023 as a whole, rents fell by 0.7 percent, making it the second weakest year of rent growth in our data, coming ahead of only 2020. For comparison, during the steady-state years of 2017 to 2019 before the pandemic, full year rent growth averaged 2.6 percent. After prices skyrocketed in 2021 and 2022, the pendulum swung back a bit in 2023 as price growth was kept in check by sluggish demand colliding with a robust supply of new inventory hitting the market.
The rental market slowdown in finally reflected in inflation numbers
The primary measure of inflation in the United States is the Bureau of Labor Statistics's Consumer Price Index (CPI), which is heavily influenced by changes in housing prices.2 The Apartment List National Rent Index has proven to be a strong leading indicator of the CPI housing and rent components, since our index captures price changes in new leases, which are only later reflected in price changes across all leases (what the CPI measures).
Because of these methodological differences, when our index peaked with record-setting rent growth in late 2021 (+17.8 percent), the CPI’s measure of household inflation was still in the early stages of its upswing. And while rent growth as measured by our index was cooling over the course of 2022, the CPI measure continued to rise. But as we had long been predicting, the shelter component of CPI finally turned the corner earlier this year and has now been steadily cooling for six months. As the official measure of shelter inflation continues to trend down, it will help overall inflation continue to ease along with it. While most components of inflation are difficult to predict, the Apartment List rent index can confidently tell us where shelter CPI is headed.
Apartment vacancies are back above pre-pandemic levels
The price fluctuations that have rocked the rental market over the past three years are largely attributable to changes in the balance between the number of vacant apartments available and the number of renters looking to move into them. Early in the pandemic, the Apartment List Vacancy Index rose to 6.8 percent as many Americans consolidated households and moved in with family amid large job losses and economic uncertainty. Then, a suddenly-tight rental market drove rapid rent growth in 2021 and 2022 as more households were competing for a dwindling supply of vacant units. Our vacancy index tightened rapidly from 6.8 percent to 3.9 percent in just over a year.
But after bottoming out in October 2021, our national vacancy index has been easing steadily for two full years. This easing has plateaued in recent months, but has not stopped entirely. In December, our vacancy index ticked up to 6.5 percent, the highest reading since September 2020. And there’s good reason to expect that it could rise even further in the year ahead. Despite a recent slowdown in new building permits being issued, the number of multifamily units under construction remains near record levels. As developers work through this robust construction pipeline, the supply of new apartment inventory should remain strong throughout 2024. This means that renters should have more available options than they have in some time, especially in the Sun Belt markets where construction activity has been strongest.
Vacancy trends are highly localized, and they have been a key indicator of rapidly evolving conditions in local markets across the U.S. throughout the pandemic. To explore the topic in greater detail, monthly vacancy data are now available for download for hundreds of cities, metros, and states, and can be easily linked to our existing rent estimates using Federal Information Processing System (FIPS) codes.
Rents down month-over-month in 83 of 100 largest cities, down year-over-year in 60
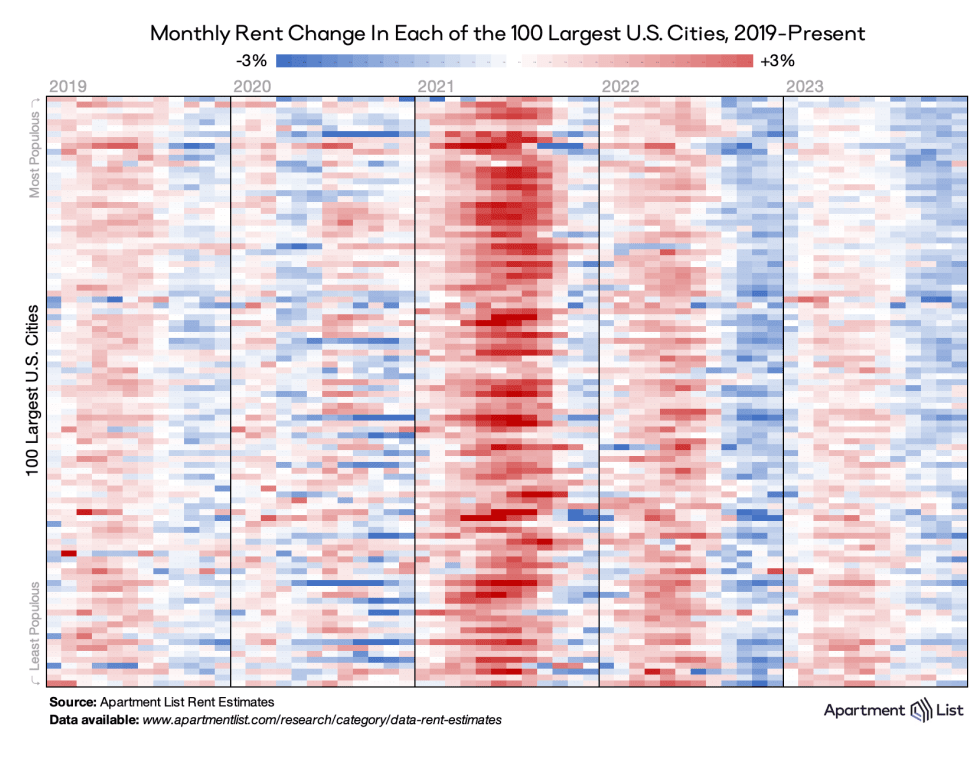
The chart below visualizes monthly rent changes in each of the nation’s 100 largest cities from January 2019 to present. The color in each cell represents the extent to which prices went up (red) or down (blue) in a given city in a given month. We see a typical seasonal pattern in 2019, followed by 2020, where horizontal bands of dark blue represent steep rent drops in some of the nation’s largest and most expensive cities. Meanwhile, the dark red bands in 2021 and 2022 represent the rent heatwave that drove up prices nationwide. But the rightmost columns of the chart show the rent cooldown in late 2022 and modest rent growth in 2023.
As nationwide rent growth was negative in December, so too was local rent growth in the majority of large cities across the county. 83 of the nation’s largest 100 cities saw prices fall month-over-month, and in 60 of these cities prices are down year-over-year.
In early 2022, all 100 of these cities were posting positive year-over-year rent increases. The first to turn negative were the early “zoom towns'' in states like Arizona, Nevada, and Idaho that surged in popularity in 2020 when much of the nation’s workforce went remote, but saw a pullback in demand as affordable options dissipated and more jobs were called back to city centers. Since then, larger cities have joined the trend, including much of California and the West Coast, Texas, and the Southeast. Currently the sharpest year-over-year decline can be found in Oakland, CA, where prices are down 9.3 percent compared to last December.
New supply drives falling rents in Austin
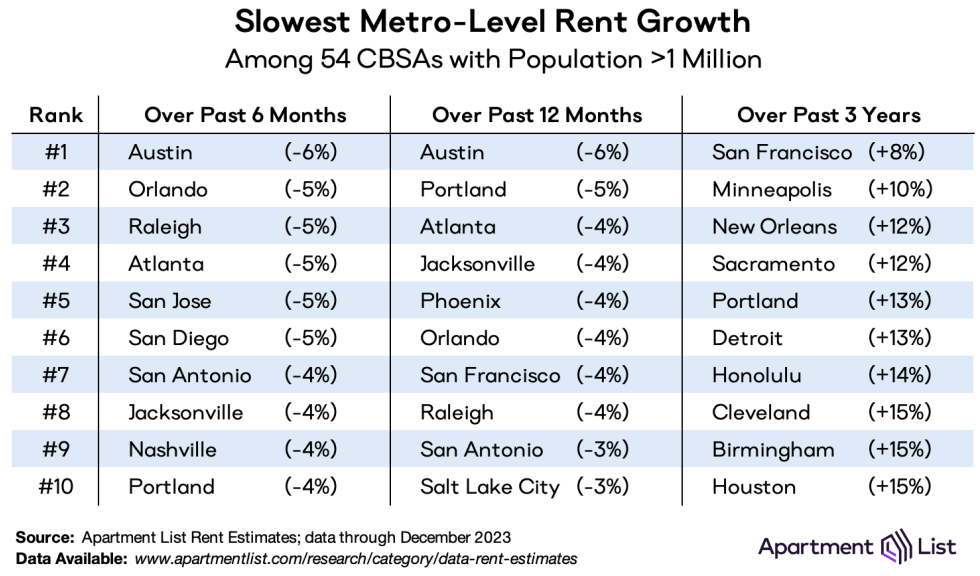
At the metro level, year-over-year rent declines are especially prevalent across Sun Belt metros, topped by Austin, where prices are down 6 percent in the last 12 months. The Austin metro is also significant for permitting new homes at the fastest pace of any large metro in the county, signaling the important role construction plays in managing long-term affordability. Atlanta, Jacksonville, Phoenix, Orlando, and Raleigh are other examples of Sun Belt metros whose year-over-year rent growth once peaked above 20 percent in 2021 but who now rank among the top 10 for fastest year-over-year declines.
The Portland and San Francisco metro areas are also experiencing some of the nation’s slowest year-over-year growth, showing that high-cost coastal metros are also seeing a slowdown in rental demand. These markets were among those that saw rapid declines in 2020, and are slowing again today, albeit less dramatically. The Portland metro in particular ranks in the top 10 for slowest rent growth over the past 6, 12, and 36 months, signaling that local rent growth has been slow for the entire pandemic period.
Midwestern and Northeastern markets have maintained positive rent growth
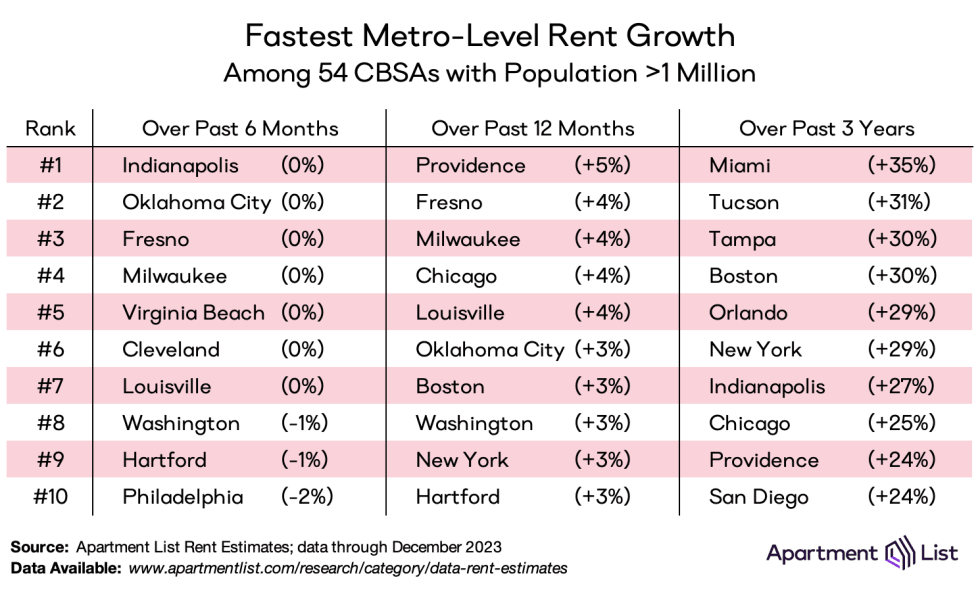
At the other end of the spectrum, the fastest rent growth has been occurring in metros across the Midwest and the Northeast. Most of the metros ranking high for rent growth over the past 6 and 12 months are located here. Providence leads the way for fastest year-over-year growth, highlighting how Rhode Island has become a popular destination, likely reflecting demand from renters who have been priced out of nearby Boston or possibly even New York City. That said, Boston, New York City, and Washington, D.C. all also rank among the top 10 for year-over-year growth, indicating that the major markets of the Northeast are drawing renters back.
Over the longer three-year period, the fastest rent growth is still found in the Sun Belt even as many metros there have cooled in 2023. The Miami metro tops the list with three-year rent growth of 35 percent, while the Tucson and Tampa metros round out the top three.
Conclusion
December’s 0.8 percent rent decline continues the rental market’s winter dip, and keeps year-over-year rent growth in the negative at -1 percent. Our national rent index is likely to fall for at least one more month before rebounding in line with the market’s typical seasonality. Looking further ahead, a robust construction pipeline should drive strong supply growth throughout 2024. On the other hand, the extent to which demand rebounds or remains sluggish will likely depend on broader macroeconomic conditions.
For complete data, explore the interactive map below or head over to our rental data page, where you can download the most recent estimates for your city, as well as historic data going back to 2017. And as always, feel free to contact us with any questions!
A Note on Our Methodology
Apartment List has long been committed to making our data products as accurate and transparent as possible. Our rent estimates and vacancy index are calculated as follows:
Rent Estimates: We estimate rent growth using a same-unit approach that controls for compositional changes in the rental stock. We also control for price fluctuations that arise over the course of a vacancy by identifying the last available list price before a unit gets rented as a proxy for its transacted price. Finally, we combat luxury bias in our rent data by benchmarking our reported rent levels to fully-representative median rent statistics from the Census Bureau’s American Community Survey.
Vacancy Index: Our real-time availability data allows us to calculate a daily vacancy rate for each of our partner properties, which we then average over the course of each month to calculate a monthly rate. Our overall index is an average of these property-level vacancy rates, weighted by the number of units in each property. We restrict our sample to properties that have been on Apartment List for at least six months and that have attained a stabilized vacancy rate of 15% or less.
Q4 2023 CRE Quarterly Economic Briefing After a Turbulent 2023, is it Now Safe to Move About the Cabin? Thursday, February 29th, 2024 | 2:00 PM EST | 11:00 AM PST Tough 4th Quarter for CRE, but there is Light at the End of the Tunnel
Commercial real estate performance was again weak as we closed the doors on 2023. Transaction volume remained subdued, prices declined further, and even with a resilient macroeconomy, rent growth finished the year well below average across most property types. But as usual, not all individual markets, neighborhoods, or assets, performed the same; the devil is certainly in the details. In this webinar, we will dissect our finalized 2023 trend data, provide clarity as to its current and future meaning for the market, and discuss the importance of the Fed’s looser monetary policy on the horizon. https://events.moodys.com/2024-02-amer-mau22915-macre-q4-2023-qeb-web#about-tab
Maximizing Your Success in Multifamily Property Sales in Naperville and Aurora
Introduction
Achieve unparalleled success in multifamily property sales in Naperville and Aurora with the strategic expertise of Randolph Taylor and the eXp Commercial team. Our dedicated approach ensures your property stands out in the competitive market. Discover innovative sales strategies on eXp Commercial's website and see how we can elevate your property's profile.
Why eXp Commercial is Your Ideal Partner
Tailored Expertise for the Naperville and Aurora MarketsRandolph Taylor brings unparalleled insights into the multifamily property landscape of Naperville and Aurora. Leveraging his extensive experience, we position your property for maximum exposure and optimal sales outcomes. Dive deeper into our market analysis techniques here.
Comprehensive Marketing Strategies At eXp Commercial, we don't just list your property; we launch it. Our comprehensive marketing strategies ensure your listing reaches a wide, qualified audience. From digital marketing to traditional advertising, we cover all bases. Learn about our unique approach here.
The eXp Commercial Advantage
Our commitment to your success is unmatched. Partnering with us means gaining access to cutting-edge tools, detailed market insights, and a team that's dedicated to achieving the best possible outcome for your multifamily property sale in Naperville and Aurora.
Conclusion
Don't leave your multifamily property sale in Naperville and Aurora to chance. Let Randolph Taylor and the eXp Commercial team guide you to success. Our expertise, tailored strategies, and unwavering dedication are the keys to unlocking your property's potential.
It’s no surprise that the inputs in your underwriting model have powerful effects on returns. The real art of underwriting comes down to how well you can use these inputs to make the most accurate analysis possible.
That’s why your Year 1 assumptions are so critical.
When I am underwriting a new deal, I take a look at how the trailing 12 months and trailing 3 months look on the profit and loss statement.
In combination with my own assumptions, market data, and feedback from our property management company, I then use the T12 and T3 to create my Year 1 pro forma. Your entire analysis then builds off of the Year 1 numbers.
Income Assumptions:
To make the most accurate Year 1 pro forma possible, have the T12 and T3 data next to your Year 1 assumptions.
Underwriting is all above identifying trends. By viewing the historical data, you can ask yourself questions like this:
How much of the utilities is the current owner billing back for? How much do we think can be recaptured in Year 1?
I’m constantly comparing my total income numbers to the historical figures. Sometimes I see underwriting from other sponsors where their Year 1 pro forma income is extremely high compared to the T12.
Depending on the business plan, this may be unrealistic to model. When we acquire a property, it takes time to renovate units, add new forms of income, and implement our business plan. I like to see a very gradual increase in my underwriting to be conservative.
Expense Assumptions:
Same goes for the operating expenses. It’s best practice to identify any trends from the T12 and T3 data.
What contracts are currently on the property?
What is the current owner paying for repairs? Will your Year 1 numbers be higher or lower?
How much is the current payroll expense? Is it possible your payroll will be more/less?
Are utilities rapidly increasing in the last few months? Will this effect your Year 1 numbers?
This is where passive investors can verify assumptions in the sponsor’s underwriting. Here you can check if the sponsor is expecting a tax reassessment in the first year. You can also clearly see how the Year 1 assumptions stack up against the historical numbers.
Making the most accurate Year 1 pro forma is critical because your entire analysis builds off of that. Use the T12, T3, and feedback from your property management company build the most accurate pro forma. Sometimes, abnormally high income changes in the first year may be unrealistic.
WHAT IS MY PROPERTY WORTH? Be informed about the value of your property before you make a major decision! Contact us to discuss: Broker: Randolph Taylor Multifamily Investment Sales Broker - Chicago eXp Commercial | National Multifamily Division (630) 474-6441 | rtaylor@creconsult.net https://www.creconsult.net/home-chicago-multifamily-brokerage/request-valuation/
What to Watch in 2024: Multifamily Outlook Offers Demand the Chance To Match Supply
Slowing Completions Would Be a Welcome Relief, but Pipelines in Most Sun Belt Markets Could Be Elevated
After hitting a 40-year high for completed units in 2023, the U.S. multifamily market is expected to see a 25% pullback next year, which should help balance out the market.
Roughly 590,000 units were completed last year, according to CoStar data, though only 444,000 units are projected to come on line in 2024. While this easing of new builds would likely be well-received by owners and property managers, it is still more than the five-year, pre-pandemic annual average of 360,000 units.
The projected slowing in completions would come none too soon given that the past two years of construction outpaced demand by 607,000 units, pushing the national vacancy rate up from 4.8% to 7.6%. Yet if absorption—the difference in move-ins versus move-outs—continues to rise as it has throughout 2023, and with the 2024 delivery schedule slowing, the multifamily supply-demand imbalance could move toward equilibrium.
Dallas-Fort Worth will likely win the crown for most units completed in 2024 for the second year in a row. With more than 27,000 new units forecast to be finished, Dallas-Fort Worth is expected to see 6,000 more units than second-place New York.
However, the big takeaway from the list of the highest number of units completed this year remains the elevated supply coming on line in markets already awash in units. Atlanta, Georgia; Austin, Texas; Charlotte, North Carolina; and Phoenix, Arizona, are all projected to see between 14,000 and 16,000 new units open during 2024. While those numbers are down for these markets except for Charlotte, compared with last year’s totals, it makes for difficult conditions when all four markets are already experiencing double-digit vacancy rates.
Another noteworthy observation reveals that, despite having a population close to 10 million in both Los Angeles and Chicago, these two major markets are projected to introduce fewer than 8,000 units each in 2024. Los Angeles and Chicago also have vacancy rates under 6%, which is below the national rate of 7.6%.
As a percentage of inventory, markets in the Sun Belt have taken the lead in terms of new completions. Eight of the top 10 markets growing their inventories are in the Sun Belt.
Charlotte leads the pack, with North Carolina's biggest city expected to expand its inventory by 7% this year. That is three times the national rate of 2.3%.
Overall, 13 out of 14 major Sun Belt locations have completions-to-inventory ratios above the national average, with Houston, at 2.1%, being the lone exception.
Most of the markets below the 2.3% national average are in the Midwest or on the West Coast. These markets are likely to be the best positioned to take advantage of expected stronger multifamily demand, as their smaller construction pipelines could push rent growth higher than most in 2024.
After three years of the national multifamily supply rising each year, 2024 may offer the nation a chance to catch its breath. However, not all markets will be able to take advantage of slowing completions if their pipelines remain elevated, as that could limit any upward movement in rent growth.