🏢 For Sale: Chicago Suburban Multifamily Portfolio – 24 Units | 100% Occupied 🏢
Two well-maintained 12-unit apartment buildings in Lyons, IL. Fully leased with strong in-place income, tenant stability, and long-term upside potential.
🔹 Portfolio Price: $3,100,000
🔹 24 Units Total | Mix of 2BR & 1BR Units
🔹 Gross Income: $376,584 | Total NOI: $211,452
🔹 Avg. Cap Rate (Current): 6.68% | Year 1: 8.35%
🔹 Select unit & common area updates completed
🔹 Convenient west suburban location | Ample parking
🔹 Just blocks apart | Offered together or individually
📍 View Property Details:
➡️ 4337 Prescott Ave: https://creconsult.net/chicago-multifamily-listings/lyons-il-multifamily-portfolio-for-sale/
➡️ 7821 43rd St: https://creconsult.net/chicago-multifamily-listings/multifamily-property-lyons-il/
—
📞 Listed exclusively by:
Randolph Taylor, CCIM
Vice President | Multifamily Broker
📧 rtaylor@creconsult.net
📱 (630) 474-6441
🌐 creconsult.net
—
#MultifamilyForSale #ChicagoSuburbs #LyonsIL #ApartmentPortfolio #CRE #RealEstateInvesting #PassiveIncome #ApartmentBroker #MultifamilyOpportunities #IncomeProducingProperties
Wednesday, June 11, 2025
Tuesday, June 10, 2025
Cap Rate Spreads Guide for Multifamily Sellers
Cap rate spreads aren’t as black-and-white as they seem. You can rattle off a national average, but speak to any investor in a fast-rising market or a quiet small town, and you'll get wildly different takes on what those spreads really reveal. So let’s roll up our sleeves and dig into why analyzing these differences actually gets you ahead.
The Illusion of the Average: Why Cap Rates Defy Simplicity
In commercial real estate, averages rarely tell the whole story. Whether you’re tracking real estate market trends or evaluating risk, national numbers often overlook the nuances that impact actual investment decisions.
Cap Rates: A Benchmark, Not a Rule
Cap rates help monitor general motion, but the real signal is in how much they vary. Those variations—between markets, property types, and asset classes—are where insights and returns often lie.
"It's a useful piece of information for monitoring general trends, but it most certainly is not the end of the road."
Investor Perspectives: Context Is Everything
Ask investors in New York vs. Kansas City about “normal” numbers, and you’ll get a range of answers. A 6% rate might seem high in a big city and low in a smaller one. That variance is shaped by local experience and economic conditions.
Property Class and Capital Flow
Consider the gap between
- Class A, primary market: ~4.7%
- Class C, tertiary market: 7.2%+
That 250+ basis point spread isn’t theoretical—it’s real-world investor calculus.
A Window into Opportunity (and Risk)
Cap rate variance reflects more than pricing. It highlights opportunity and potential volatility. Wide gaps can mean untapped potential or underlying risk. Narrow ones might suggest market maturity—or stagnation.
Spreads Across Markets
From primary to tertiary cities, real estate performance diverges sharply:
- Primary: 4.7%–6%
- Secondary: 5.8%–6.4%
- Tertiary: 6.6%–7.2%+
Capital tends to flow toward higher returns—until risk says otherwise.
Class Distinctions
In one metro, a Class A asset may see a 4.7% return, while Class C goes over 7.2%. The difference stems from investor confidence, location, tenant profile, and lending appetite.
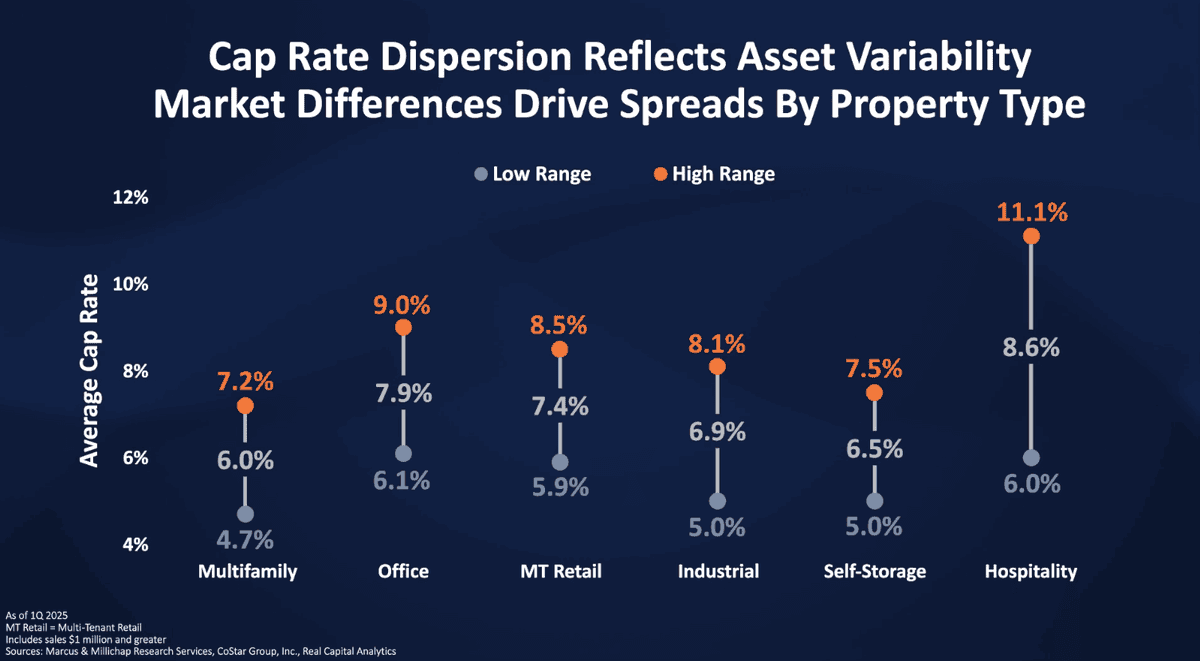
Cap Rate Ranges by Asset Type
Different sectors, different dynamics:
- Office: 4.6%–10.5% (Avg. ~7.4%)
- Retail: 5.9%–8.5% (Avg. ~7.4%)
- Industrial: 5%–8.1% (Avg. ~6.9%)
- Self-storage: 5%–7.5% (Avg. ~6.5%)
- Hotels: 6%–11% (Avg. ~8.6%)
These wide ranges reflect the complexity of each asset class.
What These Differences Reveal
Cap rate shifts aren’t just academic. In multi-family, rates jumped from 4.1% in 2021 to 5.2% by 2024. That change affects property values, financing terms, and investor expectations across the board.
Beyond the Data: Local Analysis Matters
National averages give a general sense, but granular market analysis unlocks real value. Look closely at economic drivers, capital flows, and property specifics to uncover hidden opportunities.
"Use a shovel, not a rake, when you're digging for insights."
Want deeper insights into property-specific investment strategy? Explore our guide on multifamily vs. office investments and check out our breakdown of cap rate trends by metro.
Thanks to Marcus & Millichap Research & Advisory Services for key insights. Watch the full video: https://player.vimeo.com/video/1091309920.
TL;DR: National averages give you the overview—but it’s the gaps between them that help investors make smarter moves.
https://creconsult.net/cap-rate-spreads-multifamily/?fsp_sid=953
Thursday, May 22, 2025
CALL FOR OFFERS: Friday May 30th
Multifamily Redevelopment Opportunity – 100 W Roosevelt Rd, Wheaton, IL
An exceptional opportunity to reposition two existing office buildings into a 22-unit multifamily community in one of Wheaton's most desirable corridors. Approved zoning and redevelopment plans are in place, supported by strong apartment demand and excellent site visibility along Roosevelt Road.
Key Highlights:
Approved for 22 multifamily rental units
R5 Residential Zoning | Approved PUD
1.51 Acres | 23,864 SF Total
Surface parking with 38 spaces
High-visibility location near downtown Wheaton
Offered at $1,650,000 with a projected valuation of $4,950,000 and an estimated 8.8% cap rate based on stabilized pro forma.
Learn more and view the full Offering Memorandum:
https://creconsult.net/park-place-wheaton-redevelopment/
For more information, contact:
Randolph Taylor, CCIM
Vice President | Investment Sales Broker
eXp Commercial – Chicago
Email: rtaylor@creconsult.net
Phone: 630-474-6441
Website: https://creconsult.net
#MultifamilyRedevelopment #WheatonIL #CRE #InvestmentOpportunity #ApartmentDevelopment #RealEstateInvestment
Wednesday, May 21, 2025
🏢 FOR SALE | CHICAGO SUBURBAN MULTIFAMILY
📍 4337 Prescott Ave | Lyons, IL
Fully Leased | Income-Producing | Upside
Final opportunity in a 3-property stabilized portfolio.
Renovated 12-unit building with proven cash flow and long-term rental upside.
🔹 Offered at: $1,520,000
🔹 Units: 12 (Strong 2BR/1BR mix)
🔹 Income (Actual): $188,292 Gross | $103,891 NOI
🔹 Cap Rate: 6.83% Actual | 8.53% Pro Forma
🔹 Parking, upgrades, and tenant-paid heat
📄 Offering Memorandum & Full Details:
👉 sl.creconsult.net/L
📞 Contact: Randolph Taylor, CCIM
rtaylor@creconsult.net | (630) 474-6441
Vice President | Multifamily Broker, eXp Commercial
#MultifamilyForSale #ChicagoRealEstate #ApartmentInvesting #CommercialRealEstate #ValueAdd #PassiveIncome #CRE #eXpCommercial
Monday, May 19, 2025
Commercial Real Estate Distress 2025 Trends
Introduction
Commercial real estate distress 2025 is taking center stage—but it’s not the crisis many assume. Just ask John Chang, Senior VP at Marcus & Millichap, whose on-the-road market update brings clarity and candor. His perspective captures the volatility of the market—and its resilience.
The Delinquency Decipher: Is CRE in Crisis?
Is this a wave or just ripples? CMBS delinquency rates rose 50 basis points in 2025—now 200 basis points higher than 2024. But the story is nuanced:
Office: 10.3%, still elevated, but below late 2024.
Industrial: 0.5%, near-zero distress.
Retail: 7.1%, improving from COVID-era highs.
Lodging: 7.9%, elevated but not alarming.
This isn’t a full-scale meltdown. It's targeted market friction.
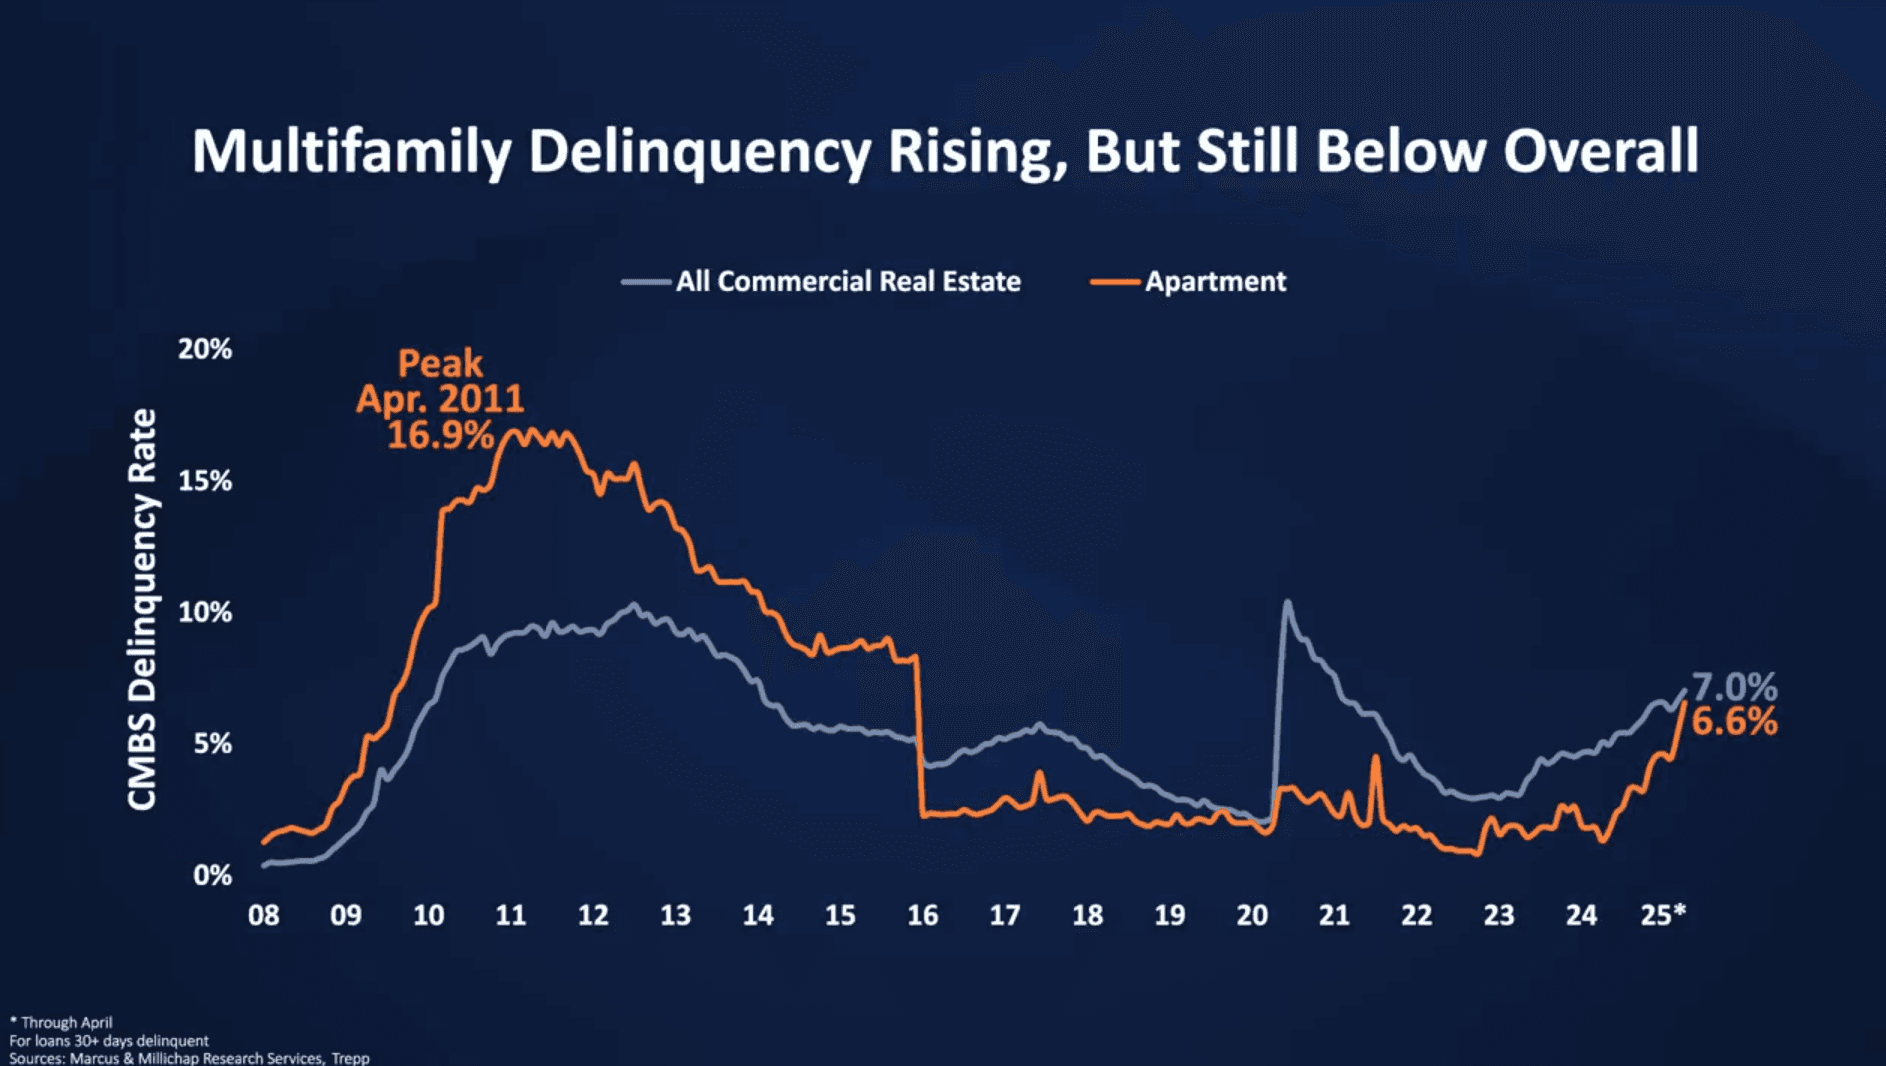
Multifamily Sector: Where Pressure Is Building
The multifamily delinquency rate has reached 6.6% in 2025—up significantly, but still far from the 16.9% seen in 2010–2011. The pressure is localized:
Sunbelt metros like Dallas, Phoenix, and Florida
Properties acquired at peak pricing with low-interest debt
Inexperienced operators now facing loan maturity
Chang notes, “This isn’t widespread failure. It’s a matter of misaligned projections and tighter lending.”
Lenders Shift Gears: Less Forgiveness, More Action
For years, lenders extended terms or deferred payments. In 2025, that flexibility is gone:
Loans must be refinanced or sold
Notes are changing hands
Foreclosure starts are ticking up
Distress is entering the market slowly—but firmly.
Sector Snapshots: Comparing 2025 CRE Delinquency
Office: Still Volatile
10.3% delinquency. Tenant downsizing and hybrid work persist.
Industrial: Strong and Steady
0.5% delinquency. Demand remains robust across logistics and warehouse properties.
Retail: Mixed Outlook
7.1% delinquency. Results vary by submarket and tenant strength.
Lodging: Gradual Rebound
7.9% delinquency. Some assets remain distressed due to slower recovery and rising costs.
Multifamily: Watch the Sunbelt
6.6% delinquency. Still manageable, but the Sunbelt faces investor retrenchment.
Investor Psychology: Headlines vs. Reality
Distress doesn’t mean discounts. Many troubled properties require capital, repositioning, or involve legal headaches. “Extend and pretend” is fading, but buyers must remain cautious.
The hype? Overstated. The opportunity? Real—but complicated.
Conclusion: Context is Everything in 2025
Commercial real estate distress 2025 is a market reality—but not a repeat of 2008. Each sector is reacting differently, and smart investors are responding accordingly. The fundamentals remain strong where underwriting was sound.
“Distress isn’t a wave sweeping across the industry—it’s a trickle, highly localized and sector-specific.” — John Chang
Source: https://www.linkedin.com/feed/update/urn:li:activity:7330275843224625152/
https://creconsult.net/commercial-real-estate-distress-2025/?fsp_sid=902
Friday, May 16, 2025
New Listing: Fully Leased Chicago Retail with Value-Add Upside
3217–3229 W Montrose Ave | Albany Park, Chicago
Offered at $995,000 | ±4,000 SF
Fully leased six-unit ground-floor retail property featuring a mix of service, food, and professional tenants. Flexible MTM and short-term leases provide near-term repositioning potential. Current rents average ~$20/SF, with market rates estimated at ~$28/SF MG—offering clear value-add upside. Located on high-traffic Montrose Avenue with 21,000+ vehicles per day, strong CTA access, and a low 3.1% submarket retail vacancy.
View the full listing:
https://creconsult.net/chicago-multifamily-listings/montrose-retail-strip/
Contact:
Randolph Taylor, CCIM
Vice President | eXp Commercial
rtaylor@creconsult.net
630.474.6441
www.creconsult.net
#ChicagoRetail #CommercialRealEstate #AlbanyPark #RetailInvestment #eXpCommercial #CRE #ValueAdd #MontroseAve #RealEstateInvestment
Thursday, May 15, 2025
CALL FOR OFFERS: Friday May 30th
Multifamily Redevelopment Opportunity – 100 W Roosevelt Rd, Wheaton, IL
An exceptional opportunity to reposition two existing office buildings into a 22-unit multifamily community in one of Wheaton's most desirable corridors. Approved zoning and redevelopment plans are in place, supported by strong apartment demand and excellent site visibility along Roosevelt Road.
Key Highlights:
Approved for 22 multifamily rental units
R5 Residential Zoning | Approved PUD
1.51 Acres | 23,864 SF Total
Surface parking with 38 spaces
High-visibility location near downtown Wheaton
Offered at $1,650,000 with a projected valuation of $4,950,000 and an estimated 8.8% cap rate based on stabilized pro forma.
Learn more and view the full Offering Memorandum:
https://creconsult.net/park-place-wheaton-redevelopment/
For more information, contact:
Randolph Taylor, CCIM
Vice President | Investment Sales Broker
eXp Commercial – Chicago
Email: rtaylor@creconsult.net
Phone: 630-474-6441
Website: https://creconsult.net
#MultifamilyRedevelopment #WheatonIL #CRE #InvestmentOpportunity #ApartmentDevelopment #RealEstateInvestment
Multifamily Redevelopment Opportunity – 100 W Roosevelt Rd, Wheaton, IL
An exceptional opportunity to reposition two existing office buildings into a 22-unit multifamily community in one of Wheaton's most desirable corridors. Approved zoning and redevelopment plans are in place, supported by strong apartment demand and excellent site visibility along Roosevelt Road.
Key Highlights:
Approved for 22 multifamily rental units
R5 Residential Zoning | Approved PUD
1.51 Acres | 23,864 SF Total
Surface parking with 38 spaces
High-visibility location near downtown Wheaton
Offered at $1,650,000 with a projected valuation of $4,950,000 and an estimated 8.8% cap rate based on stabilized pro forma.
Learn more and view the full Offering Memorandum:
https://creconsult.net/park-place-wheaton-redevelopment/
For more information, contact:
Randolph Taylor, CCIM
Vice President | Investment Sales Broker
eXp Commercial – Chicago
Email: rtaylor@creconsult.net
Phone: 630-474-6441
Website: https://creconsult.net
#MultifamilyRedevelopment #WheatonIL #CRE #InvestmentOpportunity #ApartmentDevelopment #RealEstateInvestment
Subscribe to:
Posts (Atom)
-
Just Listed: Golf Sumac Medical Offices | Des Plaines IL Price: $3,900,000 SF: 35,245 Stories: 3 Occupancy: 82.3% Cap Rate: 9.63% * Stabiliz...
-
🏢 Two Adjacent Turnkey Office Buildings For Sale – Joliet, IL 🏢 Located just off Larkin Ave and adjacent to Ascension St. Joseph Medical C...
-
Introduction The Kane County multifamily market in Q3 2024 offers solid opportunities for investors and property owners. As one of the most...

