Thursday, August 31, 2023

What is a Rent Roll?


When real estate investors are evaluating a potential rental property purchase or a bank is underwriting a potential loan, one of the first documents that they will ask for is the property’s “rent roll” or “rent roll report.”

In this article, the rent roll document is described in detail and its utility in the CRE due diligence process is highlighted.  Let’s start with a simple definition.

What is a Rent Roll?

A rent roll is an important document that lists all the tenants in the property.  In real estate investing, it is an indispensable part of the due diligence process, and it is typically provided by the current owner or property management company.  The format of the rent roll can vary – sometimes it is an Excel file, other times it is a printed report – but they all contain the same general information:

  • Tenant Name:  The name of the current tenant occupying a particular space in the property.  If the space is unoccupied at the time the rent roll is produced, the tenant name could be “vacant.”
  • Unit Number:  The number of the suite or unit occupied by the tenant.
  • Unit Size:  The number of square feet (or square meters) occupied by the tenant.  For example, a tenant may occupy 1,000 square feet of space.  This number is particularly significant because rent is often charged – and rent payments are calculated – on a per square foot basis.
  • Percent of Net Rentable Square Footage:  Based on the tenant’s unit size, this is a calculated value that represents the percent of total square footage occupied by the tenant.  For example, if a tenant occupies 1,000 square feet in a 10,000 square foot building, they occupy 10% of the net rentable square footage.
  • Rental Rate:  The rental amount paid by the tenant.  Typically, there are two columns for this information.  The first is typically expressed as a value per square foot annually and the second is the total gross monthly rent amount, which is a value calculated by multiplying the total SF leased by the gross rent PSF.
  • Annual Rent:  A calculated value that represents the total annual rent for the space.  It is obtained by multiplying the monthly rent by 12.  For example, if the rent for a space is $1,000 per month, the total annual rent is $12,000.
  • Lease Start Date:  The date that the lease became effective.
  • Lease End Date:  The date that the lease expires.
  • Lease Term:  A calculated value that represents the total term of the lease.  It is typically expressed in months.
  • Security Deposit:  Some rent rolls, especially those for multifamily properties, may contain a section on the amount of security deposit that is currently being held for the tenant.

A rent roll is typically stored in a spreadsheet, so each of the above elements represents a column.  It could look something like this (again, the actual format can vary greatly from one rent roll to the next):

Why the Rent Roll Is Important

There is no question about the importance of the rent roll, but its utility varies based on the perspective of the individual viewing it.  For an investor, analyzing it is a critical part of the pre-purchase due diligence process.  For a banker or lender, it is a critical part of the loan underwriting process.  In either case, there are several key insights that can be obtained from a rent roll:

  • Property Income:  The sum of annual rents for all tenants provides an indication of the total annual income for the property.  For example, if there are 3 tenants whose annual rent is $10,000 each, the property’s total income is $30,000.  This is a useful starting point for calculating the property’s net operating income, or net cash flow after operating expenses.
  • Tenant Concentrations:  In commercial properties with multiple tenants, it is common for there to be one or more “anchor” tenants who lease most of the space in the property.  For example, in a grocery store anchored retail shopping center, the grocery store leases the bulk of the square footage in the property and is supported by several other smaller tenants.  The grocery store’s lease creates a “concentration” of space in the hands of one tenant and raises the risk profile of the property.  If an anchor tenant decides not to renew their lease, it could be difficult to fill and could cause a drastic reduction in income for the property.
  • Expiration Concentrations:  If leases for multiple tenants expire on or around the same date, this represents a potential risk that investors and lenders would want to be aware of. In a worst-case scenario, none of the tenants renew their leases, which results in a drastic reduction in property income until the space is re-leased.  Less rental income equals lower net operating income and a lower valuation.
  • Tenant Roster:  Who the tenants are has a major impact on the risk profile of the property.  For example, a rent roll filled with unknown local businesses represents more risk than a rent roll filled with nationally recognized companies who are known to be financially strong.  For this reason, bankers and investors like to review the names of each tenant and use them to research their financial condition.
  • Lease Lengths:  The length of each lease is important because it allows the banker and lender to forecast how long the stream of income produced by the lease will last.  Rent rolls with tenants on long-term leases are preferred to those who have shorter term leases.  In reality, most rent rolls tend to contain a mix of long and short-term leases.
  • Comparable Properties:  From an investor standpoint, a rent roll can be particularly useful as a tool to compare market rates from one property to another.  For example, suppose the target property has average rental rates of $15 PSF, but similar properties in the same market are leasing for $18 PSF. In this case, it could be a sign that there is room to raise rents, which is a positive for investors.
  • Vacancy/Occupancy:  A rent roll helps investors to determine the total number of rental units occupied versus the total available to rent.  A high vacancy number raises the risk profile of the property, unless there is a valid reason or pending leases for new tenants.
  • Due Diligence:  Finally, the rent roll can be a useful tool for pre-purchase due diligence for real estate investments.  Commercial property owners, especially smaller ones, are notorious for keeping poor records.  So, the rent roll can be used as a tool to evaluate the accuracy of reported income.  For example, if the sum of total rental income on the rent roll is $50,000 annually, but the income statement reports $75,000, this can be a sign that one of the two documents is not accurate.

Although it may seem like a humble spreadsheet document, the points above support the idea that a rent roll is a critical tool that can be used to understand the health of a property.

Summary & Conclusions

A rent roll is a document that provides key information about the tenants that occupy a commercial rental property.  Its format can vary by property owner or property type, and it is typically provided by the existing property manager as part of the pre-purchase and pre-loan due diligence process.

Despite potential differences in format, all rent rolls contain the same basic data points including things like tenant name, SF leased, rental rate, lease start date, lease end date, and the unit number.

Analysis of the rent roll can provide key information like tenant concentrations, property vacancy, potential rental income, and how the lease rental rate compares to the market rent for comparable properties in the same market.


Source: What is a Rent Roll?

https://www.creconsult.net/market-trends/what-is-a-rent-roll/
Wednesday, August 30, 2023

Three Types of Commercial Real Estate Obsolescence

One of the unique challenges of commercial real estate investment is that markets, types of property, return expectations, and physical environments are in a constant state of change.  As a result of these changes, a commercial property could be cash flow positive one day and undesirable the next due to shifts in tenant desires or some other factor.

The real estate term for this type of risk is “obsolescence” and there are three types that CRE investors should be aware of.

Functional Obsolescence

Functional Obsolescence is the impairment of a real property’s functional capacity due to changes in market tastes and/or standards.  In other words, a property could become functionally obsolete when its design, style, amenities, or technology no longer meet the needs and/or expectations of modern tenants.  There are no clearer examples of functional obsolescence than in the realm of technology.  Modern tenants require high speed internet connections, strong cellular reception, advanced security features, and modern audio/video capabilities.  Could you imagine an office building without videoconferencing or high speed internet?  Properties that do not have these features could be well on their way to becoming functionally obsolete.

Depending on the situation, there are two types of functional obsolescence,  “curable” and “incurable.”  If there is curable functional obsolescence, it means that the property could be renovated or upgraded in a cost efficient manner to bring the property up to modern standards.  For example, it is possible to retrofit a property with high speed wireless internet or badge scanners for increased security.  If there is incurable functional obsolescence, it means that the property cannot be upgraded or that it is not economically feasible to do so.  For example, it would be nearly impossible to retrofit an older 10-story building with a modern elevator system.

It should be noted that there is a subset of functional obsolescence known as “superadequacy.”  It may seem counterintuitive, but it is possible to improve a property too much and that is where the concept of superadequacy comes into play.  For example, if a multifamily developer purchased a property and renovated it with luxury finishes in a market that cannot support them, the property could be considered “superadequate.”

Economic Obsolescence

Economic obsolescence – sometimes called external obsolescence – is the depreciation in the market value of a property due to external factors that cannot be controlled by the owner.

Common causes of economic obsolescence are things like: traffic pattern changes, zoning changes, flight pattern changes, construction of public nuisance projects like a jail or sewer treatment plant, rising crime, or job loss.  For example, imagine a successful apartment complex that is located in close proximity to a major airport.  The property is full, cash flow positive, and residents like to live there due to its proximity to the airport.  But, one day the FAA decides to change the approach path to the airport.  The new pattern brings aircraft directly over the apartment complex at a low altitude at all hours of the day and night.

The property owner had no input on the change, but they will likely suffer the consequences of it in two ways.  First, tenants are likely to leave, causing increased vacancy in the property.  Second, the increased vacancy will require rents to come down to a point where they are perceived to be a good deal, despite the aircraft noise.  Combined, these economic factors can create a shortfall in operating income and drive the property value lower, perhaps to a point where it is considered economically obsolete.

Unfortunately, economic obsolescence is incurable in most cases.  In the example above, there is little, if anything the property owner could do to get the flight path changed other than to log their complaint with local authorities.  In many cases, they may have to sell the property at a loss or find other ways to deal with the erosion of value.

Physical Obsolescence

Physical obsolescence is the decline in a property’s valuation due to physical depreciation or gross mismanagement.  It is a given that there will be physical deterioration in all real estate assets over time, but it can be managed with a proactive maintenance and replacement program.  True physical obsolescence happens when maintenance requirements are ignored and the property physically degrades to a point where it has no desirability.  For example, suppose that a property owner never changes the air filters in the HVAC system.  Over time, this allows for the growth of mold and mildew throughout the property to the point that it isn’t safe for occupancy.  This would have a negative effect on the value of the property and would likely result in decreased occupancy, decreased economic life, operating losses, and potential capital losses.

The question of whether or not physical obsolescence is curable is a function of the replacement cost to fix it.  If the pricing is such that it is either cost prohibitive or the cost can’t be recovered through improved occupancy or higher rents, it is likely incurable.  However, if the cost is relatively minor, it could be cured with ease.

Summary and Conclusions

From an investment standpoint, the threat of obsolescence is that it happens quickly and the property owner never sees it coming.  For this reason, it is important to consider each of the above types prior to purchasing a property.

The first line of defense for recognizing obsolescence is the real estate appraisal.  Appraisers/assessors are trained to look for it in the subject property, to quantify the cost of fixing it (if possible), and to summarize the obsolescence results in their lenders reports.  If it exists, it is up to the property owner/investor to assess the cost of repair/renovation versus the benefits that they will receive from it.  Quantifying this cost/benefit metric can be tricky because it is dependent upon certain locational characteristics of the property, its capitalization, operating costs, effective age, and the useful life of potential upgrades.  There is no “right” way to do it because it varies widely from one property to another, but looking at the cost for comparable properties may be helpful.

The more important point is that all types of obsolescence be considered prior to purchasing a property and a plan to address them if/when they arise should be developed.


Source: Three Types of Commercial Real Estate Obsolescence

https://www.creconsult.net/market-trends/three-types-of-commercial-real-estate-obsolescence/

Tuesday, August 29, 2023

Mason Square

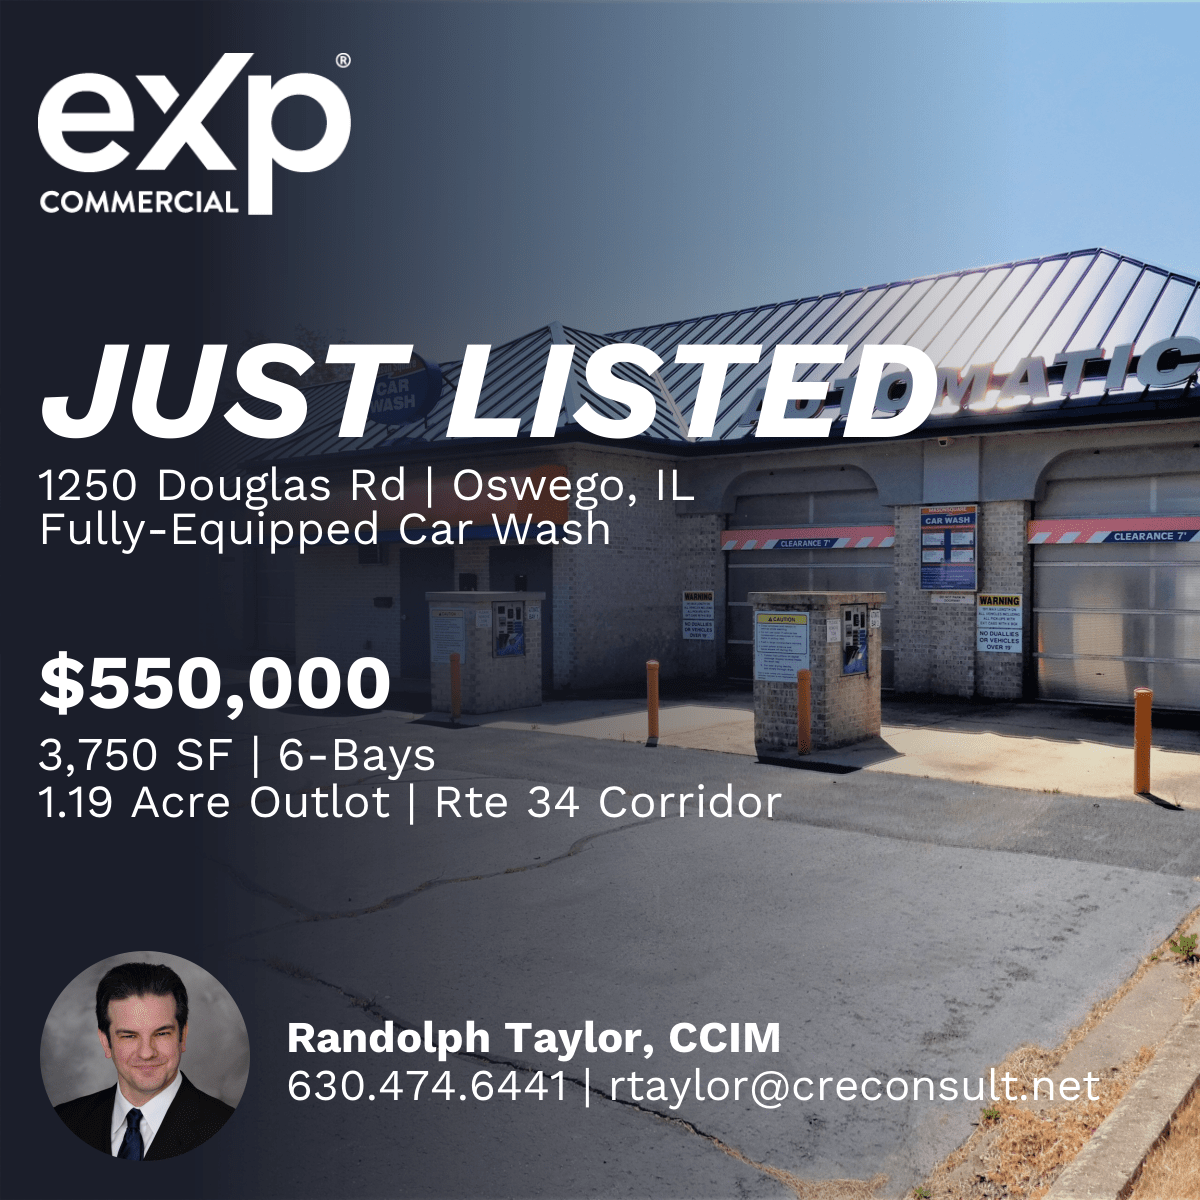
Fully Equipped Car Wash For Sale
1250 Douglas Rd. | Oswego, IL | 3,750 SF | 6 Bays | 1.19 Acres
Mason Square Car Wash, a fully equipped and operational 6-bay carwash in southwest suburban Chicago’s Oswego, IL. Ideally located on an out-lot of the Mason Square Shopping Center along heavily trafficked Route 34, averaging 45,000 vehicles per day,
Listing Agent: Randolph Taylor 630.474.6441 | rtaylor@creconsult.net
https://www.creconsult.net/fully-equipped-car-wash-oswego-il-route-34/

Eleven Types of Risk in Commercial Real Estate

Every investment involves a certain amount of risk. There are certain general sources of risk that influence all assets – things like geopolitical risk and global macroeconomic risk. What makes each asset unique is the level of sensitivity that its rate of return has to those risks. In addition, specific types of assets have risks that are uniquely their own. In this article, we’ll look at eleven types of risk in commercial real estate investment.

Credit/Default Risk

Credit risk, or default risk, is the risk that someone will not be able to meet a financial obligation. Lenders face default risk that a borrower will not be able to make a monthly loan payment on time. Similarly, leased property includes a risk that tenants will not be able to make timely lease payments as expected. Late payments can create cash flow problems for the property owner, but the situation can be worse if the tenant goes out of business and moves out of the space. Then, the property owner faces an unexpected shortfall in lease income along with additional costs to get a new tenant in the space.

Inflation Risk

Inflation is the general increase in prices and decrease in purchasing power that happens over time. In the United States, the inflation rate has been around 2% per year since the year 2000. So, planning for 2% inflation each year would be a reasonable estimate in this market. Property owners, therefore, can set lease rates that allow for this 2% annual growth in overall market prices. Inflation risk, however, is the risk that this expectation is wrong. What if a tenant just signed a 10-year lease with an expectation of 2% inflation, but one year into that lease inflation goes up to 12% annually? The tenant ended up with a pretty great deal, but the property owner may not be able to keep up with the rising cost of operating expenses if inflation rates are this much higher than expected.

Macroeconomic Risk

Macroeconomic risk refers to how broad, national level economic activity impacts property cash flows and valuation. For example, during a period of high growth in GDP, most businesses have ample cash on hand and low unemployment. Property owners can increase rental rates and expect low vacancy rates and collection loss. These factors also cause property valuation to increase. On the other hand, businesses may struggle to stay in business during a recession, and unemployment rates increase. Property owners may have a more difficult time collecting rent on time from tenants, and in the worst case have tenants go out of business entirely. Vacancy rates increase, and finding a new tenant is challenging. These factors all result in lower property valuations.

Interest Rate Risk

The type of interest rate risk that most people worry about is the risk of increasing interest rates. Borrowers holding a mortgage with a floating interest rate are negatively impacted by rising interest rates. As interest rates increase, so do the monthly mortgage payments. Borrowers could also be negatively impacted by higher rates when refinancing debt at the end of a loan term.

Rising interest rates also impact the net present value of investment cash flows. When market interest rates increase, the required rate of return or discount rate also increases. This change causes the present value of future cash flows to decrease. In some cases, this can result in the cash flows no longer creating an acceptable return for an investor.

Liquidity Risk

Real estate is a highly illiquid asset. A liquid asset is one that can be sold immediately at market value. If an owner had to sell a piece of real estate by the end of the day, chances are that it would be for a price far below market value. So, real estate is illiquid compared to most other types of assets. The degree of illiquidity varies according to location, property type, and market cycle.

Legislative/Regulatory Risk

Legislative or regulatory risk refers to any change in regulations or law that can impact real estate owners or tenants. These changes may take place at the local level or the national level. These may include direct risks such as zoning changes, building codes, or access to public goods and utilities. More indirect risks could be changes to local or federal tax rates, mortgage deductibility requirements, banking regulations, etc.

Increases in tax rates not only impact the property owner’s taxable income but also cash flow of the tenants. Additional limitations on mortgage deductions on federal taxes reduce the property owner’s after-tax income and the overall rate of return on the investment. Changes to bank regulations could influence the cost of borrowing and ease of obtaining financing for a property owner. Even if changes to laws and regulations do not directly impact real estate, they may indirectly impact property investment through financing or business cash flows.

Location Risk

Real estate investment ultimately depends on having the right type of property in the right location. Cities, however, act as dynamic and evolving organisms. What is a prime location for office and retail space today may be empty 20 years from now. Location risk comes from the external environment and the contribution that the neighborhood makes to a property’s value. Changes in city growth or transportation patterns or reductions in public goods and services can all negatively impact the desirability and value of a particular property.

Space Market Risk

Property owners purchase real estate with a specific expectation about market rental rates and the demand for space over the investment holding period. Space market risk refers to the probability that those expectations are incorrect. As an example, consider the potential impact of a global pandemic on long-term corporate behavior with respect to remote working. If corporations suddenly start allowing a large percentage of workers to engage in remote working contracts, the market demand for office space will dramatically decrease from previous forecasts. This unexpected change in demand conditions is space market risk and uniquely impacts real estate assets.

Construction Risk

Any time a property undergoes construction, there is an additional source of risk to the property owner. Construction risk applies whether there is a new development or a significant renovation. The construction project may take longer than expected and delay expected rental income, cost more than the budget estimate, or expose previously unknown defects in the property that require additional time and expense to remedy. All of these scenarios result in a reduction in expected cash flow for the property owner.

Environmental Risk

Environmental risk can come from land use regulations and environmental protection concerns. It can also come from the environmental conditions of a property. The first type of environmental risk can be hard to anticipate and to mitigate. The second type of environmental risk may be limited with a thorough inspection of the property and all historical records about the prior use of the land. Specific environmental risks vary a bit with the region but may include problems such as asbestos and lead-based paints, radon or other hazardous chemicals, groundwater or soil contamination, wetlands, and protected wildlife. Environmental mitigation can be extremely expensive, so property owners should take the time to do their due diligence about potential sources of problems.

Even the nicest property in the best location can be an unprofitable investment without the right management. Property managers establish relationships with tenants and make decisions about lease rates and concessions as well as the operating budget. Poor management can result in high vacancy rates, below market rental income, and high operating expenses. All of these factors reduce the property income for the owner and the return on investment. Thus, knowledgeable and competent property management is essential to success in real estate investment.

Conclusion

Investment commercial real estate has many risks that must be weighed against potential returns. In this article we discussed eleven types of risk in commercial property. These include credit/default risk, inflation risk, macroeconomic risk, interest rate risk, liquidity risk, legislative/regulatory risk, location risk, space market risk, construction risk, environmental risk, and management risk.


Source: Eleven Types of Risk in Commercial Real Estate

https://www.creconsult.net/market-trends/eleven-types-of-risk-in-commercial-real-estate/

Partners

eXp Commercial Partners provide our clients with the best-in-class services needed to complete a streamlined, cost-effective, successful commercial real estate transaction and assist you throughout the ownership cycle, including Capital Markets, 1031 Exchange Intermediary, Cost Segregation, Property Tax and Title Services
https://www.creconsult.net/partners/

Monday, August 28, 2023

Off-Market Multifamily Sellers Are Leaving A Ton Of Money On The Table

Off-Market Multifamily Sellers Are Leaving A Ton Of Money On The Table

Marketing a property can increase the sale price by up to 23%, which runs counter to the idea that off-market deals can achieve higher values because a buyer will be more aggressive to seal a trade.

The perception is when a seller has one buyer vying for an asset, that buyer is more aggressive and willing to pay a premium because they don’t want the seller to get into a bidding war for the property. Our research found the opposite.

This is a sign it is in the best interests of owners to undergo a marketing campaign for their properties. Growing allocations from institutional investors toward real estate are still driving a sizable pool of investors into bidding for multifamily assets, and a full campaign is what drives the premiums.

The job of a broker to create a competitive environment on behalf of the seller. Putting a building on the market determines the strongest buyer.

That may not be necessarily based on price alone. If one buyer has a higher-priced offer but weak financial backing, versus a buyer with a stronger track record, taking a lower offer is the way to go. It’s our job to give the seller those options and we do that by marketing properties and generating the highest number of qualified offers possible.

There are numerous case studies where a seller received an off-market bid, put it on the market, and the off-market buyer still bought the asset but at a higher price.


Have you thought of selling your property and would like to know what it's worth? Request a valuation for your property below:

Request Valuation

eXp Commercial Chicago Multifamily Brokerage focuses on listing and selling multifamily properties throughout the Chicago Area and Suburbs.

We don’t just market properties; we make a market for each property we represent. Each offering is thoroughly underwritten, aggressively priced, and accompanied by loan quotes to expedite the sales process. We leverage our broad national marketing platform syndicating to the top CRE Listing Sites for maximum exposure combined with an orchestrated competitive bidding process that yields higher sales prices for your property.


https://www.creconsult.net/market-trends/off-market-multifamily-sellers-are-leaving-a-ton-of-money-on-the-table/

How The Loss to Lease Calculation Works

Loss to lease is a commonly used calculation in a commercial real estate analysis. However, loss to lease can also be one of the most confusing calculations to understand, especially when you see it for the first time. In this article, we’ll take a closer look at the loss to lease calculations and walk through several examples to help you understand what it is and how it works.

Loss to Lease Defined

Loss to Lease is defined as the difference between a property or unit’s market lease rate and the actual lease rate.  For example, if the market rental rate is $1,000 per month and the actual lease rate is $900 per month, then loss to lease is calculated as the difference between market rent and actual in place rent, which is $100 per month.  When market rent is higher than actual in place rent, then there is a loss to lease. When market rent is lower than actual in-place rent, then this is sometimes called a gain to lease.

The “loss” isn’t realized in the sense that the property owner is required to pay the difference. It’s more of an “opportunity loss” that can act as a leading indicator of two possible situations.  On the positive side, a loss to lease may indicate that submarket rental rates have grown faster than the individual property, so there may be room to increase rents.  Or, on the negative side, it may be an indicator that something is lacking in an individual property (relative to the market) that prevents it from achieving full market rates.

Loss to Lease: Why it’s Important

Loss to Lease is an important concept to consider under two circumstances:

Acquisition Due Diligence:  Often, when a seller or broker is marketing an income producing property, they’ll include two income figures in the proforma:  (1) In-place rents; and (2) Market rents.  If there’s a big difference between the two figures, it may indicate an opportunity to raise rents.  Because commercial properties are valued on cash flow, the ability to raise rents is closely correlated to increasing the value of the property, which can bode well for a profitable exit.

Property Performance:  For property owners evaluating the performance of a property they already own, a big difference between market rents and actual rents may be an indicator that there’s an opportunity to manage the property more efficiently by negotiating higher rents when leases come up for renewal.  Or, it may indicate that there’s something holding the property back from achieving full market rents.  In such cases, improvements or renovations may be required to bring the property condition, finishes, and amenities up to market standards to justify market rents.

It’s important to note that rent increases don’t happen all at once. Leases expire at different times throughout the year, and long-term leases may not expire for multiple years. So, the opportunity to close the gap between market and actual rents occurs slowly over time.  To illustrate this point, an example is helpful.

Loss to Lease Example

Assume that a multifamily property with the following characteristics is being evaluated for acquisition:

  • Units:  50
  • Avg. In Place Rent:  $800 per unit
  • Avg. Market Rent:  $1,000 per unit

Based on these characteristics, the following income figures can be imputed:

The Gross Potential Rent at the existing price is $50,000, which is 50 units multiplied by the market rate of $1,000 per month.  At the time of evaluation, this is the maximum rent possible at the market rate.  However, units are currently renting $200 below the market rate, which represents a “loss” on the leases in place.  Multiplying the $200 per unit loss by 50 units results in a “Loss to Lease” of $10,000.

An investor may look at this deal and think that there’s a 20% rental upside, which is an attractive prospect.  But, an investor can’t acquire a property and raise all the rents on day 1.  They’ll need to do it slowly over time as leases come up for renewal.  To illustrate the effect of this, assume that the investor can “turn” 10 units a year to the market rate.  Over 5 years, the income may look something like this:

Assuming that market rent stays the same over the 5-year period, “turning” 10 units a year reduces loss to lease by $2,000 annually.  Taking the example one step further and building out the remainder of the proforma, assume that expenses for the property and cap rates remain the same over the 5 years:

By assuming that expenses and cap rates remain the same over the 5 ye5-yearar holding period, it can be seen that the value of the property rises solely because reducing loss to lease results in higher NOI, and therefore a higher property value.

Loss to Lease: Raising Rents

In theory, the idea that rents can be raised to be commensurate with the market is simple.  In practice, it isn’t always as easy, and it’s not without risk.  Every time an owner goes to raise the rent, they run the risk that they’ll raise it beyond the tenant’s ability to afford it or beyond their perceived value of the unit, causing them not to renew the lease.

In such cases, the owner now has to deal with a vacant unit that isn’t producing any income, which nullifies the entire premise that a high Loss to Lease presents an opportunity for an investor.  It’s important to consider the balance between raising rents to improve profitability and not driving away tenants with higher prices.

Summary and Conclusions

In this article, we discussed loss to lease in commercial real estate. We defined loss to lease, explained why it is important, and then walked through an example where loss to lease was reduced slowly while expenses and the cap rate remained unchanged. This showed how reducing loss to lease over time can increase the value of a property.

Granted, it’s unrealistic to expect market rents, expenses, and cap rates to remain unchanged over a 5-year span, but this article demonstrates there’s always going to be a difference between market rents and actual rents and the term for this difference is known as loss to lease.

While loss to lease isn’t a complicated calculation, creating an apples to apples comparison to determine true market rents requires detailed analysis to ensure that the properties surveyed are similar to the subject in location, finish, and amenities.

A large loss to lease is an indicator of potential mismanagement and an opportunity to raise rents and therefore raise the value of the property.  However, rents usually can’t be raised quickly, simply, and to 100% of the market value.  Raising rents too high can cause a tenant to not renew their lease, creating a vacancy that the owner may or may not be able to quickly re-lease at the market rate.


Source: How The Loss to Lease Calculation Works

https://www.creconsult.net/market-trends/how-the-loss-to-lease-calculation-works/

Sunday, August 27, 2023

The Income Approach to Real Estate Valuation

The income approach is one of three techniques commercial real estate appraisers use to value real estate. Compared to the other two techniques (the sales comparison approach and the cost approach), the income approach is more complicated, and therefore it is often confusing for many commercial real estate professionals. In this article, we’ll walk through the income approach to property valuation step by step, including several income approach examples.

What is the Income Approach to Valuation?

The income approach is a methodology used by appraisers that estimates the market value of a property based on the income of the property. The income approach is an application of discounted cash flow analysis in finance. With the income approach, a property’s value today is the present value of the future cash flows the owner can expect to receive. Since it relies on receiving rental income, this approach is most common for commercial properties with tenants.

There are two methods for capitalizing future income into a present value: the direct capitalization method and the yield capitalization method. The difference is that the direct capitalization method estimates value using a single year’s income, while the yield capitalization method incorporates income over a multi-year holding period. Let’s take a look at both methods in some more depth.

Income Approach: The Direct Capitalization Method

The direct capitalization method estimates property value using a single year’s income forecast. The income measure can be Potential Gross Income, Effective Gross Income, or Net Operating Income. Direct capitalization requires that there is good, recent sales data from comparable properties. The comparable sales provide the appropriate market multiplier to use with the subject property. You can find the average market multiplier after finding reasonable comparable sales data. The following formulas are three ways to find the market multiplier using different measures of income:

  1. Potential Gross Income Multiplier (PGIM) = sales price / PGI
  2. Effective Gross Income Multiplier (EGIM) = sales price / EGI
  3. Net Income Multiplier (NIM) = sales price / NOI

After finding the market multiplier, multiply the subject property’s forecasted income by the market multiplier. For example, multiplying the market PGIM by the subject property’s forecasted PGI in the next year yields the current subject value estimate. Direct capitalization requires that the income and expense ratios are similar for the comparables and the subject property and that the next year’s income is representative of future years.

Appraisers often use the capitalization rate, rather than income multipliers, to estimate market value using a single year’s income forecast. The capitalization rate is the inverse of the Net Income Multiplier. In other words, it is the ratio of a property’s Net Operating Income to its value.

Income Approach: The Yield Capitalization Method

The yield capitalization method is a more complex approach to valuation. This method uses net operating income estimates for a typical investment holding period. Therefore, the resulting property value accounts for future expected changes in rental rates, vacancy, and operating expenses. Yield capitalization doesn’t require stable and unchanging market conditions over the holding period. The yield capitalization method also includes an estimate of the expected sales price at the end of the holding period. Let’s take a closer look at how the yield capitalization method works.

Components of the Yield Capitalization Method

Using the yield capitalization method, the subject value estimate is the present value of the future expected cash flows. The present value formula simply sums the future cash flows (P) after discounting them back to the present time. Applying this formula, the cash flows are the proforma estimates of net operating income (P1through Pn), the required rate of return is r, and n is the holding period. Although the formula calculates present value (PV), it should be noted that both Excel and popular financial calculators utilize the net present value (NPV) formula to find the present value of uneven cash flows. This works because you can simply plug in $0 for the initial investment amount, and then the resulting net present value amount will equal the present value.

Here are some more details on the components of the yield capitalization method:

  • Cash Flow Forecasts. Forecasting the cash flows that an income-producing property will generate over the next year is relatively straightforward and accurate. Properties already have tenants with leases in place, and costs should not vary dramatically from their current levels. The more challenge part of cash flow forecasting comes when considering what happens to cash flows over the next couple of years. In addition, any forecasting errors in one year tend to compound themselves in the subsequent years. Holding periods of 5–10 years are the most common, and those estimates require forecasting future market rent, vacancy and collection loss, and operating expenses.
  • Resale Value. Calculations using the income approach assume that the owner sells the subject property at the end of the holding period. Appraisers can estimate resale value using a direct dollar forecast or an average expected annual growth rate in property values. Direct dollar forecasts are not preferred because they don’t directly account for any market expectations. Growth rates consider forecasted market growth rates, but the subject property’s value may grow at a rate that differs from the market average. A third method applies direct capitalization techniques to the end of the holding period. For example, an appraiser considering a five-year holding period would extend the proforma cash flow estimates one additional year. The expected sales price at the end of the fifth year would equal the NOI in the sixth year divided by a market capitalization rate.
  • Discount Rates. In corporate finance, the discount rate in a net present value calculation is usually the firm’s weighted average cost of capital. When valuing an investment, however, the discount rate is usually represented as the required rate of return. Real estate investors may use the required rate of return on their investment properties or the expected rate of return on an equivalent-risk investment.

Income Approach Example Using Direct Capitalization

One of the benefits of direct capitalization is that it provides a way to get a quick valuation estimate. Appraisers can quickly get a market multiplier from recently sold property transactions. Consider two recently sold comparables, one with PGI of $300,000 and a sales price of $2.1 million and another with a PGI of $225,000 and a sales price of $1.8 million. The first yields a PGIM of 7 ($2,100,000/$300,000) while the second yields a PGIM of 8 ($1,800,000/$225,000). So, the market average PGIM of 7.5 can be applied to a subject property’s PGI estimate to provide a quick valuation. If a subject property’s expected PGI next year is $195,000, multiply that by the market PGIM to estimate the subject value.

Subject Value = $195,000 x 7.5 = $1,462,500

Appraisers also use direct capitalization together with residual valuation techniques to find the value of a property when only the value of the land or the value of the improvements is known. The value of the land may be known from a separate analysis using comparable land sales data. From this analysis, suppose the land value is $350,000 with a 9% land capitalization rate. Further, suppose the improvements alone have a 10% capitalization rate.

The portion of the property’s NOI that is generated by the land can be calculated by multiplying the land value and land capitalization rate. The remaining income is attributed to the improvements.

Dividing the return contribution of the improvements by the improvements capitalization rate results in a valuation of $2,185,000 for just the improvements. Adding the land value to the value of the improvements results in a total property value estimate of $2,535,000.

Income Approach Example Using Yield Capitalization

In order to estimate the subject property value using the income approach, the first step is to create a proforma cash flow statement for the anticipated holding period. Using the following market assumptions, let’s estimate the cash flows to the owner over a five-year holding period.

  • The subject property is expected to yield PGI of $200,000 over the next year and currently has a 5% vacancy rate. Operating expenses are currently 45% of EGI, and that is expected to stay the same during the holding period.
  • Market rent is currently increasing at a rate of 3% per year. During the second year, however, it is expected to only grow at a rate of 1% before returning to the current 3% growth rate.
  • The vacancy rate is expected to climb to 7% during the following two years and then return to a stable 5%.
  • The terminal capitalization rate of 9% is estimated from current market cap rates.

This is the proforma cash flow statement under the given market assumptions. The sales price in year 5 is year 6 NOI divided by the capitalization rate.

Now we can compute the present value by discounting the future cash flows back to the present using the investor’s required rate of return of 12%. The cash flows are $104,500 in year 1, $103,323 in year 2, $106,423 in year 3, $111,973 in year 4, and $1,435,241 (the sum of NOI in year 5 and the expected resale value) in year 5. Therefore, the subject value estimate is $1,136,977.

Conclusion

In this article, we discussed the income approach to real estate valuation. We defined the income approach and then explained the two income approach methods appraisers use. First, the direct capitalization method uses a single year’s income to estimate the market value of a property. Second, the yield capitalization method uses a multi-year forecast of cash flows and then discounts these future cash flows back to the present to get a present value for the property. We then walked through an example of both the income approach using the direct capitalization method and another example using the yield capitalization method.


Source: The Income Approach to Real Estate Valuation

https://www.creconsult.net/market-trends/the-income-approach-to-real-estate-valuation/

Saturday, August 26, 2023

Mason Square

Fully Equipped Car Wash For Sale
1250 Douglas Rd. | Oswego, IL | 3,750 SF | 6 Bays | 1.19 Acres
Mason Square Car Wash, a fully equipped and operational 6-bay carwash in southwest suburban Chicago’s Oswego, IL. Ideally located on an out-lot of the Mason Square Shopping Center along heavily trafficked Route 34, averaging 45,000 vehicles per day,
Listing Agent: Randolph Taylor 630.474.6441 | rtaylor@creconsult.net
https://www.creconsult.net/fully-equipped-car-wash-oswego-il-route-34/

How To Determine The Highest and Best Use of a Property

The concept of highest and best use is one of the fundamental principles that underlie real estate appraisal. Highest and best use requires that the appraisal considers not just the current use of the property but also the potential value associated with alternative uses. The Appraisal Institute has four tests that appraisers can use in order to narrow down all of the alternatives to one highest and best use of the property.

Four Tests for Highest and Best Use

You can use the following four tests to find the highest and best use of a site as if vacant or currently improved.

1. Is the use physically possible?

The first test of highest and best use simply evaluates whether it is possible to use the land in a certain way. Ignoring the zoning and economics of the proposal, consider whether or not the potential use is physically possible. That means the topography, soil type and conditions, lot size and shape, surface and subsurface water, and even weather patterns must make the development possible. So, you probably can’t build a marina in the middle of the desert, a heavy, marble building on soft clay soil, or a building with a 250,000 square foot base on a 200,000 square foot lot. In addition, an appraiser must not only consider the proposed use of the site but also the characteristics of the optimum improvements for that use. This first test, however, is usually the easiest to pass.

2. Is the use legally permitted?

After eliminating any potential uses that are not physically possible, you can move on to the second test. Whether a potential use is legally permissible involves a few different legal considerations. The proposed use must be allowed by zoning regulations. If building in a residential area with restrictive covenants, the proposed improvements must not violate any rules. The proposed use must conform to all applicable building codes and height limits. In addition, the improvements must adhere to any restrictions imposed by easements on the property.

Determining whether a proposed use is legally permitted requires research into the local building regulations and restrictions. Gaining a comprehensive understanding of the applicable legal requirements can be time-consuming, but it is fairly easy to determine whether or not a proposal violates any of these regulations. Concluding whether or not something is legally permissible is a straightforward process. Regulations, however, change over time. An area that was zoned for residential development can be changed to commercial development. Just because a proposed development is not legally permissible does not mean that it will always be that way. In these cases, an appraiser must consider the probability of the legal restriction being changed to allow the proposed development. In these cases, there should be substantial documentation suggesting that the regulation will be changed in order to pass to the third test of highest and best use.

3. Would the use be financially feasible?

To address whether a proposed use is financially feasible, you need to conduct a market analysis and develop proforma cash flow estimates. You’ll need to collect data in order to forecast construction and development expenses, operating expenses, rents, absorption rates, vacancy rates, discount rates, cap rates, and residual values. Once you’ve gathered all of this information, you will estimate the proforma net operating income over your expected holding period. Employing discounted cash flow techniques, you can determine which projects meet your particular investment standards. Discounting cash flows by your cost of capital and computing the net present value, a project is considered financially feasible if the NPV is greater than 0. You can also compute the internal rate of return and compare the property’s return to your acceptable hurdle rate for projects. Only the proposed property uses that meet these criteria for being financially feasible move to the next step of the analysis.

4. Would the use be maximally productive?

The prior steps eliminated proposed uses that were not physically possible, legally permissible, or financially feasible. This final step takes all of the proposed uses that meet these requirements and ranks them in order of value or rate of return. While ranking proposed uses, it is also helpful to consider the risk associated with the proposed use. For example, one proposed use might generate a much higher internal rate of return than all of the other proposed uses. Yet, the reason for the high return may be related to the higher risk of that project. One way to adjust for the risk associated with a proposed use is to apply a discount rate that is commensurate with the level of risk while computing the net present value. In the end, the proposed use with the highest internal rate of return and net present value is the maximally productive use.

Applying Highest and Best Use to an Existing Structure

To illustrate how highest and best use works in practice, consider an old 1920s brick building in the central business district of a small city. Business and residents moved away from the area, and its current use as retail space may no longer be the highest and best use of the property. It is a 15,000 square foot building, and its estimated value as vacant land is $10/sqft, or $150,000.

In its current use as retail space, the property generates rent of $12/sqft. Vacancy rates are around 11% since foot traffic generally doesn’t support retail business in the area. Operating costs are $34,000 per year. Since conditions are fairly stable, capitalizing next year’s income at a rate of 9% yields an estimated property value of $1,402,222.

Another alternative would be to renovate the property and convert it into office space. Market research indicates this is a desirable area for professional office such as attorneys, accountants, architects, and designers. Market rent for offices in this area is $21 per square foot and has been increasing by 2% annually. Operating costs average $5/sqft and increase by $0.25 per year. Converting the property into office space will cost $850,000 in the first year, and average vacancy during the year will be 75% due to the time of the renovations. Vacancy is 20% in year 2 and then settles into a constant 5% thereafter. The resale price of $2,629,402 at the end of the 5-year holding period is calculated by dividing year 6 NOI by a 9% cap rate. The net present value of cash flows discounted at a rate of 10% yields a property value of $1,485,848.

Highest and best use analysis evaluates each potential use of the property and its corresponding value. The vacant property is valued at $150,000. Continuing to use the property for retail space yields an estimated value of $1,402,222. Converting the property into office space results in a value of $1,485,848. Highest and best use analysis, therefore, concludes that the best use of the property is as office space

Conclusion

In this article, we discussed the 4 tests for highest and best use. These 4 tests ask if the proposed use is 1) physically possible, 2) legally permitted, 3) financially feasible, and 4) maximally productive. We then walked through an example of how to apply highest and best use theory to evaluate a property with three potential uses: as vacant land, as an existing structure, and as renovated. via bookmarklet


Source: How To Determine The Highest and Best Use of a Property

https://www.creconsult.net/market-trends/how-to-determine-the-highest-and-best-use-of-a-property/

Friday, August 25, 2023

How to Calculate the Cap Rate

The cap rate is an important concept in commercial real estate, and it is widely used. There is often confusion about how to calculate the cap rate using various methods. The purpose of this article is to demonstrate several ways to calculate the cap rate.

How to Calculate the Cap Rate Ratio

Perhaps the simplest place to start is to calculate the actual cap rate ratio. The cap rate ratio is just net operating income (NOI) divided by value, so if we know what a property’s net operating income is, and we also know what a property’s value is, then we can easily calculate the cap rate.

For example, suppose we know that a property has an NOI of $100,000 and a value of $1,000,000. Then we can calculate a cap rate by dividing $100,000 by $1,000,000:

This results in a cap rate of 10%.

How to Calculate the Cap Rate with Sales Comps

Since a property’s value is often what we don’t know, it is common to simply divide our known net operating income by a market-based cap rate. This will tell us what a property’s value is.

Calculating a property’s net operating income is easy enough, but if we don’t know what the market-based cap rate is, then how do we calculate it?

One approach is to find comparable properties that have recently sold. Then we can take those comparable sale prices and calculate a cap rate. For example, suppose we observe the following recent sales of similar properties:

Based on our knowledge of the local market, we might decide to simply average all three of these cap rates to get a market-based cap rate of 8.33%. Now we can use this market-based cap rate to figure out a value for our property. If our property has an NOI of $100,000 then we can find its value like this:

This is the expected market value of our property using the direct capitalization method, based on recent comparable sales we observed in the local market.

How to Calculate the Cap Rate With The Band of Investment Method

Sometimes there aren’t any recent comparable sales to use to calculate a cap rate. One other approach commercial real estate appraisers use is called the band of investment method. This allows us to calculate a cap rate based on market-based loan terms as well as the investor’s required return. Appraiser’s usually find this information by surveying local lenders and investors and asking them what their current requirements are.

For example, suppose we survey local lenders and ask them what their typical loan terms are for a property similar to ours. We find out that we can get a loan at a 75% loan to value ratio, amortized over 20 years, at 6%.

We can now use this loan information to calculate a mortgage constant of 0.085972.

Likewise, suppose we survey local investors and find out that they would on average require an 11% cash on cash rate of return for investing in a property similar to the one we are evaluating.

Now we have all the information we need to estimate a cap rate using the band of investment method. To accomplish this, we simply take a weighted average of the return to the typical lender and the return to the typical investor. In this case, it is (75% * 0.085972) + (25% * 11%), which equals 0.06448 + .02750, or 9.20%. This is our market-based cap rate using the band of investment method.

How to Calculate the Cap Rate Using the Discount Rate

Another way to calculate the cap rate is based on the relationship between the cap rate and the discount rate. When income and value grow at a constant rate, then the discount rate is equal to the cap rate plus the growth rate. This idea comes from the dividend discount model, also known as the Gordon Model, which is used to value a stock.

We can re-arrange this equation to solve for cap rate, which says that the cap rate is equal to the discount rate minus the growth rate:

So, if we know the required rate of return (discount rate) for a property, and we also know the expected growth rate for the property’s NOI, then we can calculate the cap rate. For example, suppose we know the discount rate is 12% and the NOI growth rate is expected to be 3%. This is how we can estimate the cap rate:

The cap rate is calculated as 12% minus 3%, or 9%.

Conclusion

In this article, we discussed several ways to calculate the cap rate. First, we talked about how to calculate the simple capitalization rate ratio when you know both the NOI and the value of a property. Next, we discussed how to estimate the cap rate when you don’t know the value of a property. This can be done by finding cap rates for recent sales of comparable properties.

Sometimes there aren’t any comparable properties to extract a market-based cap rate from. When this happens, commercial real estate appraisers often use the band of investment method to calculate a cap rate. This involved surveying lenders and investors to ultimately calculate a cap rate based on a weighted average of these lender and investor return expectations. Finally, we covered the relationship between the cap rate and the discount rate and walked through an example of how the cap rate can be calculated based on the discount rate and the expected growth rate of net operating income.


Source: How to Calculate the Cap Rate

https://www.creconsult.net/market-trends/how-to-calculate-the-cap-rate/

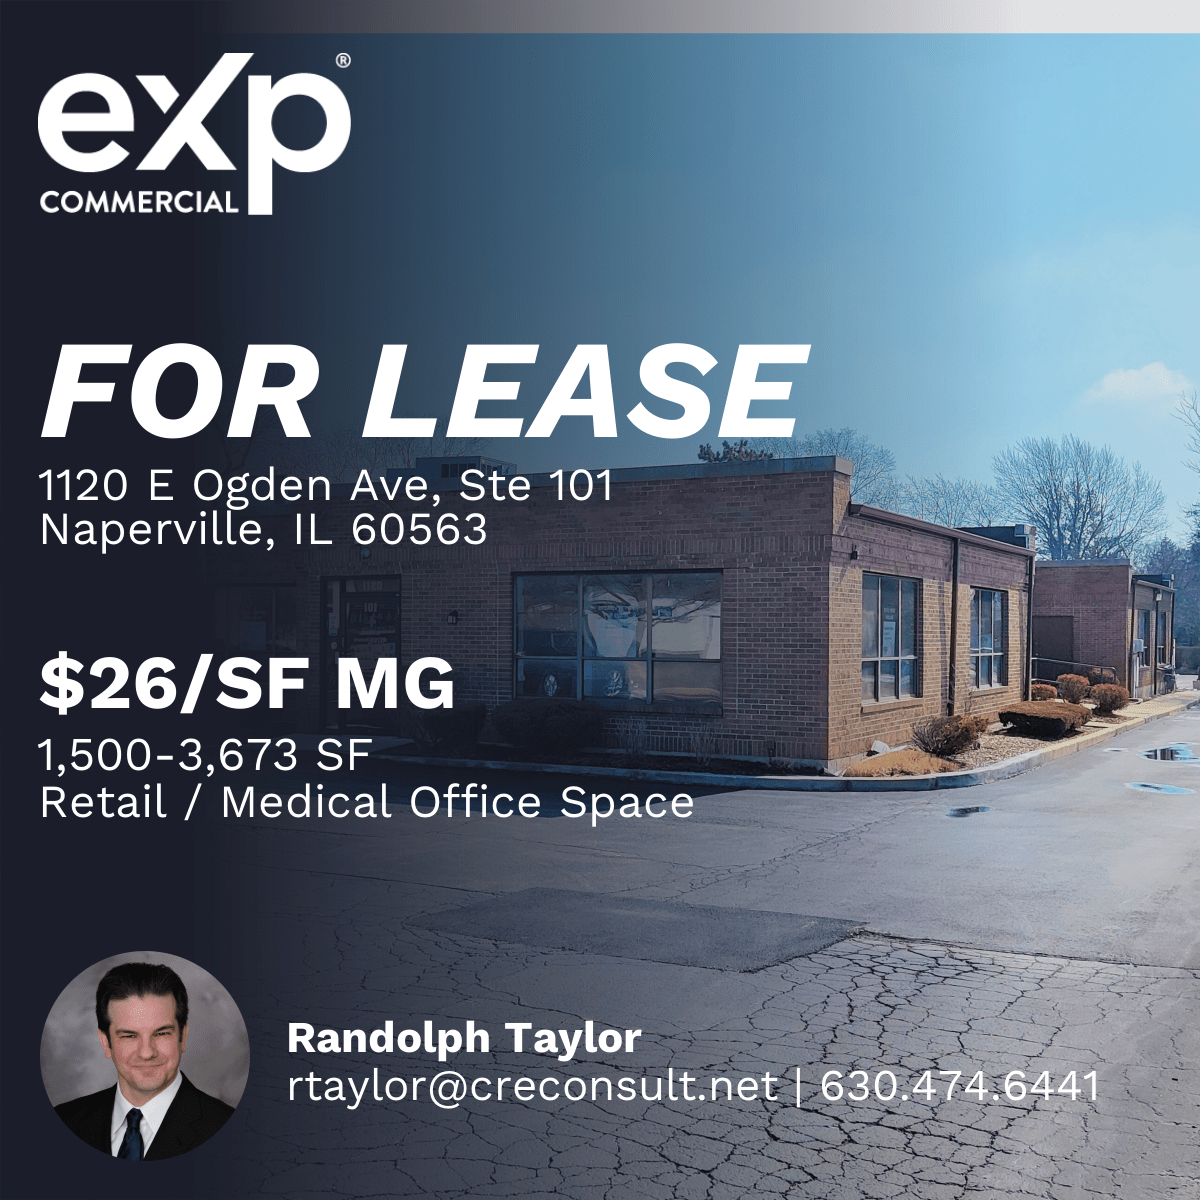
1120 E Ogden

Retail / Medical Office Space for lease in Naperville, IL
1,500–3,673 SF | $26/SF MG
1120 E Ogden Ave., Suite 101, Naperville, IL 60563
Broker: Randolph Taylor, rtaylor@creconsult.net, 630.474.6441

https://www.creconsult.net/retail-office-for-lease-1120-e-ogden-ave-suite-101-naperville-il-60563/

Thursday, August 24, 2023

Multifamily sellers: How to qualify a buyer before going under contract

Multifamily sellers: How to qualify a buyer before going under contract

Multifamily sellers: How to qualify a buyer before going under contract

Don’t waste time and opportunities: learn how to select the right buyer every time

As the seller of a multifamily asset, it’s crucial that the buyer you select is the best possible prospect for your property. Don’t waste time, money, and opportunities: you must ensure they’re qualified and can close and execute the contract as signed.

Keep reading to learn why it’s essential to qualify a buyer before going under contract on your multifamily property and how to do it.

Why do I need to qualify a buyer?

It’s important to close with the first buyer you select. If you don’t, each buyer after that will ask themselves, “What did that other buyer discover about this property that I am missing?”.

When you enter into a contract with a refundable deposit, you’re basically giving your chosen buyer a free option on your property for a period of time, typically 30–60 days. Before you proceed, you must be confident that they can close and execute the contract as signed.

What’s more, your tenants and staff will be disturbed throughout the contract process. To minimize the period of disruption, you should do all you can to ensure the transaction will close successfully at the end of the contract process.

As a seller, you’re required to provide due diligence information to the prospective buyer. When you qualify your buyer, you’ll greatly reduce the risk of wasting a lot of time and doing a lot of work only to not close on the property.

How do I qualify a buyer?

Before you sign the contract, make sure that your prospective buyer can provide certain items. Always ask them for the following:

– Proof of funds

– Lender pre-qualification

– A list of the other properties they own

– A list of the sellers and agents that they have worked with

For added reassurance, it’s recommended that you call the buyer’s lender to confirm their pre-qualified status. You can also call the agents, sellers, and buyers they’ve closed with in the past to enquire about how the transactions went.

Has the buyer toured the property in person before making an offer? Have they reviewed the due diligence information beforehand? If they have, this is a great sign. It’s proof that they have seen and have taken into account any issues with your property, and this greatly reduces the chances that they may later want to back out of the sale, saying they were unaware of the building’s condition. Be very wary of a buyer who doesn’t tour your property in person.

A prospective buyer who shows they’re motivated and wants to move quickly is also a great sign for a successful closing. The shorter the due diligence period, the better, and the larger the deposit, the better.

When you spend the time making sure your prospective buyer fulfills these criteria, you’ll put yourself in a great position to close successfully and ensure a quick and smooth transaction.

If you need help selling your multifamily property, eXp Commercial is here. Our objective as your multifamily advisor is to help you achieve your investment goals: from determining the listing price to selecting the best buyer and handling the sale process through to the closing, we’ll facilitate a smooth transaction for you.


Source: Multifamily sellers: How to qualify a buyer before going under contract

https://www.creconsult.net/market-trends/multifamily-sellers-how-to-qualify-a-buyer-before-going-under-contract/

How to Analyze Supply and Demand For Apartment Buildings

One of the most important ways to use all of the data gathered in a real estate market analysis is to examine the supply and demand factors for a particular type of real estate. For example, an investor considering the construction or purchase of a new multifamily residential property uses the market analysis to determine what cash flows they can expect to receive given the expected demand for units. The demand must be high enough to generate cash flows that provide a rate of return high enough to make the investment feasible.

In order to estimate the demand for multifamily housing units, it is necessary to understand recent population growth trends for the city. Then, it’s important to consider the major industries in the market area and the forecasted growth for those industries over the next few years. You can then put this information together to forecast multifamily housing demand and compare that demand to the existing and proposed supply of multifamily units. This case study takes data about population and industrial activity in the Orlando, Florida region and analyzes supply and demand of multifamily residential units in the region.

Recent data from the U.S. Census Bureau and the Orlando Economic Development Commission lists the total population of the Orlando metro area at 2,387,138 (2016). Between 2015 and 2016, the population of the Orlando metro area grew by 2.6%. That made Orlando the fastest growing region in the United States. The Orlando Economic Development Commission estimates that population growth in the region since 2000 equates to a gain of 138 people per day. Population growth is mostly fueled by domestic migration. Americans moving to Orlando for retirement in warmer weather or for new career opportunities account for about 40% of the population increase. International migration (mainly from Central and South America) accounts for 34% of the increase in population. People have been moving to the Orlando area due to the region’s comparative advantages (climate, entertainment and lifestyle, and economic growth). Without these advantages, Orlando would not be one of the fastest growing regions of the country.

With an average household size around 2.5, that means there are an estimated 954,855 households in the Orlando metropolitan area. Data from the American Consumer Survey indicates that about 43% of the population is renters. So, 43% of households would give an estimated demand of 410,588 multifamily units.  In reality, not all renters live in multifamily units since many rent single-family homes. Therefore, it is necessary to estimate how many of those renters occupy multifamily units.

A 2016 report from Fannie Mae estimated that there were 156,000 multifamily units in the Orlando metro area with a 5.75% vacancy rate. So, in 2016 there were around 147,030 occupied multifamily units (156,000 x (1-.0575) = 147,030). This means an estimated 35.8% of the households that are renters occupy multifamily units while the remaining 64.2% of renters occupy single-family homes.

Employment data from the Bureau of Labor Statistics confirms that economic growth is driving the population growth in the Orlando metro area. In fact, job growth from 2015-2016 in Orlando was over twice the national average. A strong economy and growth in the number of jobs indicates that the population should continue to grow over the next few years unless there is a major shift to the national economy or a natural disaster. Furthermore, the job growth rate of 4.22% exceeded the population growth rate of 2.6%. If the major industries in Orlando continue to grow at this pace, more new workers will need to move into the region to fill these new jobs. So, forecasted population growth may be higher than the average of 2% seen over the past 10 years. It might be more appropriate to estimate population growth of at least 3% annually.

  Area Industry Annual Average Employment Change Employment 2015-2016 Growth Rate
2016 U.S. TOTAL Total, all industries 141,870,066 2,378,367 1.71%
  Orlando-Kissimmee-Sanford, FL MSA Total, all industries 1,157,536 46,844 4.22%
2015 U.S. TOTAL Total, all industries 139,491,699    
  Orlando-Kissimmee-Sanford, FL MSA Total, all industries 1,110,692    

Using a Location Quotient Analysis, Orlando has a competitive advantage in the services, construction, and leisure and hospitality industries. All of these industries should remain strong over the next few years as long as the national economy continues to grow and national unemployment remains low.

Industry Location Quotient
Goods-producing 0.664674599
Natural resources and mining 0.330605357
Construction 1.213038593
Manufacturing 0.41740123
Service-providing 1.143132811
Trade, transportation, and utilities 0.99493952
Information 0.983670576
Financial activities 1.092321103
Professional and business services 1.153196509
Education and health services 0.819187622
Leisure and hospitality 1.952753058
Other services 0.993404995
Unclassified 0.13973717

The economic base analysis of the Orlando metro area showed that the region has an economic base multiplier of around 1.5. This means that if one of these base industries created an additional 100 jobs, the entire region would have a resulting total employment increase of 150 jobs. If only leisure and hospitality, services (providing), and professional and business services all created the same number of jobs the following year, it would cause additional job growth of around 28,000. So, there is the possibility for continued high population growth in the region.

Industry Annual Average Employment Change Employment 2015-2016
Total, all industries 1,042,526 43,773
Goods-producing 113,104 7,874
Natural resources and mining 5,052 -324
Construction 66,175 6,884
Manufacturing 41,878 1,314
Service-providing 929,422 35,899
Trade, transportation, and utilities 219,205 7,049
Information 22,448 -292
Financial activities 70,887 1,340
Professional and business services 188,416 10,818
Education and health services 144,734 5,111
Leisure and hospitality 247,860 9,333
Other services 35,563 2,808
Unclassified 310 -266

Apartment Unit Supply and Demand

The simple analysis presented above estimated that the demand for rental units in 2016 was around 147,030. Consider a situation where the Orlando metropolitan area had a supply of 156,000 multifamily units that year and a vacancy rate of 5.75%. If the population grew by 3% per year and the proportion of renters stayed the same, by 2018 the demand for multifamily units would fill all of the existing supply. So, there is clearly a demand for additional multifamily units. How many new units could the market absorb each year?

No new supply
  2016 2017 2018
Total units 156,000 156,000 156,000
Vacant 8,970 4,559 16
Multifamily Renters 147,030 151,441 155,984

With a population growth of 3% and a similar proportion of apartment renters, that would mean the multifamily renting population in the Orlando metro area would grow by between 4,500 and 5,000 units per year. Real estate developers would need to increase the supply of multifamily units by a minimum of 3,250 per year just to meet the housing demand through 2022. Here’s what the forecasted supply and demand would look like if real estate developers delivered 5,000 new apartment units per year:

5,000 new units annually
  2016 2017 2018 2019 2020 2021 2022
Total units 156,000 161,000 166,000 171,000 176,000 181,000 186,000
Multifamily Renters 147,030 151,441 155,984 160,664 165,484 170,448 175,562
Vacant 8,970 9,559 10,016 10,336 10,516 10,552 10,438
Vacancy rate 5.75% 5.94% 6.03% 6.04% 5.98% 5.83% 5.61%

Conclusion

This example provided a simple method for using data from a real estate market analysis to forecast apartment unit demand. A more in-depth forecast would consider actual growth forecasts in key industries, a more detailed look at actual supply and construction permits for multifamily units in the area, and how changing economic factors could influence the percentage of the population that chooses to rent rather than to buy a home. The results from the final chart considering changes in supply and demand over time can also be extended to consider the growth rate of expected market rents. Although the detailed inputs can become more complicated, the basic framework for analysis is the same.


Source: How to Analyze Supply and Demand For Apartment Buildings

https://www.creconsult.net/market-trends/how-to-analyze-supply-and-demand-for-apartment-buildings/

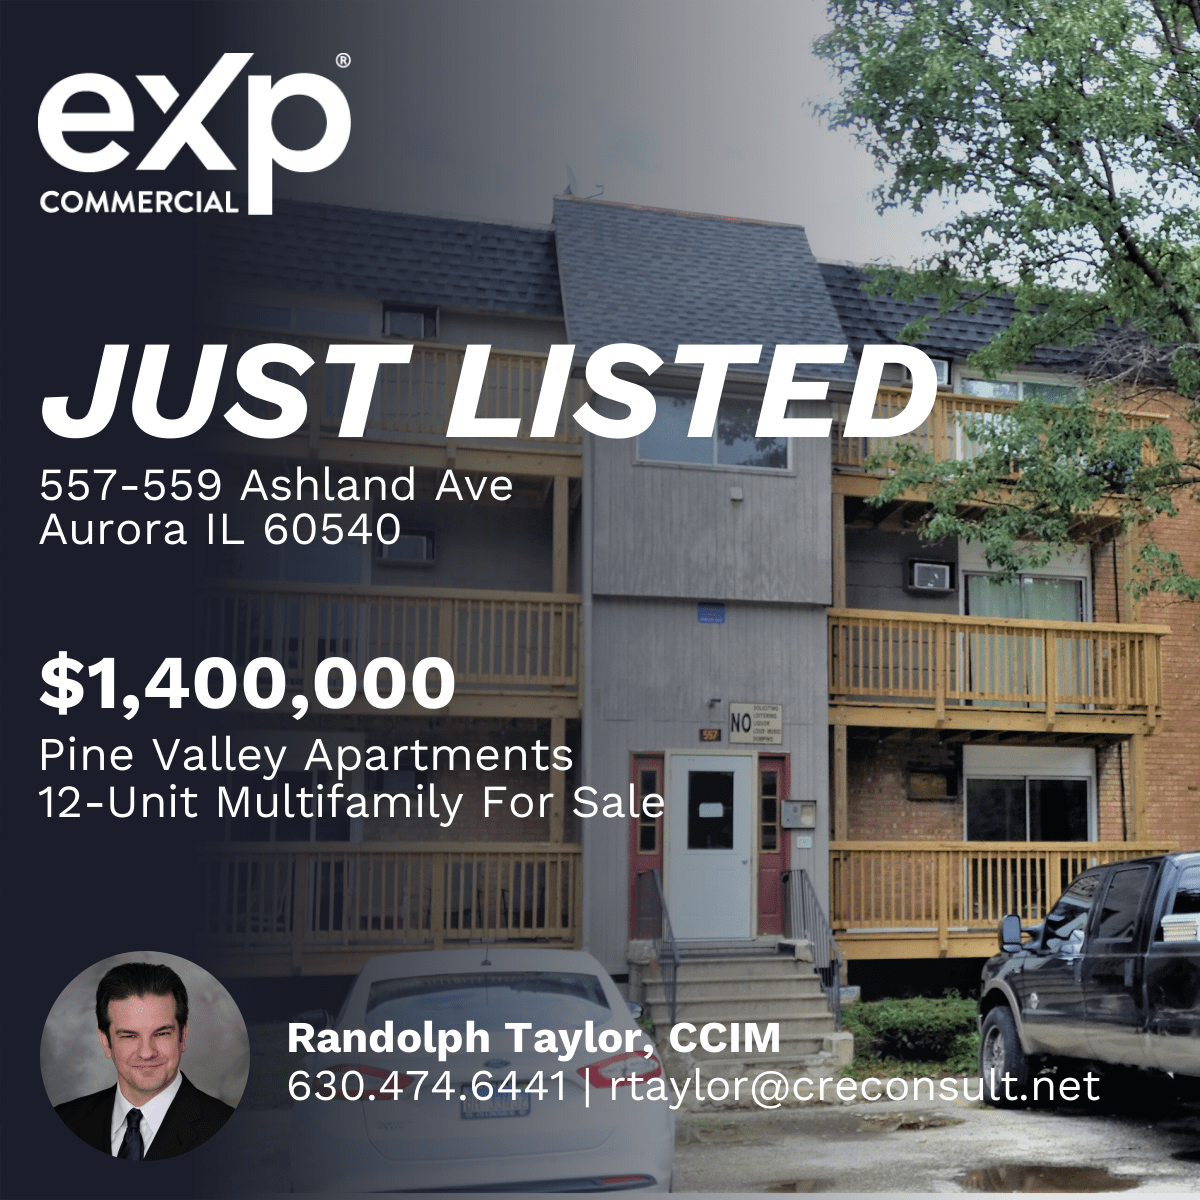
557

Just Listed: 12-Unit Multifamily For Sale
Pine Valley Apartments | Aurora, IL
12-Units | $1.4M | 8.86% Cap Rate (Proforma)
Listing Agent: Randolph Taylor
630.474.6441 | rtaylor@creconsult.net
Listing Site: https://www.creconsult.net/12-unit-multifamily-property-for-sale-aurora-il-pine-valley-apartments/

Wednesday, August 23, 2023

Mason Square

Fully Equipped Car Wash For Sale
1250 Douglas Rd. | Oswego, IL | 3,750 SF | 6 Bays | 1.19 Acres
Mason Square Car Wash, a fully equipped and operational 6-bay carwash in southwest suburban Chicago’s Oswego, IL. Ideally located on an out-lot of the Mason Square Shopping Center along heavily trafficked Route 34, averaging 45,000 vehicles per day,
Listing Agent: Randolph Taylor 630.474.6441 | rtaylor@creconsult.net
https://www.creconsult.net/fully-equipped-car-wash-oswego-il-route-34/

Getting Started with Real Estate Market Analysis

A detailed market analysis is key to any real estate investment decision. Even though the financial projections have far more impact in management and investment decisions, market analysis is behind each and every number in the financial statements. So, it is important to take the time to gather the data required to fully understand the subject property’s market area. In the end, the quality of the market analysis can make a difference in accurately determining whether or not a property is a feasible, profitable investment.

Defining The Market Area For a Property

The first step in creating a market analysis is to define the market area of the subject property. The market area is the most probable geographic area that the subject property will service. The size of the market area is dependent upon the type of property it is and the service it provides. For example, the market area of a convenience store is relatively small. The majority of the customers the convenience store serves typically live in less than a one-mile radius of its location. On the other hand, a larger community center development may include a variety of retail stores and offices that serve an area within around a ten-mile radius.

Typically, the general market area is the smallest geographic area that has publicly accessible economic and demographic data. The neighborhood is the area that includes any major competitors to the subject property. Consider where the subject property’s neighborhood is in the neighborhood life cycle. The life cycle contains four stages. In the growth stage, there is a lot of new construction, and the population in the area increases at an above-average rate compared to other neighborhoods in the area.

At some point, however, the growth rate slows, the neighborhood becomes fully developed, and the period of stability begins. Depending on development trends in the area along with the overall physical characteristics of the improvements, a neighborhood could remain in a relatively stable part of its cycle for a long time. During this period, vacancy rates are stable, and prices generally increase along with the national average.

Eventually, the neighborhood will begin to decline as the economic welfare of the area declines or the real estate begins to fall into disrepair. This stage is characterized by falling property values and high vacancy rates.

Often with some local government intervention, however, the neighborhood undergoes revitalization. Urban renewal or gentrification efforts bring new residents and businesses into a neighborhood in which prices are at their lowest levels. Businesses and residents are enticed into the area by the low prices along with promises of tax breaks. If successful, a neighborhood can begin the life cycle again by transitioning into a new growth phase.

Population trends can help illustrate these changes in the neighborhood. Trends in census data over time help to tell the story of the area. The market analysis should consider the population size, household size, age distribution, marital status, education level, and employment rate for the residents in the area. Population growth is fueled by economic and employment growth. In some areas, however, population growth is fueled immigration or retirement destinations in warmer locations. Population growth of this kind can bring both unique opportunities and challenges into an area, and it is important to consider those long-term implications.

Gathering Data for a Real Estate Market Analysis

There are many good data sources available for free online to assist with a demographic analysis. The U.S. Census Bureau provides extensive population and demographic data, but the only problem is the gap in the data points, since they only gather data every ten years. The Federal Reserve collects economic and financial data, and the Department of Housing and Urban Development provides access to housing data. Depending on the size of the area and the level of detail needed for the market analysis, private sources of data may be required. There are a variety of companies that provide demographic and economic data for a fee.

Type of Data Sources of Data
Population size and demographics US Census Bureau
Unemployment rate Bureau of Labor Statistics
Household income Bureau of Labor Statistics; US Census Bureau
Housing prices FRED economic research; HUD
Interest rates FRED economic research
Daily traffic counts Data.gov
Public schools Data.gov
Building permits Data.gov; Local city offices
Commercial real estate sales Costar; LoopNet

For example, here are some demographic data comparing the population of Orlando to both the state of Florida and the United States overall. One of the first observations about Orlando is that the population is comparatively young and more likely to speak Spanish compared to other parts of the state and the country. The area is densely populated. The demographic section of the market analysis would include additional data about education, age, and income over time. Growth rates illustrate the dynamic population characteristics of an area.

Population trends are an important component of understanding the real estate market in an area. Specific demographic groups have shopping preferences that can influence retail development. Populations with an older average age may need more office space and medical facilities. Areas with young or transient populations may need more of the overall housing supply dedicated to apartments and condominiums.

In addition to analyzing the population and economics of the market area and neighborhood, it is important to analyze the competition. What other properties in the area are supplying the space market for a particular property type? Find out what rental rates competitors charge and their average vacancy rate. Consult the public records in the area to find if there are any permits for new construction in the area that will also change the current supply levels and create additional sources of competition for buyers and tenants.

Modeling Supply and Demand For a Real Estate Market Analysis

Organizations such as the Urban Land Institute publish statistics such as the typical retail sales per square foot across the country. After researching the typical per capita sales or per capita demand for the subject property type, research the current sales volume and rents for competitors in the market area. The population data forecasts expected demand based off growth expectations. The current real estate data show whether the existing supply of real estate is less than, greater than, or matching the current and projected national average sales or demand per square foot of space. Although the influences on supply are generally the same across property types, the demand influences can differ across commercial property types.


For instance, consider and example neighborhood with a population growth rate of a steady 3%, and a projected population of around 27,500. Multiply that population by the national forecasted per capita sales in the next year. If projected per capita sales for a specific type of retail store was $175, sales demand in the area would be $4,812,500 next year.

Then, divide that sales demand by the typical sales per square foot for similar stores around the country. If the average store had typical sales of $140 per square foot, that would equal a square footage demand in the area of 34,375 square feet. Consider whether the market area currently has less than or greater than that amount of square footage devoted to serving this demand. If demand is greater than the current supply, current owners may earn higher than average per capita sales, but there is also room for the market to absorb additional supply of real estate. If demand is less than current supply, the market tends to have lower than average sales and rents along with higher than average vacancy rates. Population demographics also determine suitable absorption rates for new developments, which is the length of time it takes to reach a stabilized occupancy level for a new commercial property.

The Multiplier Effect in Real Estate Market Analysis

The multiplier effect describes the propensity for economic activity to lead to job growth, population growth, and rising income levels in a region. This is why a real estate market analysis needs to include information about the population and the industries that create the local economy. In general, the higher the skill and education level requirements of the industry, the greater the multiplier effect is on the local economy. For that reason, areas with a strong technology presence are considered to benefit the most from the multiplier effect. Industries that require relatively low skill and low levels of education also have the lowest multiplier effects. Forecasting potential growth in the demand for particular types of real estate should consider the impact of economic growth in local industry along with its propensity to create new jobs and higher income for the region. The multiplier effect models changes in aggregate demand caused by cash injections into the local economy.

The intensity of the multiplier effect is represented by the change in real GDP divided by the change in the amount of cash injected into the economy.

Multiplier (k) = change in real GDP / change in cash injections

In a simple economy, the multiplier can also be represented as a function of the population’s marginal propensity to consume and marginal propensity to save. Where the marginal propensity to save is 10% and marginal propensity to consume is 90%, the multiplier effect is 10.

k = 1/marginal propensity to save = 1/.1 = 10

k = 1 / (1-marginal propensity to consume) = 1 / (1-.9) = 10

For example, a cash injection of $100,000 into the economy gets paid out as wages and then spent in the local economy on goods and services. Local businesses then pay that money out as wages, which in turn results in more spending on goods and services. If the multiplier effect is equal to 10, it means this $100,000 additional cash injection ultimately results in $1,000,000 of effective income into the region.

Tobin’s q and Real Estate Market Analysis

Although the idea of Tobin’s q was originally established to describe a firm’s decisions regarding investment in capital assets, the theory can be expanded to describe investment in real estate. The original equation for Tobin’s q was:

Tobin’s q = market value of reproducible real capital assets/current replacement cost of assets.

In real estate, the cost of reproduction is defined by an appraiser’s cost approach to valuation. So, Tobin’s q can be generalized to apply to real estate assets using the following equation:

Q = market price of existing real estate/cost of land + improvements’ construction cost.

Applying this theory to real estate and urban development, the market has the capacity to absorb additional supply if the construction is creating additional value. Mathematically, this is true any time q>1. When this is true, developers have the ability to earn enough profit to make new construction projects financially feasible. When that new inventory becomes available on the market, however, the market value of similar real estate assets will fall until the demand grows to meet the new supply. When market prices decline due to the new supply, the value of Tobin’s q also decreases. So, Tobin’s q is a useful tool for evaluating current supply and demand conditions for real estate market segments and the impact new development has on the current space market.

Conclusion

In this article, we briefly outlined at a high level the steps taken to complete a real estate market analysis. The first task is to define the market area, which is the geographic area a property is expected to service. Then, we discussed how and where to gather relevant market data for a property. And finally, we discussed supply and demand factors to consider, including the multiplier effect and Tobins q. Real estate market analysis is a complicated subject, and this article gives a high-level overview on how to get started.


Source: Getting Started with Real Estate Market Analysis

https://www.creconsult.net/market-trends/getting-started-with-real-estate-market-analysis/

Tuesday, August 22, 2023

Why Is Real Estate Market Analysis So Important?

Many real estate investors fail to recognize the importance of the market analysis. Whether they lack the skills and knowledge to complete the market analysis or just don’t understand the benefits, market analysis is an undervalued asset in real estate investment. In reality, the market analysis is the most important element in evaluating a real estate investment. The market analysis forms the base for every calculation and decision that follows. So, thoroughly researching and understanding the market is crucial to good decision-making.

An Overview of a Real Estate Market Analysis

A real estate market analysis contains a few basic sections, and each provides key information needed for analyzing the valuation and financial feasibility of any real estate investment. The first section defines the area under consideration. Defining the area is more than just finding the lot boundaries but involves defining the size of the target market most likely to generate income. Accurately defining the target market and neighborhood allows the investor to identify competition and the current supply to meet current demand in that area.

The second section contains a thorough analysis of the physical and environmental factors impacting the real estate. Physical factors include things like location, natural resources, topography, soil conditions, climate, water availability, and transportation patterns. At first glance, some of these factors may not seem terribly important to analyzing the profitability of a real estate investment. In some cases, however, the community’s location next to an ocean or pleasant climate could be an integral part of the community’s economy, industry, and desirability. It would be impossible to fully understand the community dynamics without an appreciation of these physical characteristics.

In addition to these physical factors, the market analysis may also include more information about the neighborhood features. Often, this includes detailed information about the neighborhood’s access to public goods and services. The access to and quality of public utilities can be extremely important to commercial real estate development. Real estate developers must consider whether or not a particular parcel of land has sufficient access to utilities as well as whether those utilities are capable of meeting the additional servicing demands of the new development. If not, the developer must convince the local government to invest in upgraded utility services to the area. So, the availability of adequate utility services and construction costs should not be overlooked since they can ultimately determine the feasibility of any real estate project.

After addressing the physical factors of the location, the market analysis evaluates the economic characteristics and trends in the area. The purpose of this economic analysis is to provide an understanding of the underlying population, business conditions, and the future demand for a particular type of real estate. Trends in demographic data provide some insight into the future economic health of a region. For example, a growing population is generally a good sign of economic prosperity in a region as long as there are growing job opportunities for the residents. Population age distribution, education, and income are also important indicators of regional growth patterns.

Broader economic trends in the region as well as at the national level should also be addressed in the market analysis. Although all real estate is local, larger, macroeconomic forces have ripples throughout all local markets. As a result, interest rates, current and proposed changes to tax policies, inflation, GDP growth, and unemployment rates need to be analyzed in a market analysis. All of these factors play an important role in the growth or decline of the economic base surrounding the subject property. The CCIM institute has a nice demand cycle flow chart that puts all of this together:

Commercial Real Estate Demand Cycle

Investigating other new construction in the area should also be part of a market analysis. Searching for building permits can be an excellent indicator of past development as well as new supply that will be on the market in the future. New construction is a signal that a neighborhood is considered desirable, but it can also be a source of competition for tenants or buyers. Other issues related to construction are zoning and development requirements for a new construction. The market analysis should investigate the zoning and building regulations as well as the timeline, costs, and attitude of the local planning board. These three factors alone can determine whether or not a real estate investment is financially feasible or not.

Overall, the market analysis should provide a comprehensive picture of the subject property, location, neighborhood, and the larger market economic drivers. The final document should allow the reader to understand the current supply and demand conditions for this particular type of real estate as well as a picture of how these conditions may change in the future. It should also provide conclusions about the changing demographics and regulations in the neighborhood and how those factors as well as economics could impact the subject property.

The Connection Between the Market Analysis and Financial Analysis

Not only is a thorough market analysis necessary to understand the outlook for a real estate investment, but also, it is critical to creating the real estate proforma. Proforma forecasts are simply a best, educated guess about future performance. In order to make an educated estimate, however, the investor needs a lot of background information about the market. All of this information comes from the market analysis.

For example, consider the top line in a real estate proforma. Potential Rental Income is an estimate of the maximum rent an owner could obtain at 100% occupancy. Forecasting potential rental income requires a forecast of expected future rental rates that owner can reasonably attain. An investor could simply assume a fixed annual growth rate based on past experience. A more accurate estimate of future rental rates, however, involves an analysis of current supply as well as future supply that may be entering the market. Future demand estimates involve understanding the desirability of the location relative to neighboring areas, growth patterns and traffic patterns in the area, population growth and demographics, and overall health and stability of the neighborhood’s economic base. All of these items are components of the market analysis.

The next item on a proforma accounts for vacancy. Again, it is possible for an investor to use a fixed vacancy rate every year in the analysis. Unfortunately, it is not always realistic to assume vacancy rates will never change. The expected vacancy rate is a function of future supply and demand conditions that are generated through an analysis of current available space and expected new construction, relative market pricing, and demand generated by the economic base of the area. So, any meaningful forecast of vacancy rates requires a thorough market analysis.

Estimating future operating expenses also requires an understanding of the current market costs and how they will change over time. These changes relate back to the fundamentals of the local economy and industry as well as national macroeconomic trends. The information contained in the market analysis can help determine appropriate growth rates for operating expenses.

The bottom-line net operating income gets put into a variety of valuation and feasibility models. One of the common methods for discounting net operating income to quickly generate a valuation is by using a market capitalization rate. The market capitalization rate is a measure of how buyers discounted net operating income to value nearby comparable properties. Finding the most appropriate comparables is one more component of the market analysis. So, from start to finish, the proforma and valuation models rely on the data contained in the market analysis.

Conclusion

Real estate investors should never purchase a property without conducting a thorough and detailed market analysis. Although the process of researching the location, the local market, and the larger economic influences on the population and property is time-consuming, its importance should never be overlooked. Investors don’t want to put money into an asset that will not earn a target rate of return over their anticipated holding period. Making projections and decisions without the benefit of a detailed market analysis adds unnecessary risk into an investment analysis or feasibility analysis. Not paying proper attention to the market fundamentals that generate cash flows can cause significant error in the proforma financial statements. Unfortunately, these errors could cause investors to select projects that will not end up meeting their target rate of return. Alternatively, investors could also overlook a property that does have the ability to earn a target rate of return due to errors in their cash flow forecasting model.


Source: Why Is Real Estate Market Analysis So Important?

https://www.creconsult.net/market-trends/why-is-real-estate-market-analysis-so-important/

Price Reduction – 1270 McConnell Rd, Woodstock, IL Now $1,150,000 (Reduced from $1,200,000) This fully occupied 16,000 SF industrial propert...