Chicago Multifamily Cap Rate Map: What Drives Investment Value
Understanding the Chicago multifamily cap rate landscape is essential for investment decisions in 2025. This thematic map offers more than just a visual of pricing — it reveals operational risk, submarket fundamentals, and asset class volatility that drive investor returns and pricing behavior.
Multifamily cap rates are uniquely complex. Unlike single-tenant net lease properties, where cap rates reflect tenant credit quality and lease duration, multifamily pricing is shaped by a dynamic mix of local economics, operational burdens, and tenant behavior.
Why Multifamily Cap Rates Behave Differently
Multifamily assets are short-term lease products with intensive operating models. Cap rates are influenced by:
Tenant churn and leasing friction
Market-specific demand volatility
Local policy factors (rent control, permitting)
Asset condition and cap-ex requirements
Class segmentation (Class A vs. B/C)
These factors result in cap rate spreads that reflect true income risk — not just credit quality. Net leased properties trade with narrow spreads because of credit-backed income streams, while multifamily spreads widen significantly due to greater unpredictability in NOI.
Read: Cap Rate Spreads: Understanding Multifamily Risk Premiums
2025 Trends in the Chicago Multifamily Cap Rate Market
Class A properties in neighborhoods like the Loop and North Lakefront trade in the mid-6% cap rate range, reflecting newer construction, institutional capital, and more predictable demand.
Class B/C stock in South and West Side submarkets often trades at 7.5–8.5%, pricing in turnover, deferred maintenance, and income fragility.
Citywide average: ~7.5%, though individual sales have ranged from 2.7% to over 20%, depending on property-level and locational risk.
Explore this in depth in the 2025 Multifamily Market Outlook
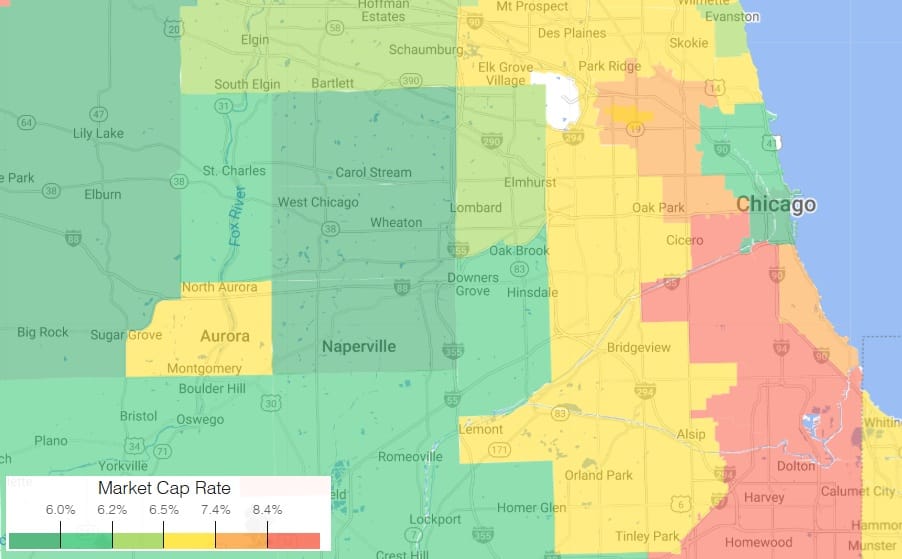
Interpreting the Cap Rate Map: Color as Risk and Opportunity
The map is not just a price guide — it’s a visual reflection of where investor risk premiums are most pronounced:
Green zones: Lower cap rates tied to stability, higher liquidity, and strong underlying demand
Red/orange zones: Higher cap rates due to rent stagnation, maintenance exposure, and affordability constraints
Class B/C assets in red zones may show low vacancy, but often have compressed rent potential and elevated cap-ex risk. Meanwhile, green zones often reflect stabilized assets with institutional appeal and longer-term appreciation upside.
Cap Rate Comparison: Multifamily vs. Net Lease
In net lease investments, cap rates respond to bond-like factors: credit ratings, lease term, and passive ownership. In contrast, multifamily cap rates are operationally intensive and respond to:
Rent collections and delinquencies
Turnover costs and resident churn
Capital expenditures
Micro-market volatility
As detailed in Cap Rate Spreads: Understanding Multifamily Risk Premiums, these layers of risk result in higher spreads — even in similar markets — making cap rates an expression of operational complexity rather than lease reliability.
For context on macro investment trends, see CBRE’s Multifamily Investment Outlook
Class A vs. B/C: Divergent Risk Profiles
Class A: Typically newer construction, higher-income tenant base, lower maintenance burden — and therefore tighter cap rates.
Class B/C: Older assets often require repositioning or increased management and capital, leading to higher cap rates but also potentially higher returns if well executed.
Interestingly, Class B/C properties have posted lower vacancy rates (~3%) than Class A (~8%) in recent quarters — due to affordability demand — but the true return calculus must factor in expenses, rent ceilings, and risk of turnover.
Investor Takeaways
Use cap rate maps as signals of risk, not just return.
Understand the operational burden behind higher yields — they may reflect friction, not opportunity.
Cap rate spreads reveal asset class truth — especially when comparing multifamily to credit-backed sectors.
Expect divergence by class and submarket — underwriting must be hyperlocal and asset-specific.
Cap rates are macro-sensitive — higher interest rates can tighten spreads and compress values fast.
Looking to position your asset for resale or value extraction? Start with our guide: Maximizing Your Multifamily Property’s Sale Potential
https://creconsult.net/chicago-multifamily-cap-rate-drivers/?fsp_sid=1152


No comments:
Post a Comment