Saturday, July 8, 2023

What is Debt Yield and How Does it Apply in Commercial Real Estate

Debt yield hasn’t traditionally been a primary commercial real estate loan underwriting metric, but more lenders are incorporating it into their criteria. In the current real estate market, measuring debt yield ratios provides lenders with a stable assessment regardless of unusual or changing conditions.

Debt yield is a standardized way to measure net operating income (NOI) against total loan value. The ratio is simple to calculate, but it’s an accurate measure of risk that can be used to evaluate individual loans or compare different loans.

How to Calculate Debt Yield

The math required for a debt yield calculation is simple and easy. The debt yield formula is:

Debt Yield = Net Operating Income / Loan Amount

For example, consider the purchase of a property with $300,000 NOI and a loan of $3 million. In this example, the debt yield is 10 percent ($300,000 / $3,000,000 = 10%).

Answer a few questions and get custom mortgage quotes. We'll match you with offers from our network of 650+ lenders.

What Does Debt Yield Tell You?

Lenders use debt yield ratios to determine what their return would be if a buyer immediately defaulted on a commercial real estate loan. Loans with low debt yields are considered riskier, as the lender would receive a smaller return in the event of foreclosure. Higher debt yields are less risky because the lender would receive a larger return and could recoup their losses faster.

Once lenders know what annual return they’d receive, they can calculate how long it’d take to recoup the loss on a foreclosed property. This is done by dividing 100 percent by the debt yield ratio (annual return). The result is the number of years that it’d take to recoup all losses.

Recoup Time = 100 / Debt Yield

Assuming the above debt yield of 12 percent, the lender could recoup their investment in around 8.3 years (100% / 12% = 8.33 years).

Borrowers can alternatively use the ratio to calculate the maximum loan amount a property can qualify for. If the allowed debt yield and net operating income are known, then the loan amount is the NOI divided by the debt yield.

Maximum Loan Amount = Net Operating Income / Debt Yield

If a lender requires a minimum debt yield of 10 percent, the maximum amount that the above example could qualify for would be $1.2 million ($120,000 / 0.10 = $1,200.000).

(Of course, any maximum loan amount would also be subject to loan to value (LTV) and debt service coverage ratio (DSCR) requirements. If a lender considers all three of these ratios, whichever has the lowest permitted loan amount is the one that sets the maximum amount borrowed.)

How Debt Yield Applies to Commercial Real Estate

Lenders appreciate that debt yield ratio is insulated from variables that can skew loan to values, debt service coverages, and even cap rates. As extremely low-interest rates and spiking property values make accurate loan risk assessment more difficult, debt yield provides a consistent risk measurement when underwriting commercial real estate loans.

Debt Yield vs. Loan to Value

Loan-to-value ratios depend heavily on the value of a commercial property, and this ratio is susceptible to large swings in property values. Borrowers can potentially get much larger loans when property values increase drastically, and lenders can be underwriting an underwater loan if property values then drop drastically.

In contrast, debt yield ratios aren’t impacted by changes in property value. The loan itself is the underlying denominator, and not how much the property is worth. So long as net operating income doesn’t change, debt yield won’t change after a loan is underwritten.

Debt Yield vs. Debt Service Coverage

Debt service coverage is based on the annual debt payment, which is affected by interest rate and amortization schedule. Thus, DSCR can be skewed by extreme interest rates (currently extremely low) and/or long amortizations. The DSCR for variable-rate loans will also change as interest rates increase.

Debt yield is based on the loan amount, and thus won’t change with interest rates or amortization schedules. It is thus a more consistent measure in many situations, even though both measurements use net operating income.

Debt Yield vs. Cap Rate

Although cap rate also looks at net operating income, this is based on the value of a property. Cap rate is thus susceptible to some of the same issues as loan to value is, and which debt yield is insulated against.

What is an Acceptable Debt Yield?

The Comptroller’s Commercial Real Estate Lending booklet recommends a minimum debt yield of 10 percent, and most lenders that consider this metric follow that recommendation.

In certain situations, lenders may allow a 9 percent debt yield for desirable properties in major markets (e.g. New York City, Los Angeles). Ratios of 8 percent for truly exceptional properties are quite rare, although not altogether unheard of.

Notably, debt yield is based on current net operating income. Projected rent increases or NOI growth isn’t considered when calculating the ratio, so adjusting projections generally won’t have an impact on whether debt yield meets a lender’s minimum requirement.


Source: What is Debt Yield and How Does it Apply in Commercial Real Estate

https://www.creconsult.net/market-trends/what-is-debt-yield-and-how-does-it-apply-in-commercial-real-estate-2/

Friday, July 7, 2023

Why Should I Sell My Multifamily Property?

Why should I Sell My Multifamily Property?

There are a number of reasons why people decide to sell their multifamily property, but most can be categorized into three groups: Problems, Opportunities, and Changes.

With this decision though comes the consideration of capital gains tax and how to ensure you are getting the most for the sale of your property.

There are several reasons why people do sell:

Problems:             

  • Management
  • Vacancy
  • Maintenance
  • Stress
  • Health
  • Debt
  • Neighborhood
  • Interest Rates

Opportunities: 

  • Strong Market Values
  • Alternate Investment
  • End of the Hold Period
  • Tax Savings

Changes:               

  • Divorce
  • Death
  • Retirement
  • Partnership Split
  • Relocation
  • Consolidation
  • Diversification

What do I do with the sales proceeds? I don't want to pay Capital Gains Tax!

There are several options for sellers to defer or minimize capital gains taxes:

  • 1031 Exchange
  • Delaware Statutory Trust/Deferred Sales Trust  (DST)
  • Tenancy in Common Investment (TIC)
  • Installment Sale

How do I know I am getting the most money for my property?

We not only market properties for sale. We make a market for properties we represent. Each offering is thoroughly underwritten, aggressively priced, and accompanied by loan quotes to expedite the sales process. We leverage our broad national marketing platform syndicating to the top CRE Listing Sites with direct outreach to our investor database and an orchestrated competitive bidding process that yields higher sales prices. 

What is my property worth?

Contact Us to discuss what information is needed to complete a Complimentary Commercial Broker Opinion of Value (BOV). 

I’m not interested in selling at this time.

This is understandable as only about 5% of the market trades in any given year. We are also happy discuss any purchase or refinance interests and recommend some physical and operational changes you can make to add value to your property you will appreciate when you eventually sell.  


Have you thought of selling your property and would like to know what it's worth? Request a valuation for your property below:

Request Valuation

eXp Commercial Chicago Multifamily Brokerage focuses on listing and selling multifamily properties throughout the Chicago Area and Suburbs.

We don’t just market properties; we make a market for each property we represent. Each offering is thoroughly underwritten, aggressively priced, and accompanied by loan quotes to expedite the sales process. We leverage our broad national marketing platform syndicating to the top CRE Listing Sites for maximum exposure combined with an orchestrated competitive bidding process that yields higher sales prices for your property.


https://www.creconsult.net/market-trends/why-should-i-sell-my-multifamily-property/

Commercial Real Estate Financing Rates Update May 16th 2023

[row] [col span__sm="12"]

These are the average of the top competitive rates from the eXp Commercial's National Capital Markets Partner CommLoan from a database of 700+ commercial lenders as of 5/16/23.

*Actual rates are dependent on property and sponsor and are provided for comparison purposes only.

[/col] [/row] https://www.creconsult.net/market-trends/commercial-real-estate-financing-rates-update-may-16th-2023/

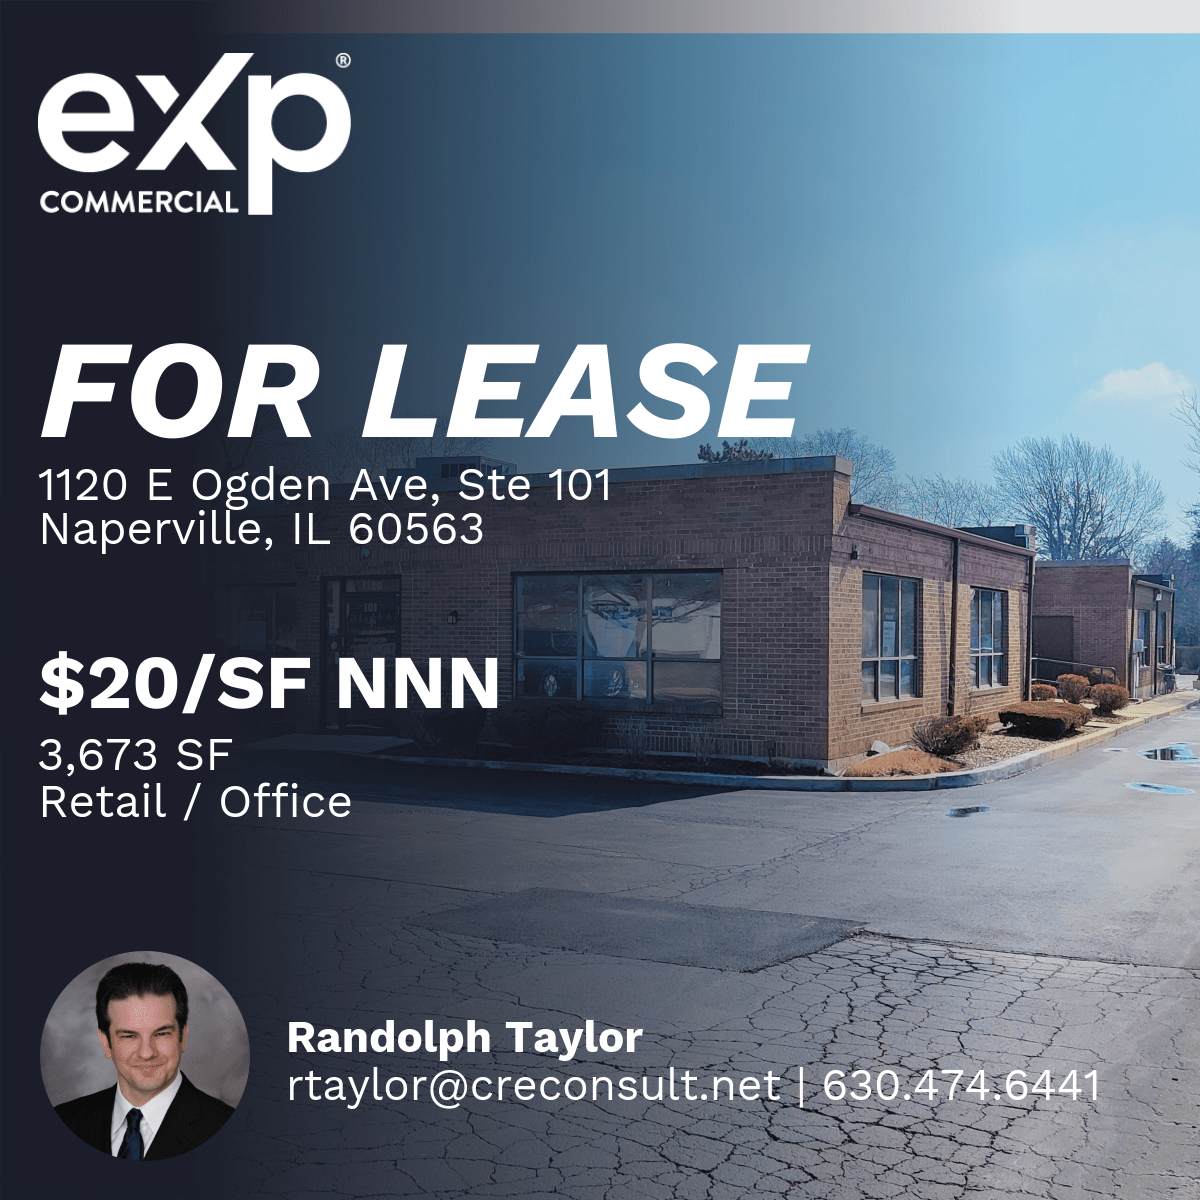
1120 E Ogden

Retail / Office Space For Lease | 3,674 SF | $20/SF NNN
1120 E Ogden Ave, Suite 101 | Naperville, IL 60563
Broker: Randolph Taylor rtaylor@creconsult.net | 630.474.6441

https://www.creconsult.net/retail-office-for-lease-1120-e-ogden-ave-suite-101-naperville-il-60563/?wpo_all_pages_cache_purged=1

Thursday, July 6, 2023

Aurora self-storage market soon to change; projected to add 243,000 square feet in 2023

With one of the most undersupplied markets at only 2.4 square feet of self-storage space per person at the moment, Aurora, Illinois, is set to benefit from very generous self-storage developments, according to a new report by RentCafe. In fact, Aurora is the second fastest-growing city for projected self-storage inventory growth, with 243,000 square feet of self-storage space to be delivered by the end of 2023, making up around 32% of its existing inventory. The list of places adding the most self-storage this year is headed by Elk Grove, California, which has, in recent years, been the fastest-growing in the U.S., and is projected to double its inventory to over one million square feet of space, based on the report. Santa Clarita, California, comes in just after Aurora at No. 3, and is expected to grow its storage space by almost 25% in 2023.
Aurora’s additions will be especially welcome, as the suburb experienced a series of rent decreases in recent periods. In March 2023, Aurora’s street rates were $91 (non-climate controlled, 10-foot by 10-foot unit), down 3.2% from February and down 9% from March 2022, which could be attributed to a shrinking customer base and market saturation.

Source: Aurora self-storage market soon to change; projected to add 243,000 square feet in 2023

https://www.creconsult.net/market-trends/aurora-self-storage-market-soon-to-change-projected-to-add-243000-square-feet-in-2023/

163 E Lincolnway

Just Listed - 23 Unit Multifamily For Sale
$425,000 | Heavy Value-Add | 20.5% Cap Rate (Proforma)
631 E Lincolnway | Morrison, IL 61270
https://www.creconsult.net/for-sale-heavy-value-add-23-unit-multifamily-property-morrison-il/

Wednesday, July 5, 2023

Investors take note: Chronic underproduction of housing in the U.S. puts workforce rental housing in the spotlight

Investors looking for attractive returns in the U.S. housing market need look no further than workforce rental housing. A chronic shortage of housing in the country, exacerbated by onerous zoning, land use, and environmental regulations, labor shortages, and demographic shifts, has created a prime opportunity for investing in this segment.

The Supply Shortfall
Since 2017, the shortage of housing in the U.S. has been growing at an alarming rate, with estimates now ranging from 3.8 to 6.8 million units. The lack of supply, particularly in the workforce housing sector, has resulted in historically low vacancy rates and record-high rent and home prices.

Between 2010 and 2021, household formation exceeded net housing deliveries by nearly 4.8 million units leading to a decrease in vacancy rates, making housing less affordable and hindering household formation.

To close the housing gap, at least 3.4 million units are needed within five years, and the rate of new unit delivery needs to increase by approximately 71%. This shortage is evident in the downward trend of the ratio of total housing inventory to the total number of households, which has been below 1 (meaning there is at least one household unit for every household) since Q4 2017.

The shortage also disproportionately affects younger generations, as the median age of household heads has increased from 49.0 in 2008 to 52.1 in 2021.

The current combined vacancy rate for all for-sale and for-rent housing in the US is just 2.5%, with rent and home prices growing annually by an average of 11.1% and 18.9%, respectively.

The Growth and Impact of Zoning, Land Use, and Environmental Regulations on Housing Production
Strict local zoning and environmental laws limit affordable housing by increasing development costs by 32% for multifamily projects. This reduces supply, forcing developers to charge higher prices.

Increasing regulations worsen the housing shortfall, as evidenced by a negative correlation between regulatory cases and permits issued per state. From 2006 to 2018, 49% of U.S. metropolitan areas increased land use regulations. Each regulation in a California city raises the cost of owner-occupied and rental housing by an estimated 4.5% and 2.3%, respectively.

The Workforce Rental Cohort
The shortage of new workforce housing is hurting those earning between $45,000 and $75,000 annually the hardest, as developers typically focus on either luxury apartments or affordable housing. This underserved segment has higher rents and reduced vacancies, making it an attractive investment opportunity.

Private real estate funds focused on workforce rental housing have historically returned an average net IRR of 16.4% between 2009 to 2019, outperforming luxury housing-focused funds’ average net IRR of just 10.7%. While past performance is not indicative of future results, the favorable demographic and supply/demand fundamentals make the workforce multifamily sector a positive outlook for investors.

The chronic underproduction of housing in the U.S. has made workforce rental housing an attractive and sustainable target for investment. As demand goes unmet, prices rise, and this is a trend that is set to continue in the coming years. Investors looking for opportunities in the U.S. housing market should consider investing in the workforce rental segment for durable cash distributions and sustainable capital value appreciation.

Source: Investors take note: Chronic underproduction of housing in the U.S. puts workforce rental housing in the spotlight

https://www.creconsult.net/market-trends/investors-take-note-chronic-underproduction-of-housing-in-the-u-s-puts-workforce-rental-housing-in-the-spotlight/

Price Reduction – 1270 McConnell Rd, Woodstock, IL Now $1,150,000 (Reduced from $1,200,000) This fully occupied 16,000 SF industrial propert...