Thursday, March 3, 2022

eXp World Holdings Reports Record Full-Year 2021 Revenue of $3.8 Billion

eXp World Holdings Reports Record Full-Year 2021 Revenue of $3.8 Billion

2021 Marks Highest Revenue and Profit Year in Company History, Driven by a 72% Increase in Agent Growth

Company Declares Cash Dividend for Q1 2022 of $0.04 per Share of Common Stock

BELLINGHAM, Wash., Feb. 24, 2022 (GLOBE NEWSWIRE) — eXp World Holdings, Inc. (Nasdaq: EXPI), (or the “Company”), the holding company for eXp Realty®, Virbela and SUCCESS® Enterprises, today announced financial results for the fourth quarter and full-year ended Dec. 31, 2021.

Fourth Quarter and Full-Year 2021 Financial Highlights as Compared to the Same Year-Ago Period:

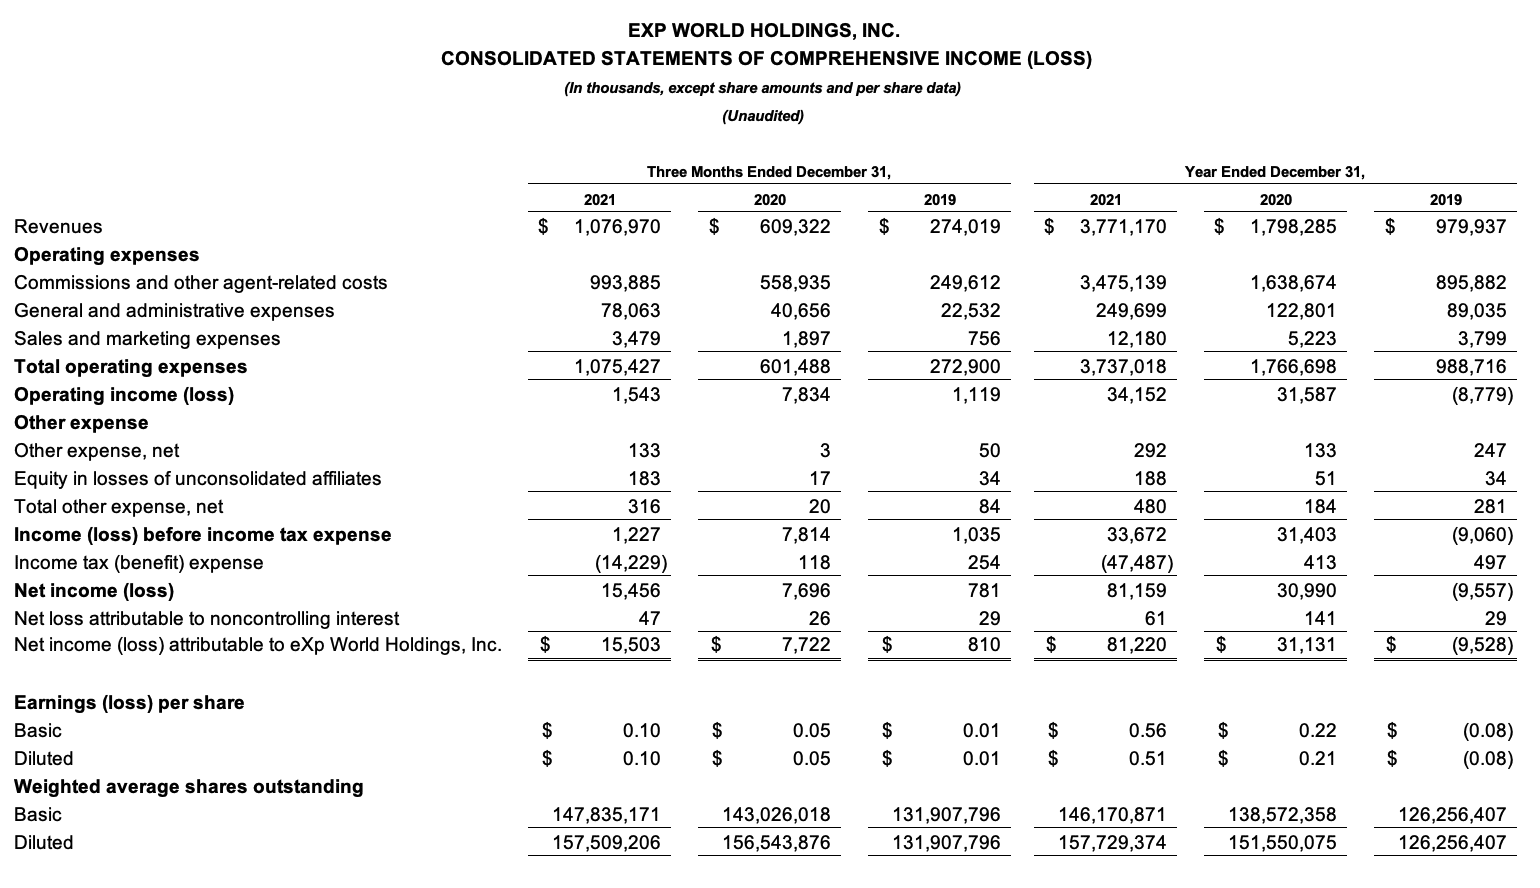
  • Revenue increased 110% to $3.8 billion in 2021 and increased 77% to $1.1 billion in the fourth quarter of 2021.
  • Gross profit increased 85% to $296.0 million in 2021 and increased 65% to $83.1 million in the fourth quarter of 2021.
  • Net income increased 162% to $81.2 million in 2021 and increased 101% to $15.5 million in the fourth quarter of 2021. An income tax provision benefit of $47.5 million and $14.2 million, respectively, is included in the full year and the fourth quarter 2021 net income.
  • Earnings per diluted share increased 143% to $0.51 in 2021 and increased 100% to $0.10 per diluted share in the fourth quarter of 2021.
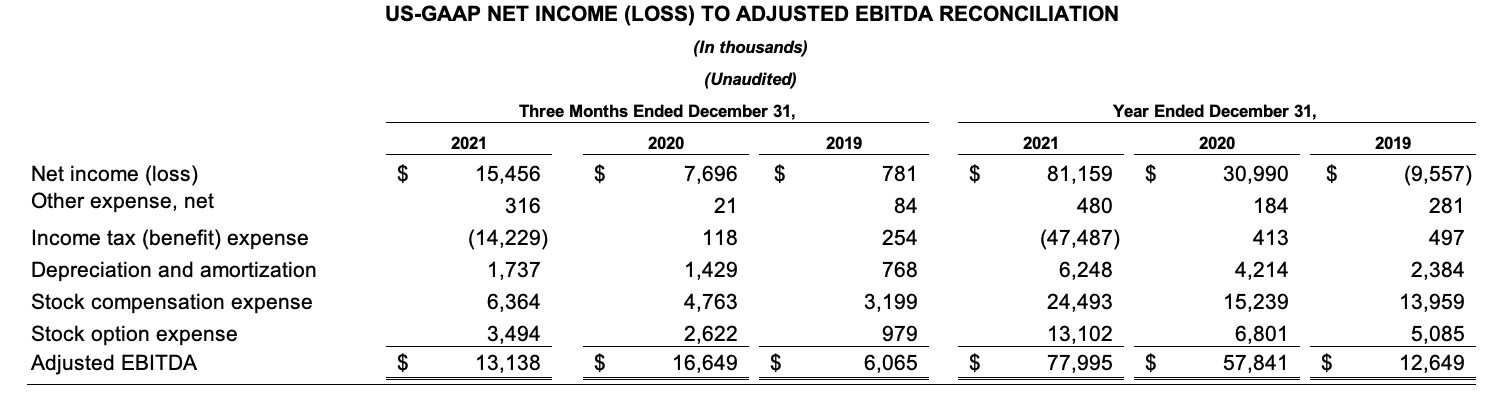
  • Adjusted EBITDA (a non-GAAP financial measure) increased 35% to $78.0 million in 2021. Adjusted EBITDA was $13.1 million in the fourth quarter of 2021 compared to $16.6 million in the fourth quarter of 2020. Excluding a $10 million one-time legal settlement in the fourth quarter, adjusted EBITDA increased 52% to $88.0 million in 2021, and increased 39% to $23.1 million in the fourth quarter of 2021.
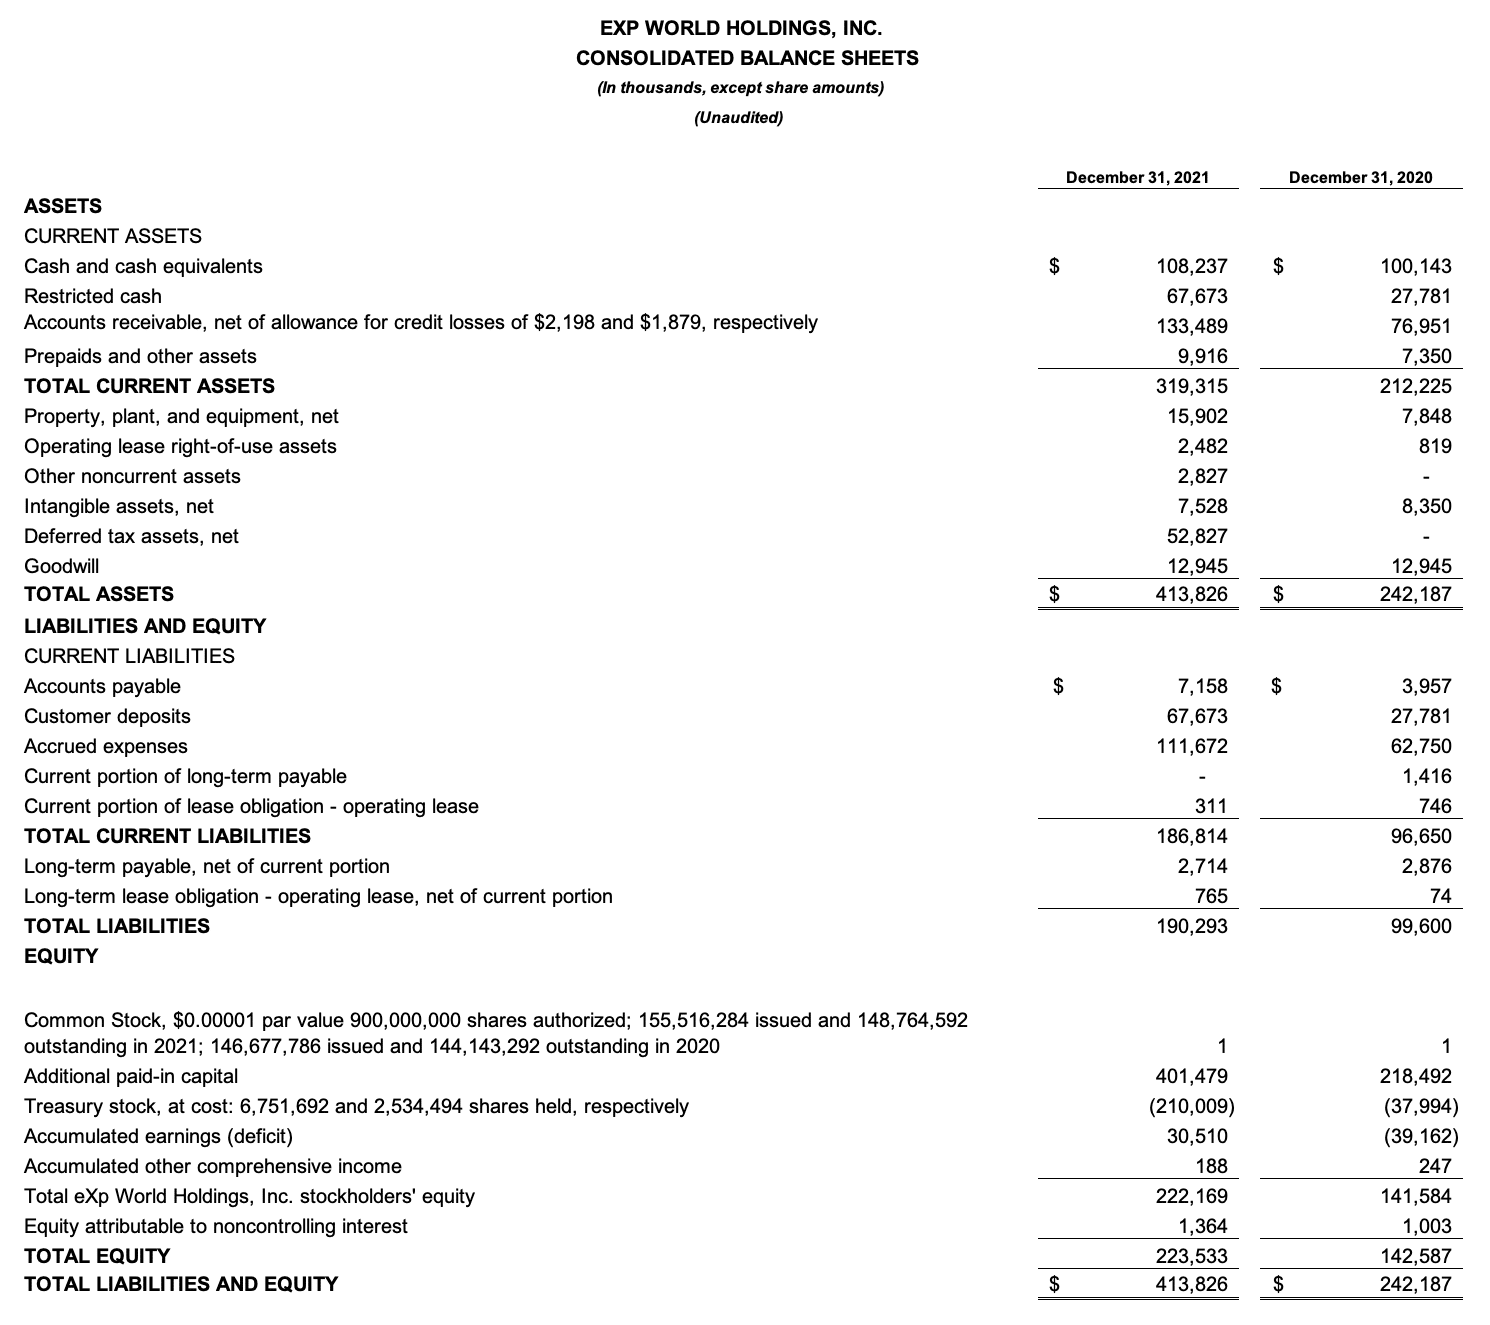
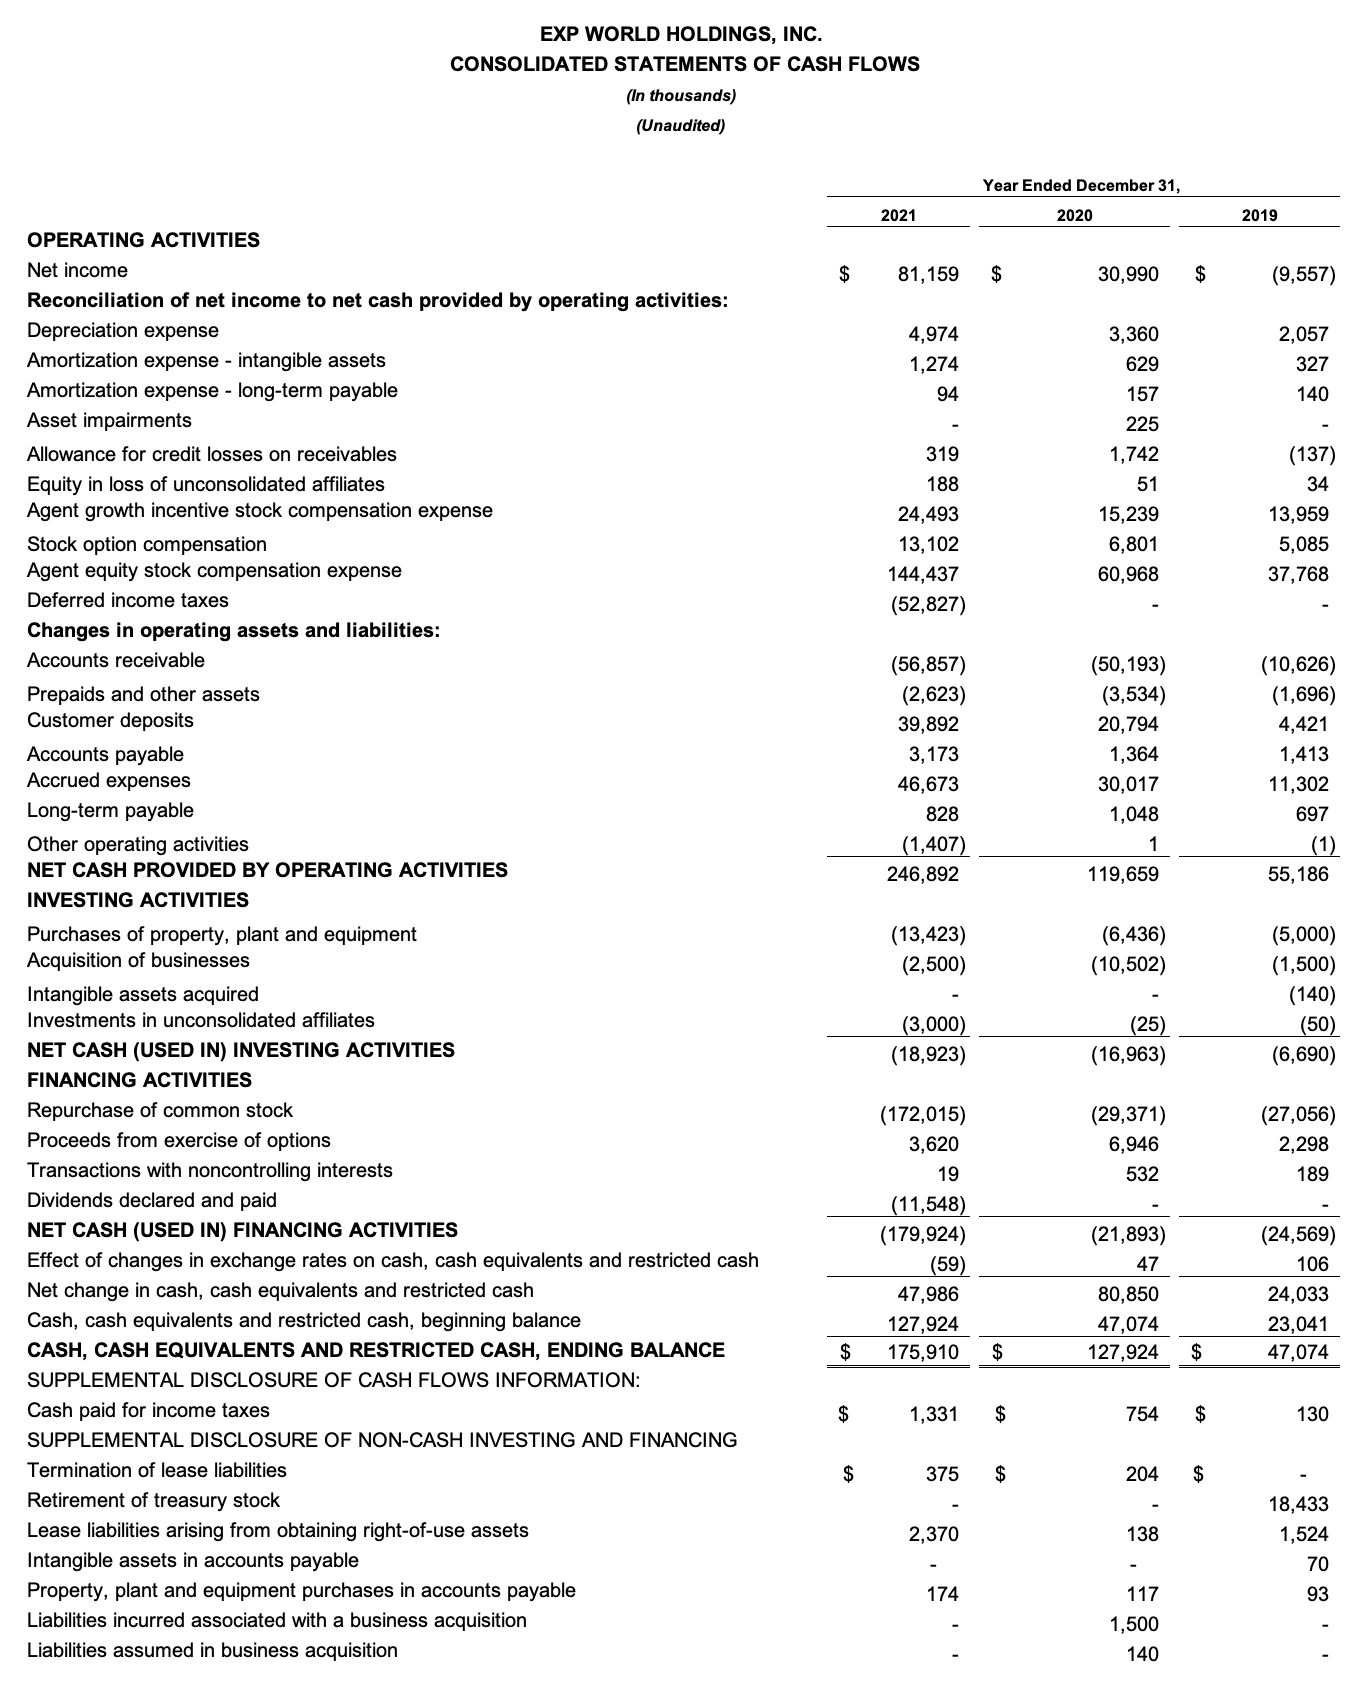
  • As of Dec. 31, 2021, cash and cash equivalents totaled $108.2 million, compared to $100.1 million as of Dec. 31, 2020. The Company repurchased approximately $172.0 million of common stock during 2021.
  • The Company paid a cash dividend for the fourth quarter of 2021 of $0.04 per share of common stock on Nov. 15, 2021. On Feb. 17, 2022, the Company’s Board of Directors declared a cash dividend of $0.04 per share of common stock for the first quarter of 2022 expected to be paid on March 31, 2022 to shareholders of record on March 11, 2022.
Management Commentary

“2021 was another year of tremendous growth for eXp, as our core focus on innovation enabled us to welcome nearly 30,000 new agents across six continents to eXp,” said Glenn Sanford, Founder, Chairman and CEO of eXp World Holdings. “As real estate professionals increasingly turn to technology-based solutions for productivity and collaboration, our cloud-based platform has given us a first-mover advantage to scale our brokerage at the fastest rate in the industry. We attract top agents that value freedom, compensation and community.”

“We evolved our robust suite of products and services last year as we made preparations to launch SUCCESS Lending, a synergistic mortgage solution that aims to provide greater efficiencies and clearer communication between agents and their customers. To deepen our commitment to developing and inspiring our community of real estate professionals, we launched SUCCESS Coaching, our new business that provides a results-driven approach to personal development. Looking ahead, we believe there is a significant opportunity to capture additional market share in the real estate and adjacent industries as people and companies adapt to a digital future. We will remain focused on fostering collaboration and building an unparalleled network of industry professionals around the world,” concluded Sanford.

“In 2021, we achieved a record $3.8 billion in revenue by focusing on our growing, global community of real estate agents,” said Jeff Whiteside, CFO and Chief Collaboration Officer of eXp World Holdings. “Our year-over-year increase in transaction volume proves that the eXp model is resonating with top-producing agents and our ability to maintain this momentum underscores the strength of our competitive position. Reinvesting incremental cash flows generated by our business in products, services and technologies that further enhances the eXp platform for agents remains a priority as we scale, both within our existing markets and globally.” Fourth Quarter and Full-Year 2021 Operational Highlights as Compared to the Same Year-Ago Period:
  • Agents and brokers on the eXp Realty platform increased 72% to 71,137 as of Dec. 31, 2021.
  • Real estate transactions closed increased 86% to 444,367 in 2021 and increased 52% to 125,029 in the fourth quarter of 2021.
  • Real estate transaction volume increased 116% to $156.1 billion in 2021 and increased 82% to $44.9 billion in the fourth quarter of 2021.
  • eXp Realty expanded into nine new international locations in 2021, including Puerto Rico, Brazil, Italy, Hong Kong, Colombia, Spain, Israel, Panama and Germany. In February 2022, the Company successfully launched in the Dominican Republic and announced plans to establish operations in Greece and New Zealand in the first quarter of 2022.
  • SUCCESS® Lending, LLC – a residential lending joint venture with Kind Lending, LLC – was established and SUCCESS Coaching™ – a coaching program for entrepreneurs and business professionals – was launched.
  • eXp Realty ended 2021 with a global Net Promoter Score of 71, a measure of agent satisfaction as part of the Company’s intense focus on improving the agent experience.
Fourth Quarter and Full-Year 2021 Results – Virtual Fireside Chat

The Company will hold a virtual fireside chat and investor Q&A with eXp World Holdings Founder and CEO Glenn Sanford and CFO Jeff Whiteside on Thursday, Feb. 24, 2022 at 8:30 a.m. PT / 11:30 a.m. ET. The discussion will be moderated by Tom White, Managing Director and Senior Research Analyst at D.A. Davidson.

The investor Q&A is open to investors, current shareholders and anyone interested in learning more about eXp World Holdings and its companies.

Date: Thursday, Feb. 24, 2022 Time: 8:30 a.m. PT / 11:30 a.m. ET Location: EXPI Campus. Join at https://expworldholdings.com/contact/download/ Livestream: expworldholdings.com/events About eXp World Holdings, Inc. eXp World Holdings, Inc. (Nasdaq: EXPI) is the holding company for eXp Realty®, Virbela and SUCCESS® Enterprises.

eXp Realty is the fastest-growing real estate company in the world with more than 75,000 agents in the United States, Canada, the United Kingdom, Australia, South Africa, India, Mexico, Portugal, France, Puerto Rico, Brazil, Italy, Hong Kong, Colombia, Spain, Israel, Panama, Germany and the Dominican Republic and continues to scale internationally. As a publicly traded company, eXp World Holdings provides real estate professionals the unique opportunity to earn equity awards for production goals and contributions to overall company growth. eXp World Holdings and its businesses offer a full suite of brokerage and real estate tech solutions, including its innovative residential and commercial brokerage model, professional services, collaborative tools and personal development. The cloud-based brokerage is powered by Virbela, an immersive 3D platform that is deeply social and collaborative, enabling agents to be more connected and productive. SUCCESS® Enterprises, anchored by SUCCESS® magazine and its related media properties, was established in 1897 and is a leading personal and professional development brand and publication.

For more information, visit https://expworldholdings.com. Use of Non-GAAP Financial Measures To provide investors with additional information regarding our financial results, this press release includes references to Adjusted EBITDA, which is a non-U.S. GAAP financial measure and may be different than similarly titled measures used by other companies. It is presented to enhance investors’ overall understanding of the company’s financial performance and should not be considered a substitute for, or superior to, the financial information prepared and presented in accordance with U.S. GAAP.

The company’s Adjusted EBITDA provides useful information about financial performance, enhances the overall understanding of past performance and future prospects, and allows for greater transparency with respect to a key metric used by management for financial and operational decision-making. Adjusted EBITDA helps identify underlying trends in the business that otherwise could be masked by the effect of the expenses that are excluded in Adjusted EBITDA. In particular, the company believes the exclusion of stock and stock option expenses, provides a useful supplemental measure in evaluating the performance of operations and provides better transparency into results of operations.

The company defines the non-U.S. GAAP financial measure of Adjusted EBITDA to mean net income (loss), excluding other income (expense), income tax benefit (expense), depreciation, amortization, impairment charges, stock-based compensation expense, and stock option expense. Adjusted EBITDA may assist investors in seeing financial performance through the eyes of management, and may provide an additional tool for investors to use in comparing core financial performance over multiple periods with other companies in the industry.

Adjusted EBITDA should not be considered in isolation from, or as a substitute for, financial information prepared in accordance with U.S. GAAP. There are a number of limitations related to the use of Adjusted EBITDA compared to Net Income (Loss), the closest comparable U.S. GAAP measure. Some of these limitations are that:

  • Adjusted EBITDA excludes stock-based compensation expense and stock option expense, which have been, and will continue to be for the foreseeable future, significant recurring expenses in the business and an important part of the compensation strategy; and
  • Adjusted EBITDA excludes certain recurring, non-cash charges such as depreciation of fixed assets, amortization of acquired intangible assets, and impairment charges related to these long-lived assets, and, although these are non-cash charges, the assets being depreciated and amortized may have to be replaced in the future.

Safe Harbor StatementThe statements contained herein may include statements of future expectations and other forward-looking statements that are based on management’s current views and assumptions and involve known and unknown risks and uncertainties that could cause actual results, performance or events to differ materially from those expressed or implied in such statements. Such forward-looking statements speak only as of the date hereof, and the company undertakes no obligation to revise or update them. These statements include, but are not limited to, statements about the continued growth of our agent and broker base; expansion of our residential real estate brokerage business into foreign markets; demand for remote working and distance learning solutions and virtual events; development of our commercial brokerage and our ability to attract commercial real estate brokers; and revenue growth and financial performance. Such statements are not guarantees of future performance. Important factors that may cause actual results to differ materially and adversely from those expressed in forward-looking statements include changes in business or other market conditions; the difficulty of keeping expense growth at modest levels while increasing revenues; and other risks detailed from time to time in the company’s Securities and Exchange Commission filings, including but not limited to the most recently filed Quarterly Report on Form 10-Q and Annual Report on Form 10-K.Media Relations Contact: eXp World Holdings, Inc.

[email protected]

Investor Relations Contact: MZ Group – MZ North America [email protected]

https://www.creconsult.net/market-trends/exp-world-holdings-reports-record-full-year-2021-revenue-of-3-8-billion/

Wednesday, March 2, 2022

The First Round Of Rental Assistance Reallocation Is Here And It's Underwhelming


Cities and states have accelerated their distribution of Emergency Rental Assistance funds, leaving less extra money than expected in the pool for those who need it most.

The Treasury Department announced the first round of reallocations under the ERA program on Jan. 7, with $1.1B to change hands from jurisdictions that couldn’t or wouldn’t send their respective chunks of federal funding to those who either have run out of funds or will soon. The vast majority of the reallocations, about $875M, come in the form of voluntary transfers within individual states.

Only the first pool of ERA funds, just under $24B when accounting for administrative spending, was eligible to be reallocated, the announcement stated. Further reallocations from the ERA1 pool, as the agency labeled it, are forthcoming over the next few months, with the next deadline for requests being Jan. 21. The process of reallocating the second pool of rental assistance funds, or ERA2, is not legally allowed to begin until March 31.

The largest single transfer of funds was the state of North Dakota returning $149M of the $352M it received from ERA1 to the federal pool, which did not include any cities or counties within North Dakota among the reallocation recipients. North Dakota officials explained the decision by noting that a huge portion of the 120,000 renters in the state were not aware of the program, the Grand Forks Herald reports.

The most significant transfers of funds were from states to some of their largest jurisdictions. The highest dollar transfer came in Indiana, with the state transferring more than $91M to the city of Indianapolis. Wisconsin gave the cities of Milwaukee and Madison $61M and $35M respectively, with another $50M going to Milwaukee County. Nebraska gave the cities of Omaha and Lincoln $50M and $30M respectively, while Arizona sent $39M to Phoenix’s Maricopa County and Louisiana sent over $34M to New Orleans.

Of the money distributed directly by the Treasury Department to states, counties, and cities, the state of California was the biggest beneficiary, receiving over $50M. New York, where ERA distribution was notoriously slow to get off the ground, received $27M, while New Jersey, which fared considerably better, received $42M.

Only 21 jurisdictions had funds involuntarily recaptured by Treasury: seven states, 13 counties, and one city. The agency prioritized jurisdictions with demonstrated need within the same state when deciding where to reallocate those recaptured funds, but no data was publicly released laying out where exactly those funds wound up, unlike voluntary transfers within states. The Treasury Department declined to comment on the reallocation process beyond the press release, it told Bisnow through a representative.

The state of Idaho had $33M recaptured, while the only in-state recipients on Treasury’s list, the city of Boise and Ada County, received $7.2M and $3.7M, respectively. The rest of the recaptured $33M, the largest sum in the list of involuntary recaptures presumably went out of state.

Delaware, Montana, Ohio, South Dakota, Vermont, and West Virginia were the other states from which Treasury recaptured ERA money, with Laredo, Texas, being the only city to have funds recaptured in that fashion. Counties that had funds recaptured included Tuscaloosa in Alabama, five Texas counties, and New Jersey’s Union County, which sits across the Hudson River from New York and counts the key port city of Elizabeth as its largest municipality.

Only jurisdictions that requested additional funding and had obligated over 65% of their ERA1 allocations by the first application deadline of Oct. 15 were eligible to receive reallocations, and Treasury used both demonstrated need and effectiveness in spending ERA1 funding to prioritize recipients. But it couldn’t even come close to meeting the need in some jurisdictions.

The city of Philadelphia asked for $400M in reallocation funds based on the number of applicants and the average payout, which has been about $11K per applicant, said Rachel Mulbry, an assistant program manager for the Philadelphia Housing Development Corp. tasked with overseeing the city’s distribution. Treasury reallocated $8.4M to the city, which it has yet to receive, Mulbry and PHDC CEO David Thomas told Bisnow.

“The information we received from Treasury is that they anticipate us receiving the funding in the coming weeks,” Mulbry said.

The same day the reallocation data was released, Philly was forced to close its rental assistance application portal due to a lack of funds. Only a small portion of those who already applied will wind up getting assistance, even with the extra $8M, which would cover about 750 applicants at an average of $11K per household.

“It seemed unfair to have people’s expectations out there looking for relief when we couldn’t provide it,” Thomas said. “We were hoping not to close, and we were hoping legislators would figure out how to reallocate more funds, but it just hasn’t materialized.”

Even if Philly were to somehow receive the entire $400M it requested, it likely wouldn’t meet the demand if the city program were to reopen, though PHDC would probably attempt to open it if it received such a sum, Thomas said.

The divide between the need for rental assistance and the available funds still looms over the horizon, even as jurisdictions set a new high-water mark for money sent out the door in the month of November, according to Treasury data. Using November data to project forward, the agency estimates that $25B to $30B was distributed to tenants by the end of last year from the combined $46B available from ERA1 and ERA2.

The nature of the federal coronavirus relief packages was to treat the economic conditions caused by the pandemic as an acute crisis that demanded short-term funding to see people through to the other side. Though the economy has not shut back down through the emergence of the variants, the lost income that catching the disease could cause are still immediate dangers to housing stability, said Michael Spotts, a senior visiting research fellow at the Urban Land Institute’s Terwilliger Center of Housing. That includes unexpected burdens like remote learning when families don’t have daytime childcare options.

“People might have exhausted the minimal savings they had or taken on more debt to pay rent,” said Spotts, who authored a research report published in December for ULI about housing stability and the rental market. “The pre-existing conditions that contribute to [housing] insecurity will likely have worsened for a lot of people. So there will be a continued need for emergency rental assistance for people who suffer shocks going forward.”

https://www.creconsult.net/market-trends/the-first-round-of-rental-assistance-reallocation-is-here-and-its-underwhelming/

Tuesday, March 1, 2022

Chart: US Apartment Sector Momentum Across Markets


The U.S. apartment sector has experienced a rebound in both deal volume and asset pricing, but the performance varies across markets. The strongest growth in asset pricing tends to be concentrated in the Non-Major Metros, as shown in the chart below.

The simple average of annual price growth in the Non-Major Metros outpaced that of the 6 Major Metros in Q3 2021. Across the non-major areas, the average price growth stood at 14.8% while that across the 6 Major Metros averaged 4.5%.

In the 6 Major Metros, there is a loose relationship between the rebound in the pace of sales of individual buildings — the bedrock of the market — and subsequent price growth. Even with a triple-digit rebound in sales volume, some of these markets were still experiencing price declines in the third quarter. Markets such as San Francisco and Manhattan have faced stronger headwinds.

https://www.creconsult.net/market-trends/chart-us-apartment-sector-momentum-across-markets/

Monday, February 28, 2022

Pandemic Rent Growth Highlights Migration Patterns

Photo by Tobias Wilden on Unsplash

When the COVID-19 pandemic hit the U.S. in the spring of 2020, few could have imagined that the virus would still be impacting daily lives for the rest of the year, let alone nearly two years later. And when lockdowns started and 20-plus million jobs were lost, the dominant theme in the multifamily market was how to mitigate the damage.

However, as we start 2022, multifamily rents are coming off record-breaking highs in 2021 with an optimistic outlook for the year ahead. Between March 2020 and December 2021, asking rents in Matrix’s top 30 metros rose by an average of $194, or 13.5 percent. During that period, asking rents increased by 20 percent or more in nine of the 30 largest metros and 10 percent or more in 19 of the top 30. Meanwhile, in only four metros—large coastal centers San Jose, San Francisco, and New York, as well as Midland, Texas—were asking rents below pre-pandemic levels.

Looking at the universe of 147 metros tracked by Yardi Matrix, asking rents increased by 20 percent or more in just over one in five (29) and by 10 percent or more in almost three quarters (79). The only metros that remain below pre-pandemic asking rent levels are in the Bay Area (San Francisco and San Jose), New York City, and Midland/Odessa, Texas, where rents are down by 22.5 percent.

Migration Shifts

The changes in rent since the pandemic started reveal much about demand and where growth could be concentrated going forward. Sheltering in place and working from home has loosened the link between home and work and limited the cultural advantages of large cities. That led to a migration from high-cost coastal centers starting in the spring of 2020. Where households are going can be seen by rent growth data.

The top choice is the South and Southwest. Between March 2020 and December 2021, asking rents grew by 34.5 percent on the Southwest Florida Coast; 31.1 percent in Phoenix; 28.5 percent in Tampa; 28.2 percent in Las Vegas; 27.2 percent in Boise, Idaho; 25.0 percent in Asheville, N.C.; 22.9 percent in Atlanta; 21.4 percent in Orlando; 20.7 percent in Raleigh-Durham; and 20.6 percent in Charlotte. These secondary and tertiary markets feature a lower cost of living than gateway metros, attractive weather, and geography, and a growing base of jobs as corporations expand there.

Another type of migration occurred between expensive coastal markets and nearby secondary markets that are less expensive. Asking rents since the pandemic started grew by 25.4 percent in the Inland Empire, 20.2 percent in Sacramento, and 18.3 percent in Orange County. In this type of migration, people move farther from job centers but within occasional commuting distance for flexible jobs. Or they are willing to make longer commutes in exchange for larger or less expensive apartments. Other metros that reflect this type of migration include Baltimore (11.7 percent), Colorado Springs (14.7 percent), Northern New Jersey (8.9 percent), and Long Island (8.6 percent).

Data and chart courtesy of Yardi Matrix

The struggles of San Jose (-4.8 percent), San Francisco (-2.1 percent), and New York (-0.1 percent) reflect the high cost of housing in those markets and decline of office usage, especially among the technology jobs in the Bay Area metros. Some renters have become either unable or unwilling to pay high rents for small apartments in urban areas.

Even so, gateway cities can take heart from the fact that demand is rapidly returning. Year-over-year through November, occupancy of stabilized apartments is up 3.2 percent in New York, 2.9 percent in Chicago, 2.5 percent in San Jose, and 2.0 percent in San Francisco. As the pandemic gets nearer to its end phase, more companies are asking employees to come back to the office, if not full time at least more often. What’s more, as cities reopen, young workers from other parts of the country want to experience the cultural and lifestyle benefits of gateway centers.

An Enduring Trend?

Where all this goes is unpredictable. As demonstrated by the onset of the Omicron wave, forecasting the end of the pandemic is difficult. New variants of the virus may impact corporate policies regarding remote work—more are delaying going back to the office or even implementing permanent fully remote policies. That could continue to drive migration away from large job centers. In-migration continues to be a big factor. Fewer people moved to urban centers during the pandemic, even as more moved out. Post-pandemic, immigration could pick up and make up for households moving out. As long as the pandemic continues to affect commerce and travel, future migration will remain unpredictable. Clearly, however, the growth in metros in the South and West is not likely to abate.
https://www.creconsult.net/market-trends/pandemic-rent-growth-highlights-migration-patterns/

Sunday, February 27, 2022

Demand for Apartments in 2021 Smashes Previous Record High by 66%

Demand for market-rate apartments in 2021 soared far above the highest levels on record in the three decades RealPage has tracked the market. Net demand totaled more than 673,000 units – obliterating the previous high set in 2000 by a remarkable 66%. Demand would have been even stronger if not for record-low vacancy, severely limiting the number of units available to rent.
Strong demand drove up apartment occupancy 2.1 basis points year-over-year to 97.5%. Both the increase and the resulting rate were the highest on record since RealPage began tracking apartments in the early 1990s.
Household formation is likely occurring at a faster clip than official government data sources are reporting. It’s not just apartments. We’re seeing huge demand and ultra-low availability for all types of housing – including for-sale homes and single-family rentals – in essentially every city and at every price point.
The Sun Belt and Mountain/Desert regions combined to account for more than half of the nation’s apartment demand in 2021, led by Dallas/Fort Worth’s 7.4% share of the U.S. total.
Remarkably, occupancy rates hit or top 96% in 148 of the nation’s 150 largest metro areas. (For context, a rate of 95-96% is traditionally considered “full” when accounting for normal turnover time between leases.) The only exceptions are a pair of small Texas markets: Corpus Christi and Midland/Odessa.
Severely limited availability has led to price appreciation in all types of housing, including apartments. Effective asking rents on new leases increased a record-high 14.4% in 2021. However, there are signs that rent growth could soon moderate – though not dramatically. True new lease rent growth (the replacement rent a new renter pays compared to the previous renter of the same unit) peaked in August and has inched down since then. Asking rents, the traditional headline metric, tend to be a lagging indicator.
New lease rent growth in 2021 reached double-digits in 103 of the nation’s 150 largest metros. Florida and Desert region markets led the way, with appreciation topping 20% in 11 Florida markets: Naples, Sarasota, West Palm Beach, Fort Myers, Tampa, Fort Lauderdale, Port St. Lucie, Orlando, Jacksonville, Palm Bay, and Miami. Outside the Sunshine State, 11 more metros topped 20% – including Phoenix, Las Vegas, Austin, Raleigh/Durham, Atlanta, and Salt Lake City.
In one major positive sign, renter incomes continued to soar upward – keeping rent-to-income ratios in the low 20% for the average renter household signing a new lease. New renter incomes registered at $70,116 nationally, up 11% above the pre-pandemic high.
It’s tremendously encouraging to see that for the vast majority of market-rate renters, apartments remain affordable. With this big wave of new demand coming in, these renters are bringing big incomes and they are paying rent on time. We’ve seen this not only in our own data but in reporting from all the publicly traded rental housing REITs. However, averages and medians do not tell the full story. Not every household could afford market-rate rentals even prior to the pandemic, and as much as we need more housing of all types, our country remains in desperate need of more affordable housing.
One encouraging sign: Unlike in single-family, multifamily new supply continues to hit the market in large volumes – and even more is on the way. Nearly 360,000 market-rate apartment units completed in 2021. That’s the biggest addition in more than three decades. Another 682,000 units are under construction. Of those, roughly 426,000 are scheduled to complete in 2022 – marking the first time since 1987 supply will top the 400,000-unit mark.
The increase in supply is great news for renters unable to find available housing. We need more housing – all types of housing. But most of these new apartments are higher-rent, Class A+ communities. Affordable housing requires government support and funding in various forms, and there simply isn’t enough of that across most of the country right now.
Construction leaders remain the usual markets, led by Dallas/Fort Worth, Phoenix, and New York. On a relative basis (construction relative to the size of the market), metros seeing significant volumes of supply underway include Nashville, Austin, Salt Lake City, Phoenix, Charlotte, Raleigh/Durham, and Jacksonville – all high-demand areas.
“Multifamily starts have been robust over the last decade and stalled only briefly when the pandemic first hit before re-accelerating again,” said Carl Whitaker, RealPage’s Director of Research and Analysis. “Starts in 2022 will likely top 2021 levels, meaning completions should remain very high through at least 2023-2024. That’s especially true in many of the nation’s Sun Belt metros, most notably D/FW, Austin, Phoenix, and Nashville.”

https://www.creconsult.net/market-trends/demand-for-apartments-in-2021-smashes-previous-record-high-by-66/

Saturday, February 26, 2022

Prediction 2022 will be a good year for multifamily housing


In its U.S. Multifamily Outlook for Winter 2022, Yardi Matrix forecasts that the fundamentals of the multifamily housing business will remain strong in 2022 as the wider economy continues its recovery.


Yardi Matrix cited a forecast that called for economic growth of nearly 4 percent in 2022, down from 6 percent in 2021. This is somewhat higher growth than that called for in the recent forecast from Fannie Mae.

One risk to growth is seen to be the rate at which total employment is returning to its pre-pandemic level. Recent reports indicate that there are millions fewer people currently employed than before the pandemic. In addition, the labor force participation rate remains well below its pre-pandemic level, leaving many unfilled jobs in the economy. The shortage of construction workers in particular may impact plans to grow the supply of multifamily housing in 2022.

The rise of inflation and its persistence are also threats to the economy. The fear is that the Federal Reserve will take steps in response to the growth of inflation, such as raising interest rates, that will choke off growth in the economy. While this scenario could lead to a recession, Yardi Matrix believes that a recession is not likely to occur until after 2023.

The year 2021 was one for the record books for the business of multifamily housing. Asking rents were up 13.5 percent and Yardi Matrix estimates that absorption exceeded 400,000 units. However, this is well below the absorption rate of 670,000 units in 2021 estimated by RealPage. The nationwide occupancy rate reached 96 percent in late 2021.

For 2022, Yardi Matrix expects the rate of rent growth to fall to 4.8 percent. While this is down significantly from the level in 2021, it is nearly double the long-term average. Rent growth in 2022 is expected to be supported by continued recovery in the jobs market and by the rapid rise in housing prices and interest rates pricing some renters out of homeownership. Yardi Matrix reported that more than 350,000 units of multifamily housing were delivered in 2021. They expect deliveries to grow to 380,000 units in 2022, representing 2.5 percent of existing inventory. Currently, 800,000 units are under construction, a level that Yardi Matrix expects to be sustained through 2022.

Sales of multifamily buildings rose to $166.8 billion in 2021, up 30 percent from the previous high recorded in 2019. Per-unit prices also set a new high at $188,000 per unit. This was up 20 percent from the level in 2020.

Funding for multifamily mortgages remains readily available. The allocations for Fannie Mae and Freddie Mac were both raised this year by $8 billion to a level of $78 billion each. Funding from commercial mortgage-backed securities (CMBS) and collateralized loan obligations (CLO) also rose in 2021 and are expected to remain high in 2022. While not giving specific forecasts for 2022, Yardi Matrix noted that cap rates for multifamily housing have fallen to the 5 percent range. In certain markets, cap rates for class A properties may be below 4 percent.

https://www.creconsult.net/market-trends/prediction-2022-will-be-a-good-year-for-multifamily-housing/

Friday, February 25, 2022

CRE Multifamily Mortgage Delinquency Rates Fell In Q4


CRE, Multifamily Mortgage Delinquency Rates Fell In Q4

Delinquency rates for mortgages backed by commercial and multifamily properties declined during the fourth quarter of 2021, according to the new Mortgage Bankers Association’s latest CREF Loan Performance Survey.

“The share of outstanding balances that are delinquent fell for both lodging and retail properties, as property owners and lenders and servicers continue to work through troubled deals. The share of loan balances becoming newly delinquent was the lowest since the onset of the pandemic,” said Jamie Woodwell, MBA’s Vice President of Commercial Real Estate Research in the announcement of the results.

He noted it is encouraging that particularly there was improvement among property types that were the most impacted by the downturn.

The improvements in the delinquency rates were small as 97.0% of outstanding loan balances for commercial and multifamily mortgages were current at the end of the fourth quarter, up from 96.7% at the end of the third quarter of 2021 while 1.9% were 90+ days delinquent or in REO, down from 2.2% three months earlier and 0.2% were 60-90 days delinquent, unchanged from three months earlier.

The sectors in the survey which have seen the biggest stress, lodging, and retail properties, saw improvements during the period along with commercial and multifamily mortgages, as a whole. MBA reported 10.5% of the balance of lodging loans were delinquent by the conclusion of December, down from 14.0% at the end of the third quarter of 2021 as the end of the fourth quarter saw 7.6% of the balance of retail loan balances were delinquent, down from 8.2% three months earlier. CMBS loan delinquency rates are higher than other capital sources because of the concentration of hotel and retail loans, but they saw improvement during the final three months of 2021 as well.   Source: CRE Multifamily Mortgage Delinquency Rates Fell In Q4
https://www.creconsult.net/market-trends/cre-multifamily-mortgage-delinquency-rates-fell-in-q4/

Price Reduction – 1270 McConnell Rd, Woodstock, IL Now $1,150,000 (Reduced from $1,200,000) This fully occupied 16,000 SF industrial propert...