1120 E Ogden Ave, Suite 101 | Naperville, IL 60563
Broker: Randolph Taylor rtaylor@creconsult.net | 630.474.6441
https://www.creconsult.net/retail-office-for-lease-1120-e-ogden-ave-suite-101-naperville-il-60563/?wpo_all_pages_cache_purged=1


 For commercial real estate investors, having access to as many metrics as possible to provide insight and comparison opportunities is critical. Various metrics are available, including cash-on-cash return and internal rate of return, enabling investors to compare properties more closely when deciding which to choose for investment.
Most investors set their own threshold of what is acceptable to meet their needs or to ensure they hit a certain target before investment. Yet, when investors consider dozens of opportunities each day, it is helpful to have a straightforward metric to help compare properties. These two figures are core components, and knowing the difference between IRR and cash on cash is critical.
For commercial real estate investors, having access to as many metrics as possible to provide insight and comparison opportunities is critical. Various metrics are available, including cash-on-cash return and internal rate of return, enabling investors to compare properties more closely when deciding which to choose for investment.
Most investors set their own threshold of what is acceptable to meet their needs or to ensure they hit a certain target before investment. Yet, when investors consider dozens of opportunities each day, it is helpful to have a straightforward metric to help compare properties. These two figures are core components, and knowing the difference between IRR and cash on cash is critical.
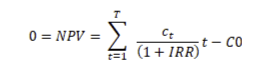 Ct=Net cash inflow during the period
C0=Total initial investment costs
IRR=The internal rate of return
t=The number of time periods
You can learn more about setting up Excel to calculate this by visiting this link.
Ct=Net cash inflow during the period
C0=Total initial investment costs
IRR=The internal rate of return
t=The number of time periods
You can learn more about setting up Excel to calculate this by visiting this link.
Source: Cash on Cash Return vs IRR: Understanding the Difference
https://www.creconsult.net/market-trends/cash-on-cash-return-vs-irr-understanding-the-difference/

As of October, when interest rates were 7%, the average household income needed to cover a mortgage for a Chicago starter home was $63.4K. But the average income of renters was $43.6K, according to Point2Homes research.
That means Chicago renters make only 69% of the income needed to become first-time homeowners, according to Axios reporting on the study.
Point2Homes data indicates the average cost of a Chicago starter home is $204.7K, effectively pricing out many renters given rising interest rates and shrinking single-family housing stock. Only 15 of the 50 largest U.S. cities offered average starter homes for less than $200K, the traditional affordability cutoff for first-time homeowners. Rising mortgage interest rates, high housing prices, and limited inventory make it harder for people to buy their first homes. According to the report, "the modest, bare-bones homes of yesteryear have become the stuff of myths and legends." About 70% of all new builds were starter homes in the 1940s and 40% in the 1980s, but the percentage had fallen to 7% by 2019, according to Census Bureau figures. "Renters’ homeownership dreams don’t match the reality in almost any of the large U.S. housing markets," the report's authors said. Earlier this year, Business Insider reported that first-time home homeowners struggled to afford the typical 20% down payment on a home, which averaged $78.4K based on median home prices when the article was published in March.Source: Chicago Renters Only Make 69% Of The Income Needed To Afford Starter Homes
https://www.creconsult.net/market-trends/chicago-renters-only-make-69-of-the-income-needed-to-afford-starter-homes/
Before we welcome 2023, let’s look at 2022 and how the New York City investment sales market performed, where we are now, and where we might be headed in the new year.
Can you believe that the 10-year Treasury one year ago was 1.48 percent? Doesn’t it seem like that was years ago? I think the thing that 2022 will be most remembered for will be inflation, the unprecedented pace of interest rate increases, and the impact these factors had on the commercial real estate lending markets. To say that things are more challenging today is an understatement.
Coming into 2022, we were very optimistic. In the fourth quarter of 2021 in Manhattan, the sales market for properties over $10 million saw $8.5 billion of volume and 89 sales, both quarterly highs going back to 2016 (except the $9.2 billion total in the second quarter of 2019). Interest rates were low, metrics were moving in the right direction, and it seemed like we would be pulling out of an investment sales malaise that began in October of 2015.
For perspective, in 2015, during the cyclical peak, there were $57.5 billion in sales over 484 transactions. The trough was in 2020, with $11.1 billion in sales over 104 transactions. In 2021, those numbers increased to $15.75 billion and 191 transactions. Through the first three quarters of this year, we were on pace for $21.7 billion and 215 transactions, increases over last year of 38 percent and 12 percent, respectively. However, given how increased interest rates have impacted the market, we expect fourth-quarter 2022 results to be well below the yearly trend. The optimism we went into 2022 with is absent from our perspective heading into 2023.
Inflation was tremendous in 2022, but is that a surprise to anyone? How could inflation not be impacted if the federal government pumps trillions of dollars into the economy? Notwithstanding how much you think the war in Ukraine has impacted things, inflation would still be elevated even if the war never happened. Reducing our ability to produce energy and pumping unprecedented amounts of capital into the economy was a cocktail that could result in only one outcome.
At the same time, many economists believe that the Fed has misdiagnosed the labor market. It scared some folks when the Fed announced that interest rates would “continue to increase until the labor market cools.” However, if we look at the number of jobs in the U.S. economy, there are only about 1.2 million more jobs today than there were in 2019. If we had projected where we would be at the end of 2022 back in 2019, expectations would have been that we would have 3 million to 4 million more jobs by now. The labor market is not overheated; it is undersupplied. This is evidenced by the reductions we have seen in the labor participation rate, which is tangibly lower than it was pre-pandemic. Some economists believe we are being treated for a disease we don’t have. So interest rates have risen, and, importantly, they have risen at an unprecedented rate.
In November, the Fed increased interest rates by 75 basis points, the fourth consecutive 75-basis-point increase, after a 50-basis-point increase in March. This unprecedented pace of rate increases was three times faster than the increases we saw during the period from 2004 to 2006. This pace, inexplicably, doesn’t consider that Fed action normally has a many-month lag before the economy is impacted.
For the commercial real estate market, the impact of these increases was not felt until about three months ago. At that point, the commercial mortgage market was tangibly impacted, and borrowing became much more expensive for borrowers. Interestingly, because of this, comparable sales are only starting to become valid for determining value today. Up to now, most closings are occurring based on contracts signed in the old market and do not consider the current financing market. To determine a value today, we rely much more on contract negotiation activity than transactions that have closed.
Current market conditions have highlighted the fact that cap and interest rates are not highly correlated. Most folks believe this is the case, but it is not. Interest rate fluctuations generally predict the direction of cap rates but not the magnitude of those increases. The cap rate versus interest rate relationship over the long term shows that the relationship is not highly correlated. The flow and availability of capital are more impactful on cap rates and more highly correlated over time rather than increases in interest rates. And that flow and availability of capital are most highly correlated to an age-old battle. Markets are a constant battle between fear and greed, and today fear is winning — so cap rates are rising.
As we head into 2023, refinancing risk will be the most-watched market dynamic. Unlike in 2008 and 2009, regulators won’t allow lenders to extend and pretend. So an owner with a $35 million loan on a $50 million asset will be faced with a big decision when the mortgage matures, and the refinancing proceeds available will be $27 million. The first question is, does the owner have the $7 million to put into the property to effectuate the refinancing? If the answer is no, the owner is left with a decision of whether to sell all of or a partial interest in, the property. If they have the money, will they “invest” that fresh capital into the asset? These will be profound decisions for folks with debt maturing.
Concerning product type performance, each sector will have its own drivers of activity, and there are currently more questions than answers. How will return to work play out in the office sector as leverage in the labor market shifts? How will aggregate demand be impacted as flexible working environments ebb and flow? How will consumption patterns impact the demand for space in the industrial market? Within the multifamily sector, will our elected officials change policy to promote the creation of more supply? In the land sales market, will policy impact property values such that owners are incentivized to sell? In the hotel market, we have seen a tangible reduction in the stock as many rooms have been converted to alternative uses. How will market conditions impact travel patterns? And how will the strength of the dollar impact decisions about where people go and for how long?
From a more macro perspective, will rates continue to rise, and if so, how much? Inflation, although still elevated, seems to be slowing. Sectors of the economy such as housing, construction, and manufacturing are also slowing. However, services are still seeing upward pressure on prices. So will the Fed continue to raise rates, or will it pause to let the lag kick in? And will the present yield curve inversion lead to a recession? In 14 of the last 15 times, the yield curve has inverted, and a recession has followed.
Notwithstanding these questions, one thing is certain: If you ask investors when they made the best deals of their careers, you will universally hear that they were made at times like we are in right now and are likely to see as we head into 2023. Investing in real estate takes capital and, most importantly, guts. Which investors will have the intestinal fortitude to dive in when many take a wait-and-see position? Will today's deals be the ones investors look back on fondly, years from now, when they all wish, “If I had only bought more!”
Clearly, there is an uncertainty going into 2023 — at a level we haven’t seen. Rest assured that we will continue to track all of the indicators that will provide insight into how trends will unfold and will continue to share those insights with you on these pages.
Meanwhile, best wishes for a safe, happy and healthy holiday season and a prosperous New Year!
Source: Here’s What to Expect in Investment Sales in 2023
https://www.creconsult.net/market-trends/heres-what-to-expect-in-investment-sales-in-2023/
It’s the end of the year as we know it, and investors feel uncertain.
Rate hikes have slowed deals in the second half of 2022, and Federal Reserve Chairman Jerome Powell said there’s more pain to come.
But how long can investors’ ample dry powder sit on the sidelines?
The deal dam may break halfway through 2023, Moody’s senior economist Thomas LaSalvia said on the latest episode of TRD’s podcast “Deconstruct.”
“The market is going to have to adjust starting in the middle of next year,” LaSalvia said. “I have a feeling that we will start to see deal volume pick up a little bit more as prices maybe adjust a little bit and also as investors find creative ways to get deals done.”
But each sector holds its own nuance as rates keep rising, inflation remains high and recession looms. Multifamily’s record-breaking rent growth is likely to lose steam. Retail sales may finally feel the impact of heightened prices, and the fate of office could finally come into focus.
Tune into the full episode for a sector-by-sector breakdown of what research firms expect for 2023. The podcast will be back after a holiday break on January 9 with a new episode on Apple Podcasts, Spotify, Audible or wherever you get your podcasts.
Source: Deconstruct Looks at CRE Investment Forecast for 2023
https://www.creconsult.net/market-trends/deconstruct-looks-at-cre-investment-forecast-for-2023/
