Saturday, August 5, 2023

How a Broker Price Opinion Works

The broker price opinion (BPO), also known as a broker opinion of value (BOV), is a popular way of estimating the value of a property. Typical reasons for ordering a broker price opinion include estimating value prior to purchase or sale, understanding collateral value when securing a new loan or refinancing, estimating liquidation value, buying out a partner’s interest in a property, among many others. In this article we’ll take a deep dive into the broker price opinion, review the three approaches to market value, and also clear up some common misconceptions about the broker price opinion.

Broker Price Opinion Template

Before we dive in, we have a handy broker price opinion template that you can use to build your own reports. It’s based on Microsoft Word, so you’ll be able to edit the details as you see fit. Grab it now, then follow along with the rest of the article.

Broker Price Opinion vs Appraisal

The primary difference between a broker price opinion and an appraisal is cost. Because a broker price opinion is less comprehensive, it is usually a fraction of the price of a full appraisal. It’s also important to note that an appraisal is provided by a third-party and is not biased in its estimate of market value. On the other hand, a broker price opinion is typically performed with the intent that the broker will ultimately win the listing, and as such the underlying motivations behind a broker price opinion may be different than that of an appraisal.

Broker Price Opinion State Regulations

It’s important to understand that regulations around broker price opinions are by no means uniform and vary by state. For example, some states only allow broker price opinions to be performed for very specific use cases such as an opinion on a competitive listing price, but not for other use cases such as a tax appeal. Different states have different regulations regarding broker price opinions and explicitly listing out all of these different regulations is beyond the scope of this article. It goes without saying that you should contact a lawyer before performing or ordering broker price opinions in your state to make sure you understand what, if any, restrictions exist.

Approaches to Market Value

The purpose of a commercial real estate valuation is to determine fair market value, which is the most probable price a willing and knowledgeable buyer would pay for a property given a reasonable amount of time to complete the transaction. Before we dive into the components of a typical broker price opinion report, let’s quickly go over the three primary methods used to determine market value.

Sales Comparison Approach
The sales comparison approach equates the value of a property to prices that buyers have historically paid for similar properties. Of course, in practice, no two properties are exactly alike. Typically the sales comparison approach takes into account comparable properties that were sold within the prior 6-12 months. This is arguably the most common method of real estate valuation and consists of the following steps:

  1. Find comparable properties
  2. Adjust the comparable properties found for each variance
  3. Net the adjustments
  4. Select the value, giving a greater weight to the properties with the most similarities

Overall the sales comparison method is most effective when the pool of available recently sold properties is large.

Income Capitalization Approach
The income based approach to market value is based on the idea that a property’s value is derived from the income it produces. The two methods used to value a property based on income are the direct capitalization method and the discounted cash flow valuation method.

The direct capitalization method simply converts a one-year stabilized net operating income (NOI) into a market value using a cap rate. This is done using the IRV formula which states that Value (V) = Income (I) / Capitalization Rate (R). To use this method you simply construct a proforma NOI and divide it by the appropriate cap rate (which is determined from recently sold comparable properties). If there aren’t any or enough recently sold comparable properties then the cap rate can be constructed using other methods such as the band of investment method.

The discounted cash flow valuation method is used when uneven cash flows are anticipated for a property. With uneven cash flows, the more simplistic direct capitalization approach does not take into account these variations in cash flow, and as such is not adequate.

Cost Approach
The cost approach bases value on the cost of reproducing a property, less any accrued depreciation. Accrued depreciation can come from three sources: physical deterioration, functional obsolescence, and external obsolescence.

Physical deterioration is the regular wear and tear that occurs due to exposure to the elements.

Functional obsolescence refers to the inablilty of an existing building to provide the same utility as a newly constructed building. For example, the ceiling height in an existing warehouse may not meet the requirements of modern day users, which could be easily accommodated with a newly constructed building.

External obsolescence refers to the loss of value due to external forces such as road closures, re-routed highways, traffic congestion, etc.

Once the replacement cost is determined and the accrued depreciation is netted out, the cost is added to the value of the land to determined an appropriate value based on cost. The reason why the cost approach is used is because a rational buyer would not pay more for an existing property than it would cost to construct a new building with equal utility. The primary limitation of the cost approach is that it does not reflect the forces of supply and demand, and as such, it is typically used when there is a lack of comparable properties.

Reconciliation of Value
In a full appraisal, and often times in a broker price opinion, the above values are typically reconciled by using a weighted average to determine the final value estimate. For example, it may be determined that a higher weight should be given to the income approach because the available comparable sales data is weak, and as such this would be reflected in the final reconciled value.

Also, it’s worth noting that in practice the cost approach is usually not considered in a broker price opinion. A broker price opinion typically only considers the sales comparison method and the income based approach.

Components of a Broker Price Opinion Report

While each individual broker price opinion report will vary based on the requirements of each specific property, the following components are commonly used in broker price opinion reports. Also, be sure to grab our broker price opinion template which includes sections for the below items.

Location Information – General information about the location of the property, including address, site map, aerial, building type and size.

Description of Site – More detailed information about the site, including ownership, visibility, and access.

Market Area Overview and Trends – Includes information about the market conditions of the trade area including employment growth, population growth, construction/development activity, trends in vacancy and lease rates, commentary on noteworthy local news, as well as a demographic summary and traffic count if applicable.

Subject Property Condition –  More detailed description of the subject property as well as commentary on its condition.

Tenant Information – A discussion of each of the tenants occupying the property including lease terms, lease expiration, industry, etc.

Current Comparable Listings – Photos and analysis of three or more current for sale listings of comparable properties.

Recent Comparable Sales – Photos and analysis of three or more recent comparable sales, including adjustments as well as a discussion of similarities and differences.

Proforma – A stabilized or multi-year proforma for the subject property showing Gross Potential Income, Expenses, and Net Operating Income (NOI).

Range of Market Values – This section should summarize the above sales comparison and proforma data by providing an estimated range of values based on the sales comparison approach and the income approach to value.

Broker Marketing Plan – While this section is not necessary, it is often included by the broker in hopes of winning the listing. This section includes a marketing action plan to market and ultimately sell the subject property.

Closing Thoughts on the Broker Price Opinion

The broker price opinion has become popular in recent years during the recession and banking crises, and due to the increased attention it will likely remain a popular way to estimate market value. While each individual broker price opinion will vary depending on the particular needs of the client and attributes of the property, the above framework should give you a good foundation for understand any broker price opinion.

Source: How a Broker Price Opinion Works

https://www.creconsult.net/market-trends/how-a-broker-price-opinion-works/
Friday, August 4, 2023

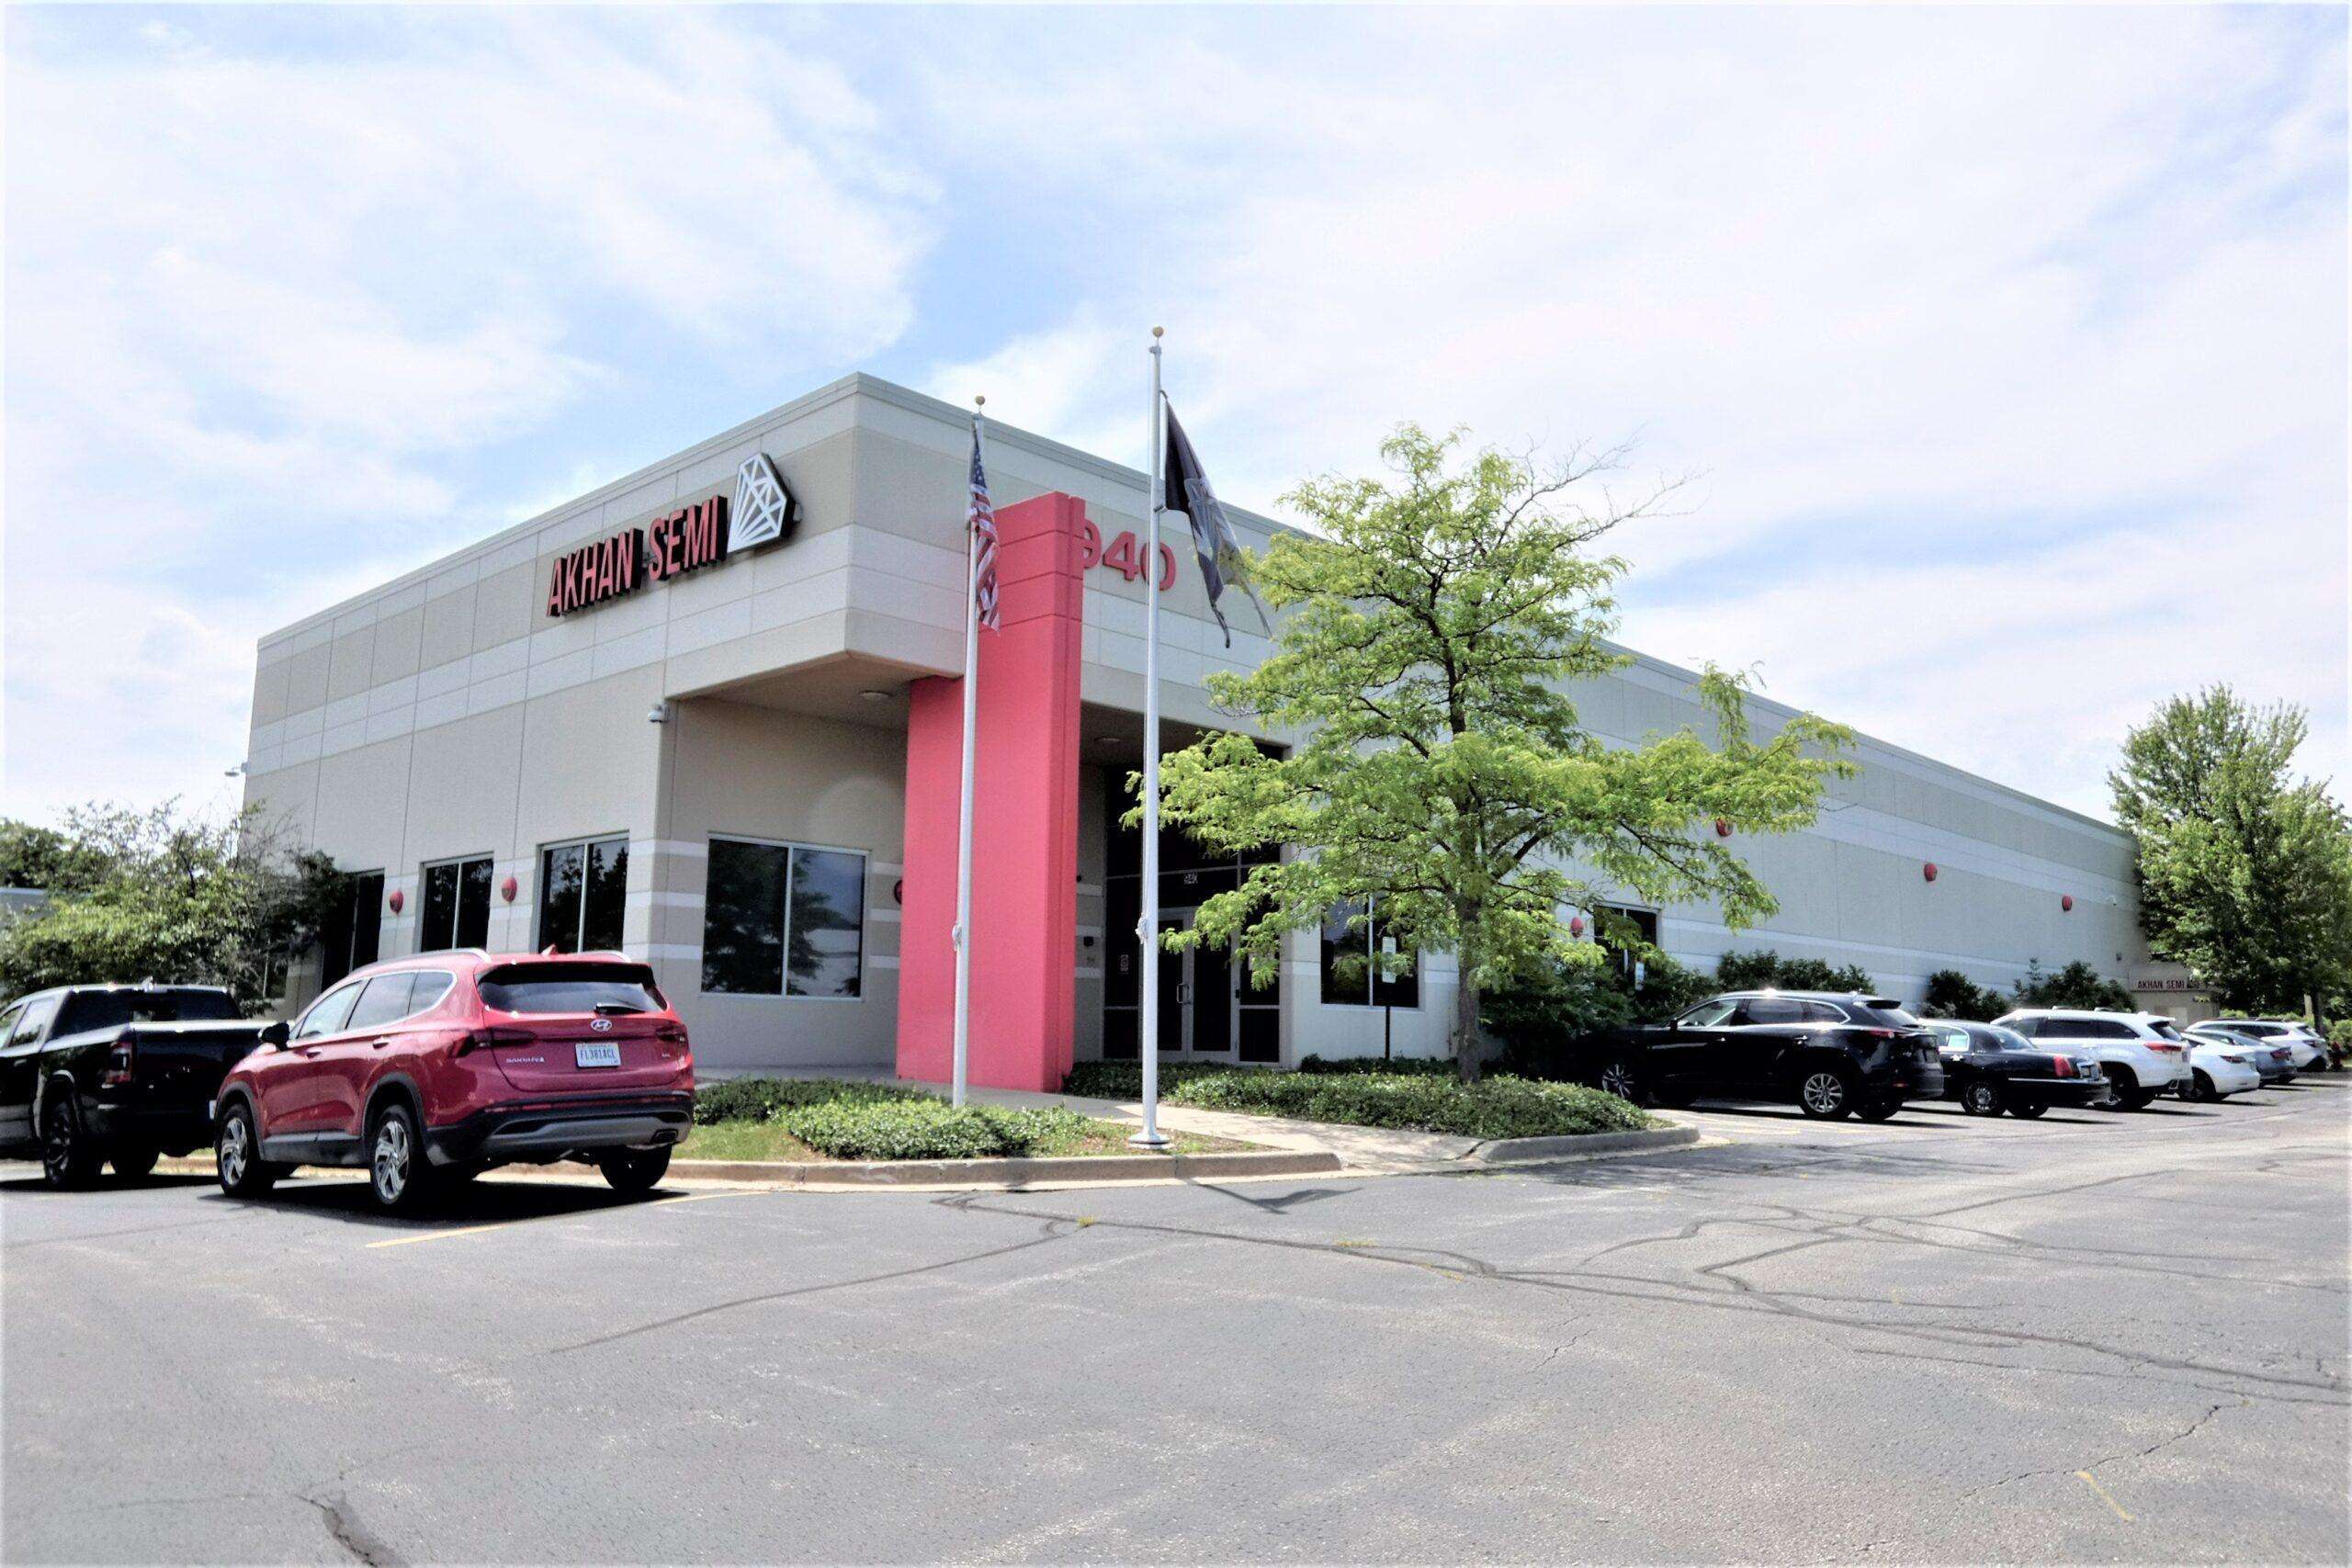
Akhan Semi

Absolute NNN Leased Industrial | Akhan Semiconductor
940 Lakeside Drive | Gurnee, IL 60031
Exp Commercial is proud to present to market an excellent opportunity to acquire an absolute NNN-leased state-of-the-art industrial manufacturing facility with zero landlord responsibilities at a below-market price with future upside in market rents and potential tenant expansion.
Listing Agent: Randolph Taylor 630.474.6441 | rtaylor@creconsult.net
https://www.creconsult.net/absolute-nnn-leased-industrial-akhan-semiconductor-gurnee-il/

Off-Market Multifamily Sellers Are Leaving A Ton Of Money On The Table

Off-Market Multifamily Sellers Are Leaving A Ton Of Money On The Table

Marketing a property can increase the sale price by up to 23%, which runs counter to the idea that off-market deals can achieve higher values because a buyer will be more aggressive to seal a trade.

The perception is when a seller has one buyer vying for an asset, that buyer is more aggressive and willing to pay a premium because they don’t want the seller to get into a bidding war for the property. Our research found the opposite.

This is a sign it is in the best interests of owners to undergo a marketing campaign for their properties. Growing allocations from institutional investors toward real estate are still driving a sizable pool of investors into bidding for multifamily assets, and a full campaign is what drives the premiums.

The job of a broker to create a competitive environment on behalf of the seller. Putting a building on the market determines the strongest buyer.

That may not be necessarily based on price alone. If one buyer has a higher-priced offer but weak financial backing, versus a buyer with a stronger track record, taking a lower offer is the way to go. It’s our job to give the seller those options and we do that by marketing properties and generating the highest number of qualified offers possible.

There are numerous case studies where a seller received an off-market bid, put it on the market, and the off-market buyer still bought the asset but at a higher price.


Have you thought of selling your property and would like to know what it's worth? Request a valuation for your property below:

Request Valuation

eXp Commercial Chicago Multifamily Brokerage focuses on listing and selling multifamily properties throughout the Chicago Area and Suburbs.

We don’t just market properties; we make a market for each property we represent. Each offering is thoroughly underwritten, aggressively priced, and accompanied by loan quotes to expedite the sales process. We leverage our broad national marketing platform syndicating to the top CRE Listing Sites for maximum exposure combined with an orchestrated competitive bidding process that yields higher sales prices for your property.


https://www.creconsult.net/market-trends/off-market-multifamily-sellers-are-leaving-a-ton-of-money-on-the-table/

The Cap Rate: What You Should Know

The capitalization rate is a fundamental concept in the commercial real estate industry. Yet, it is often misunderstood and sometimes incorrectly used. This post will take a deep dive into the concept of the cap rate, and also clear up some common misconceptions.

Cap Rate Definition

What is a cap rate? The capitalization rate, typically just called the cap rate, is the ratio of Net Operating Income (NOI) to property asset value. So, for example, if a property recently sold for $1,000,000 and had an NOI of $100,000, then the cap rate would be $100,000/$1,000,000, or 10%.

The cap rate formula can also be re-arranged to solve for value:

Appraisers frequently use this relationship to estimate the market value for a property based on a cap rate derived from comparable sales.

Cap Rate Example

Let’s take an example of how a cap rate is commonly used. Suppose we are researching the recent sale of a Class A office building with a stabilized Net Operating Income (NOI) of $1,000,000, and a sale price of $17,000,000. In the commercial real estate industry, it is common to say that this property sold at a 5.8% cap rate.

To estimate the market value for a property, an appraiser might use several recent sales like this to derive a market-based cap rate for Class A office buildings. Suppose our Class A office building generates a stabilized NOI of $900,000, and we want to know what the building is worth. If an appraiser derives a market-based cap rate of 6% for our market, then we can divide our $900,000 NOI by 6% to estimate a market value of $15,000,000.

Intuition Behind the Cap Rate

What is the cap rate actually telling you?  One way to think about the cap rate intuitively is that it represents the percentage return an investor would receive on an all cash purchase.  In the above example, assuming the real estate proforma is accurate, an all-cash investment of $17,000,000 would produce an annual return on investment of 5.8%.

Another way to think about the cap rate is that it’s just the inverse of the price/earnings multiple.  To find the NOI multiple for a particular cap rate, just divide 1 by the cap rate. For example, a 5% cap rate results in a value of 1/.05 or 20x NOI. Consider the following chart:

As shown above, cap rates and NOI multiples are inversely related.  In other words, as the cap rate goes up, the NOI multiple goes down.

What is a Good Cap Rate?

What’s a good cap rate? The short answer is that it depends on how you are using the cap rate. For example, if you are selling a property, then a lower cap rate is good because it means the value of your property will be higher. On the other hand, if you are buying a property then a higher cap rate is good because it means your initial investment will be lower.

You might also be trying to find a market-based cap rate using recent sales of comparable properties. In this case, a good cap rate is one that is derived from similar properties in the same location. For example, suppose you want to figure out what an office building is worth based on a market-derived cap rate. In this case, a good cap rate is one that is derived from recent office building sales in the same market. A bad cap rate would be one derived from different property types in different markets.

When, and When Not, to Use a Cap Rate

The cap rate is a very common and useful ratio in the commercial real estate industry, and it can be helpful in several scenarios.  For example, it can and often is used to quickly size up an acquisition relative to other potential investment properties.  A 5% cap rate acquisition versus a 10% cap rate acquisition for a similar property in a similar location should immediately tell you that one property has a higher risk premium than the other.

Another way cap rates can be helpful is when they form a trend.  If you’re looking at cap rate trends over the past few years in a particular submarket, then the trend can give you an indication of where that market is headed.  For instance, if cap rates are compressing, that means values are being bid up and a market is heating up. Where are values likely to go next year?  Looking at historical cap rate data can quickly give you insight into the direction of valuations.

While cap rates are useful for quick back of the envelope calculations, it is important to note when cap rates should not be used. When properly applied to a stabilized Net Operating Income (NOI) projection, the simple cap rate can produce a valuation approximately equal to what could be generated using a more complex discounted cash flow (DCF) analysis. However, if the property’s net operating income stream is complex and irregular, with substantial variations in cash flow, only a full discounted cash flow analysis will yield a credible and reliable valuation.

Components of the Cap Rate

What are the components of the cap rate, and how can they be determined?  One way to think about the cap rate is that it’s a function of the risk-free rate of return plus some risk premium.  In finance, the risk-free rate is the theoretical rate of return of an investment with no risk of financial loss.  Of course, in practice, all investments carry even a small amount of risk. However, because U.S. bonds are considered to be very safe, the interest rate on a U.S. Treasury bond is normally used as the risk-free rate. How can we use this concept to determine cap rates?

Suppose you have $10,000,000 to invest, and 10-year treasury bonds are yielding 3% annually. This means you could invest all $10,000,000 into treasuries, considered a very safe investment, and spend your days at the beach collecting checks. What if you were presented with an opportunity to sell your treasuries and instead invest in a Class A office building with multiple tenants? A quick way to evaluate this potential investment property relative to your safe treasury investment is to compare the cap rate to the yield on the treasury bonds.

Suppose the acquisition cap rate on the investment property was 5%.  This means that the risk premium over the risk-free rate is 2%.  This 2% risk premium reflects all the additional risk you assume over and above the risk-free treasuries, which considers factors such as:

  • Age of the property.
  • Creditworthiness of the tenants.
  • Diversity of the tenants.
  • Length of tenant leases in place.
  • Broader supply and demand fundamentals in the market for this particular asset class.
  • Underlying economic fundamentals of the region including population growth, employment growth, and inventory of comparable space on the market.

When you take all of these items and break them out, it’s easy to see their relationship with the risk-free rate and the overall cap rate. It’s important to note that the actual percentages of each risk factor of a cap rate and ultimately the cap rate itself are subjective and depend on your own business judgment and experience.

Is cashing in your treasuries and investing in an office building at a 5% acquisition cap rate a good decision?  This, of course, depends on how risk averse you are.  An extra 2% yield on your investment may or may not be worth the additional risk inherent in the property. Perhaps you can secure favorable financing terms and using this leverage you could increase your return from 5% to 8%.  If you are a more aggressive investor, this might be appealing to you.  On the other hand, you might want the safety and security that treasuries provide, and a 3% yield is adequate compensation in exchange for this downside protection.

Band of Investment Method

The above risk-free rate approach is not the only way to think about cap rates.  Another popular alternative approach to calculating the cap rate is to use the band of investment method.  This approach considers the return to both the lender and the equity investors in a deal.

The band of investment formula is simply a weighted average of the return on debt and the required return on equity.  For example, suppose we can secure a loan at an 80% Loan to Value (LTV), amortized over 20 years at 6%.  This results in a mortgage constant of 0.0859.  Further, suppose that the required return on equity is 15%.  This would result in a weighted average cap rate calculation of 9.87%:

The Gordon Model

One other approach to calculating the cap rate worth mentioning is the Gordon Model. If you expect NOI to grow each year at some constant rate, then the Gordon Model can turn this constantly growing stream of cash flows into a simple cap rate approximation.  The Gordon Model is a concept traditionally used in finance to value a stock with dividend growth:

This formula solves for value, given cash flow, the discount rate, and a constant growth rate. From the definition of the cap rate, we know that value equals NOI divided by the cap rate. This means that the cap rate can be broken down into two components, the discount rate, and the growth rate.  That is, the cap rate is simply the discount rate minus the growth rate.

How can we use this? Suppose we are looking at a building with a stabilized NOI of $100,000 and in our analysis, we expect that the NOI will increase by 1% annually.  How can we determine the appropriate cap rate to use?  Using the Gordon Model, we can simply take our discount rate and subtract out the annual growth rate.  If our discount rate (usually the investor’s required rate of return) is 10%, then the appropriate cap rate to use in this example would be 9%, resulting in a valuation of $1,111,111.

The Gordon Model is a useful concept to know when evaluating properties with growing cash flows.  However, it’s not a one-size fit all solution and has several built-in limitations.  For example, what if the growth rate equals the discount rate?  This would yield an infinite value, which of course is nonsensical. Alternatively, when the growth rate exceeds the discount rate, then the Gordon Model yields a negative valuation, which is also a nonsensical result.

These built-in limitations don’t render the Gordon Model useless, but you do need to be aware of them.  Always make sure you understand the assumptions you are making in an analysis and whether they are reasonable or not.

Cap Rate Cheat Sheet

Fill out the quick form below and we’ll email you our free cap rate Excel cheat sheet containing helpful calculations from this article.

The Many Layers of Valuation

Commercial real estate valuation is a multi-layered process and usually begins with simpler tools than the discounted cash flow analysis. The cap rate is one of these simpler tools that should be in your toolkit.  The cap rate can communicate a lot about a property quickly, but can also exclude many important factors in a valuation, most notably the impact of irregular cash flows.

The solution is to create a multi-period cash flow projection that considers these changes in cash flow, and ultimately run a discounted cash flow analysis to arrive at a more accurate valuation.


Source: The Cap Rate: What You Should Know

https://www.creconsult.net/market-trends/the-cap-rate-what-you-should-know/

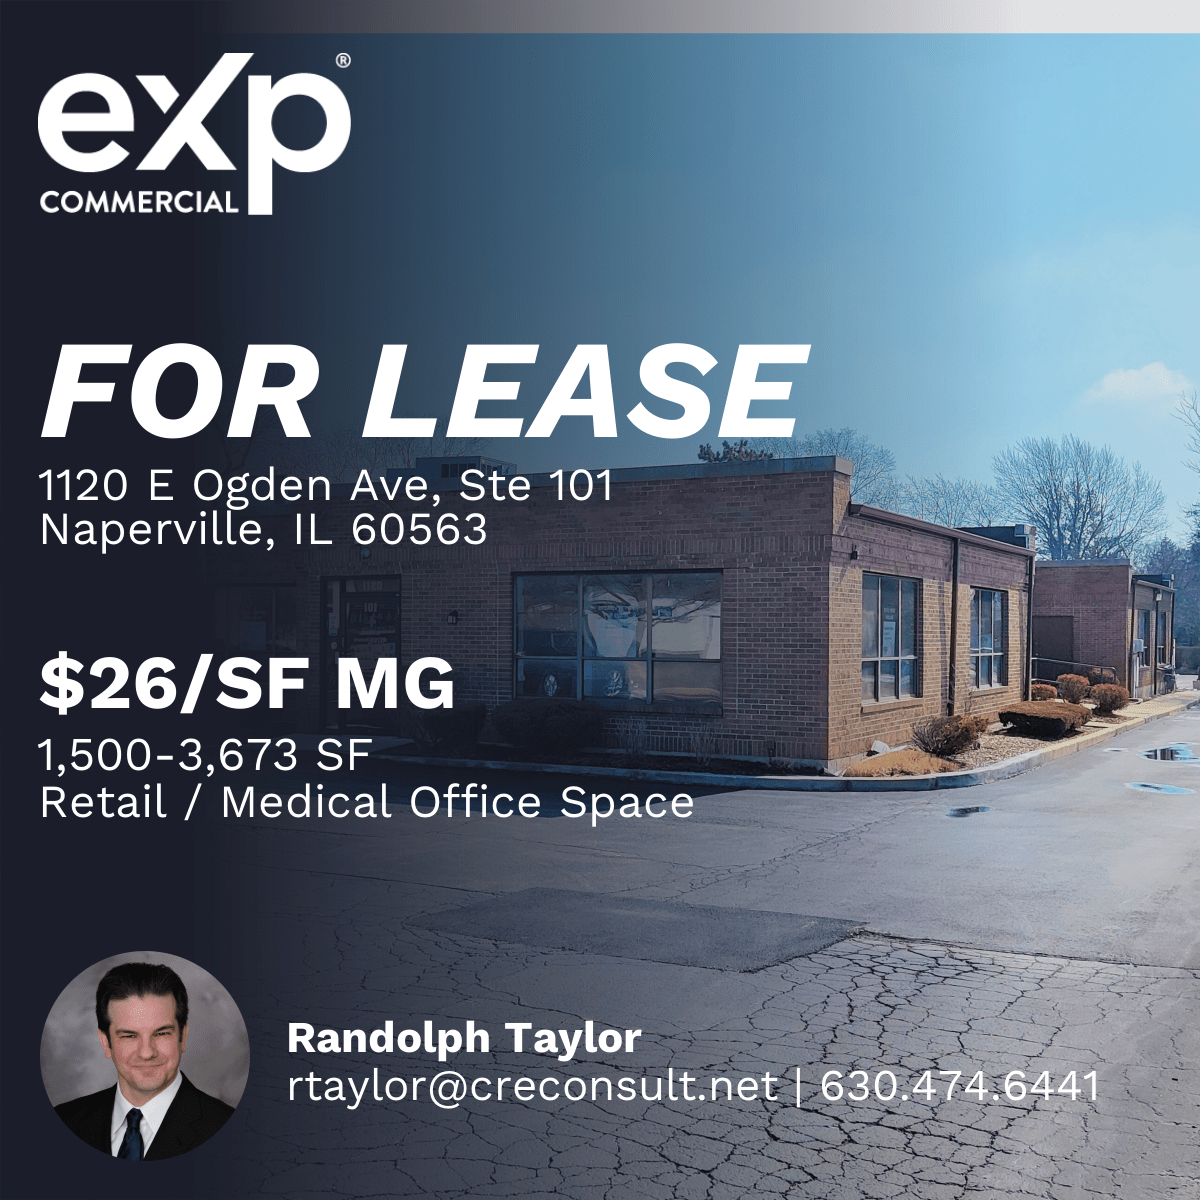
1120 E Ogden

Retail / Medical Office Space for lease in Naperville, IL
1,500–3,673 SF | $26/SF MG
1120 E Ogden Ave., Suite 101, Naperville, IL 60563
Broker: Randolph Taylor, rtaylor@creconsult.net, 630.474.6441

https://www.creconsult.net/retail-office-for-lease-1120-e-ogden-ave-suite-101-naperville-il-60563/

Thursday, August 3, 2023

The Real Estate Proforma: A Beginner's Guide

The first task in any real estate investment decision is to build a proforma, which is just a word that means cash flow projection. In this guide, we will define the term proforma, look at an example of a simple real estate proforma, review a more complicated real estate proforma, and also discuss some nuances you may see in the real world.

What is a Proforma in Real Estate?

First, what does proforma mean in real estate? In real estate, the word proforma simply means cash flow projection. The word “pro forma” is Latin for “as a matter of form” and it is a term used to describe the document that lays out a cash flow forecast. The real estate proforma is important because it shows a forecast of all sources of income and expenses for a property, as well as a bottom-line cash flow figure.

Sometimes you will see this term written with two words as “pro forma” and other times you will see it written more concisely as “proforma”. Both are commonly used in the commercial real estate industry and have the same meaning.

How to Create a Simple Real Estate Proforma

We’ll go through a more detailed example below, but first let’s start with the basic real estate proforma format. This is often what will be created during a back of the envelope analysis, before moving on to a more detailed projection. A proforma can be completed for a single period of time, such as a year, or over multiple time periods. At a high level, a simple proforma is often structured like this:

Let’s look closer at each of these line items.

Potential Gross Income is the primary potential source of income a property could generate if it were 100% occupied. In practice, this consists of income from contractual leases in place, and if a space is vacant then an estimate for market rent is used.

Vacancy is a deduction that accounts for unoccupied space in the building, and Credit Loss is a deduction for non-payment by tenants. These deductions are commonly expressed as a percentage of Potential Gross Income.

The Effective Gross Income is what’s left over after deducting vacancy and credit loss from Potential Gross Income.

Operating Expenses for a commercial property consist of all expenses required to operate the property. Major categories of expenses include property taxes, insurance, maintenance, janitorial, utilities, management, etc.

The Net Operating Income (NOI) is what’s left over after subtracting out operating expenses from the Effective Gross Income. The Net Operating Income, often abbreviated as NOI, is one of the most widely used metrics for a property.

Other Expenses deducted from the net operating income typically include capital expenditures and loan payments. Capital Expenditures are major expenses required to maintain or add value to the property. These could include the replacement of heating and ventilation systems (HVAC), roof replacement, re-paving a parking lot, etc. Debt Service or loan payments are also deducted from NOI.

Finally, the Before Tax Cash Flow is what’s left over after deducting any additional below NOI expenses such as loan payments or capital expenditures.

Simple Real Estate Proforma Example

A real estate proforma is often completed for the first year of operations for a stabilized property. Stabilized in this sense just means the property has achieved its long term expected occupancy. This proforma can then be used to quickly calculate some back of the envelope return metrics.

One Year Proforma

Here’s an example of a simple back of the envelope proforma for a single year:

Commercial real estate investors, brokers, lenders, and appraisers often use the net operating income from a simple proforma like this to estimate a property’s market value using the capitalization rate.

Multi-period Proforma

A simple proforma can also be completed over multiple years:

A multi-period proforma like this is used to estimate cash flows over the entire holding period and gives a more complete perspective on future investment performance. It allows you to analyze different scenarios such as the best case, worst case, and most likely case. You can also calculate financial ratios such as the cash on cash return, equity multiple, operating expense ratio, etc. over the entire holding period.

Future Sale Proceeds

An estimate of the future sale proceeds will also need to be calculated in a multi-period proforma. In the commercial real estate industry, future sale proceeds are commonly referred to as the reversion or disposition cash flow, to distinguish from the ongoing operating cash flows of the property.

One way to calculate the disposition price is by applying a cap rate to the net operating income in the final year in the holding period. It is also common to use the NOI for the year after the final year in the holding period, since this will be the first year of NOI for the new buyer. Selling costs such as broker commissions, legal work, etc. can then be estimated and deducted from the future sale price to calculate net sale proceeds.

In the example above, the year 6 NOI is 69,556. We apply our estimated market cap rate of 7% at the time of sale to estimate a future sale price of 993,663. From this, we deduct our estimated selling costs of 6% to arrive at net sale proceeds of 924,107.

Once the future sale proceeds are forecasted along with the operating and investment cash flows, a discounted cash flow analysis can be completed to calculate the Internal Rate of Return (IRR), Net Present Value (NPV), and Modified Internal Rate of Return (MIRR).

Next, let’s add some more context to this discussion and look closer at a more complicated real estate proforma.

Download Real Estate Proforma Now

Fill out the quick form below and we’ll email you your free real estate proforma template.

How To Create a Detailed Commercial Real Estate Proforma

A more complicated commercial real estate proforma will follow the same basic structure discussed above, but will include more detail. Before we dive into an example, it is important to note that the way a proforma is presented in practice will often vary from one project to another. This variation could be driven by differences in the property type, complexity of the project, time frame, sophistication of the parties involved, intended audience, and any other unique circumstances.

For example, a multifamily development proforma will not look exactly like an already built hotel proforma because these are different property types in different stages of completion with different sources of income. The same is true for a condominium project with individual units for sale versus a building occupied by a single tenant with a triple net lease.

For most commercial properties, tenants sign long-term leases that spell out in painstaking detail all the income a landlord will receive. These leases contain all the details needed to reliably forecast tenant income for years into the future. The key is to translate this information “lease by lease” to create a more accurate cash flow projection.

As you can imagine, analyzing a property lease by lease is also more complicated and time-consuming. Leases often contain different terms and conditions, with inconsistent requirements for rent, rent increases, or reimbursements. These differences occur because leases are created at different times, often by different landlords, under different market and tax environments, and are negotiated to reflect the specific needs of each party. To make this process faster and easier, many commercial real estate professionals use specialized lease by lease analysis software.

With that said, let’s take a look at what a more detailed proforma looks like for an office, retail, or industrial property:

A more complicated proforma like this can be completed for a single year or over multiple years, and is often prepared on a monthly basis. You’ll notice these line items are similar to the simple proforma structure discussed above, but include some extra detail. Let’s take a closer look.

Detailed Commercial Real Estate Proforma Example

To understand how to read a proforma like this, let’s discuss each of these line items.

Potential Rental Income

  • This is the amount of base rent the property could generate if it were 100% occupied.
  • For simple proformas it is calculated by taking the average base rent per square foot in a property and multiplying it by the total rentable square feet. For example, if you have a 10,000 square foot property and the average rent per square foot is $10, then you could calculate a back of the envelope Potential Rental Income of $100,000.
  • For more detailed proformas this is calculated “lease by lease”. This entails entering data from each tenant lease from the rent roll using lease by lease analysis software. This will forecast all income under each lease, considering lease start and end dates, rent increases, reimbursement structures, market leasing assumptions after the lease expires, and more.
  • Since commercial real estate leases spell out in detail all the income that will be received from tenants in place, creating a proforma lease by lease like this results in a more reliable and accurate forecast.
  • Once all the base rent has been calculated for all existing leases in place, then an estimate can be used for any remaining vacant space, including how long it will take for the property to absorb or lease up the unoccupied units. These estimates are informed by a real estate market analysis. This is all added together to show what the potential rental income is for a property, using both in place leases and speculative leases for vacant space.

Absorption and Turnover Vacancy

  • Absorption is the actual vacancy of the property due to the time it takes to lease up vacant space.
  • Turnover vacancy is the downtime between leases that occurs when an existing tenant does not renew its lease, and therefore the unit sits empty until a new tenant is found.
  • For simple proformas a detailed absorption and turnover vacancy calculation is usually not considered. Instead, a general vacancy deduction is often used, which we’ll cover in more detail below.
  • For more detailed proformas, once all the leases have been entered, this can be automatically calculated based on the actual vacancies that occur according to the lease start and lease end dates.
  • Since the Potential Rental Income line item calculates rent assuming a property is 100% occupied, this absorption and turnover vacancy line item is important because it will completely offset the potential rent shown for the space that is actually unoccupied.

Free Rent

  • This is the dollar amount of free rent, also known as abatement or concessions, sometimes given to tenants to motivate them to sign a lease.
  • It is another deduction made to the Potential Rental Income to figure out the actual money received by the landlord or owner of the property.

Base Rental Income

  • This is calculated by taking the top-line Potential Rental Income and deducting absorption and turnover vacancy and free rent.
  • It shows the amount of base rent that is expected to be collected or realized by a landlord or owner.

Reimbursement Income

  • Tenant leases in office, industrial, and retail properties usually have some sort of expense reimbursement structure. Reimbursements are paid by the tenant to the landlord to cover some or all of the operating expenses for a property.
  • The reimbursement line items on a proforma show what the expected reimbursement amount is for all tenants based on the forecasted operating expenses.
  • Depending on the lease, these reimbursement structures can range from simple to surprisingly complex.
  • Leases are often categorized as gross leases, modified gross leases, or net leases. Gross leases mean the landlord is responsible for paying all operating expenses for the property. Net leases mean the tenants are responsible for paying all operating expenses. Modified gross leases require both the landlord and the tenant to each pay for a portion of the operating expenses. However, to truly understand who is responsible for paying what, it is important to always read the lease.

Other Income

  • Other income is other ancillary income generated by the property. For example, this could include vending, laundry, parking, event income, etc.
  • Other income can be either fixed or variable. A fixed amount means that it does not change with the occupancy of the property. An example of a fixed other income item might be income collected from leasing out a billboard or an antenna on the property.
  • This contrasts with a variable income item, which does change with the occupancy of the property. For example, parking income or laundry income might change depending on how many tenants occupy the property. Variable income items will be higher as the occupancy of a property increases, and lower as occupancy decreases.
  • Other income items will include a percentage to indicate how much of that particular income item is fixed. For example, an ancillary income item that is 100% fixed will not vary at all with the occupancy of a property. An ancillary income item that is 0% fixed will completely vary with the occupancy of the property (in other words, it is 100% variable). And an ancillary income item that is 50% fixed would only partially vary with occupancy.
  • Analyzing existing operating statements for a property can help when estimating how much of an ancillary income item is fixed vs variable.

Total Gross Income

  • This is the gross income from a property after accounting for actual vacancies, concessions, reimbursements, and all other income.
  • This shows the gross income a landlord or owner can expect to generate, before considering any general vacancy or credit loss deductions.

General Vacancy

  • The general vacancy factor is a deduction against income to account for vacancy in the property.
  • This is often expressed as a percentage of Total Gross Income, but could also be based on other income line items depending on the situation.
  • If a lease by lease analysis is completed for all existing leases in place and speculative leases are created for all vacant space, then the general vacancy factor is often not considered at all. This is because the forecast already includes absorption and turnover vacancy which is based on actual leases in place, as well as estimates for leasing up vacant space and re-leasing space for tenants who vacate the property.
  • Sometimes a general vacancy factor could still be used as an additional contingency over and above the actual absorption and turnover vacancy. This is often used to ensure the property is in line with the overall market vacancy rate. For example, if you know that the market vacancy rate is 10%, then you may want to include this as a minimum vacancy rate for the property.
  • This is accomplished by first taking Total Gross Income and then adding back any Absorption and Turnover Vacancy. This is added back because we don’t want to double count it when applying a general vacancy factor against the total income.
  • Then the General Vacancy rate is multiplied by this total income (with the add back) which gives you the amount of general vacancy calculated using only the general vacancy rate and not considering any absorption and turnover vacancy.
  • The actual absorption and turnover vacancy is then deducted from the calculated general vacancy amount. If the result is less than 0 then only the absorption and turnover vacancy is shown on the proforma because that means the actual vacancy for the property is higher than the minimum general vacancy factor.
  • If the result exceeds 0, then this result (general vacancy minus absorption and turnover vacancy) is shown on the proforma because that means the actual vacancy for the property was not as high as the general vacancy factor.
  • This ensures that the proforma always shows vacancy at the greater of actual vacancy projected (absorption and turnover), or the desired general vacancy factor.
  • Since these calculations can get tedious and hard to understand in an Excel model, commercial real estate analysis software is typically used for this kind of analysis.

Credit Loss

  • Credit loss is a deduction to account for any tenant who does not pay their rent.
  • This is often expressed as a percentage of Total Gross Income.
  • This can often be estimated based on the historical operating statements for a property.

Effective Gross Income (EGI)

  • The Effective Gross Income is the Total Gross Income for a property minus the General Vacancy and Credit Loss estimates.
  • This shows the gross income a landlord or owner can expect to receive from a property.
  • Property management fees will often be based on the Effective Gross Income because if the property manager can decrease the vacancy, credit loss, and concessions, then their management fee will be higher.

Operating Expenses

  • Operating expenses for a property fall into two categories: fixed and variable.
  • Fixed expenses are expenses that do not vary with the occupancy of the property. For example, these could include property taxes and insurance expenses because these will be the same, no matter how many tenants occupy the property.
  • Variable expenses are expenses that vary with the occupancy of the property. For example, these could include janitorial or utility costs, since more cleaning and more energy will be required as occupancy increases.
  • Operating expenses will include a percentage to indicate how much of that particular expense is fixed. For example, an expense that is 100% fixed will not vary at all with the occupancy of a property. An expense that is 0% fixed will completely vary with the occupancy of the property (in other words, it is 100% variable). An expense that is 50% fixed would only partially vary with occupancy.
  • The amount of an operating expense as well as how much it varies can be estimated by looking at the historical operating statements for an existing property over the trailing 12 or 24 months.

Net Operating Income (NOI)

  • Net Operating Income is the Effective Gross Income for a property, minus any operating expenses. It represents the operating cash flow for the property.
  • Net Operating Income is a widely used metric in commercial real estate valuation.

Capital Expenditures

  • Capital expenditures are expenditures used to improve the condition of the property itself. Capital expenditures could include a roof replacement, parking lot resurfacing, new HVAC units, etc.
  • Capital expenditures differ from operating expenses because they are not required on an ongoing basis for the property to operate.
  • Often there will be a Reserves for Replacement line item that is an amount of money set aside to pay for future capital expenditures.
  • There is some debate about whether reserves for replacement should be included in Net Operating Income by commercial real estate professionals.

Debt Service

  • Debt service or payments for loans used to finance the property are deducted below Net Operating Income.
  • This deduction occurs below NOI because it represents an owner-specific expense and not a property level expense. Since different owners have different lender relationships, net worths, income, etc. that means some owners will be able to secure more favorable financing than others.

Cash Flow Before Tax

  • This is the bottom-line cash flow an owner of a property can expect to collect before any deductions for taxes.
  • While there are many tax benefits to owning commercial real estate, most analysis stops at cash flow before tax due to the complexities of accurately calculating tax liabilities for individual owners in a property. For now, this is outside the scope of this article.

Conclusion

In this article, we defined the real estate proforma, discussed the basic structure of a simple real estate proforma, looked at an example of a single year proforma and also a multi-year proforma, and then walked through a more complicated example of a lease by lease commercial real estate forecast.

Source: The Real Estate Proforma: A Beginner’s Guide

https://www.creconsult.net/market-trends/the-real-estate-proforma-a-beginners-guide/

Wednesday, August 2, 2023

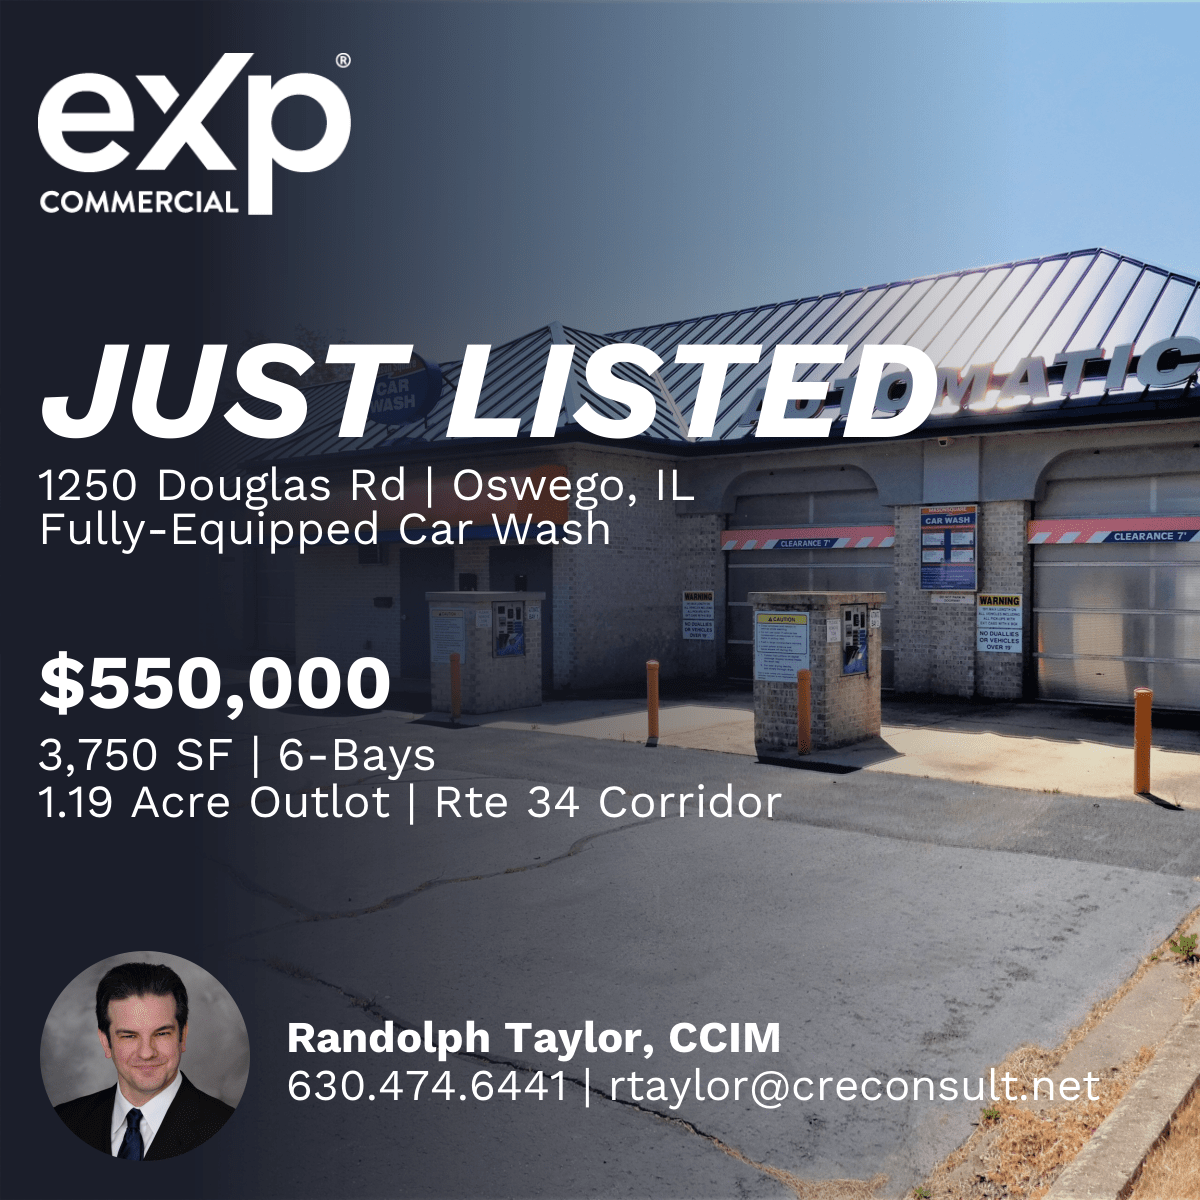
Mason Square

Fully Equipped Car Wash For Sale
1250 Douglas Rd. | Oswego, IL | 3,750 SF | 6 Bays | 1.19 Acres
Mason Square Car Wash, a fully equipped and operational 6-bay carwash in southwest suburban Chicago’s Oswego, IL. Ideally located on an out-lot of the Mason Square Shopping Center along heavily trafficked Route 34, averaging 45,000 vehicles per day,
Listing Agent: Randolph Taylor 630.474.6441 | rtaylor@creconsult.net
https://www.creconsult.net/fully-equipped-car-wash-oswego-il-route-34/

Multifamily Investment Opportunity – Showings Scheduled Join us for a showing of two fully occupied, cash-flowing multifamily properties ide...