Tuesday, August 8, 2023

Multifamily sellers: How to qualify a buyer before going under contract

Multifamily sellers: How to qualify a buyer before going under contract

Multifamily sellers: How to qualify a buyer before going under contract

Don’t waste time and opportunities: learn how to select the right buyer every time

As the seller of a multifamily asset, it’s crucial that the buyer you select is the best possible prospect for your property. Don’t waste time, money, and opportunities: you must ensure they’re qualified and can close and execute the contract as signed.

Keep reading to learn why it’s essential to qualify a buyer before going under contract on your multifamily property and how to do it.

Why do I need to qualify a buyer?

It’s important to close with the first buyer you select. If you don’t, each buyer after that will ask themselves, “What did that other buyer discover about this property that I am missing?”.

When you enter into a contract with a refundable deposit, you’re basically giving your chosen buyer a free option on your property for a period of time, typically 30–60 days. Before you proceed, you must be confident that they can close and execute the contract as signed.

What’s more, your tenants and staff will be disturbed throughout the contract process. To minimize the period of disruption, you should do all you can to ensure the transaction will close successfully at the end of the contract process.

As a seller, you’re required to provide due diligence information to the prospective buyer. When you qualify your buyer, you’ll greatly reduce the risk of wasting a lot of time and doing a lot of work only to not close on the property.

How do I qualify a buyer?

Before you sign the contract, make sure that your prospective buyer can provide certain items. Always ask them for the following:

– Proof of funds

– Lender pre-qualification

– A list of the other properties they own

– A list of the sellers and agents that they have worked with

For added reassurance, it’s recommended that you call the buyer’s lender to confirm their pre-qualified status. You can also call the agents, sellers, and buyers they’ve closed with in the past to enquire about how the transactions went.

Has the buyer toured the property in person before making an offer? Have they reviewed the due diligence information beforehand? If they have, this is a great sign. It’s proof that they have seen and have taken into account any issues with your property, and this greatly reduces the chances that they may later want to back out of the sale, saying they were unaware of the building’s condition. Be very wary of a buyer who doesn’t tour your property in person.

A prospective buyer who shows they’re motivated and wants to move quickly is also a great sign for a successful closing. The shorter the due diligence period, the better, and the larger the deposit, the better.

When you spend the time making sure your prospective buyer fulfills these criteria, you’ll put yourself in a great position to close successfully and ensure a quick and smooth transaction.

If you need help selling your multifamily property, eXp Commercial is here. Our objective as your multifamily advisor is to help you achieve your investment goals: from determining the listing price to selecting the best buyer and handling the sale process through to the closing, we’ll facilitate a smooth transaction for you.


Source: Multifamily sellers: How to qualify a buyer before going under contract

https://www.creconsult.net/market-trends/multifamily-sellers-how-to-qualify-a-buyer-before-going-under-contract/

Mason Square

Fully Equipped Car Wash For Sale
1250 Douglas Rd. | Oswego, IL | 3,750 SF | 6 Bays | 1.19 Acres
Mason Square Car Wash, a fully equipped and operational 6-bay carwash in southwest suburban Chicago’s Oswego, IL. Ideally located on an out-lot of the Mason Square Shopping Center along heavily trafficked Route 34, averaging 45,000 vehicles per day,
Listing Agent: Randolph Taylor 630.474.6441 | rtaylor@creconsult.net
https://www.creconsult.net/fully-equipped-car-wash-oswego-il-route-34/

Apartment Investing Case Study

In this article we are going to conduct an investment analysis on a 140 unit apartment building acquisition. We’ll walk through the process of forecasting cash flows and also explain the calculations needed to determine investment value. Read on as we take a deep dive into the world of apartment investing.

Apartment Investment Case Study Objectives

First, before we jump into the details of this investment analysis, let’s quickly go over our objectives. Here’s what we’ll accomplish in this case study:

  • Forecast the before tax cash flows over a 5 year holding period for a 140 unit apartment building.
  • Calculate the maximum supportable loan amount based on the debt service coverage ratio and the loan to value ratio.
  • Calculate the gross rent multiplier.
  • Calculate the cash on cash return.
  • Calculate the debt service coverage ratio.
  • Complete a discounted cash flow analysis to determine the levered and unlevered internal rate of return (IRR) and net present value (NPV).
  • Stress test the vacancy rate to analyze how it impacts cash flow.
  • Stress test the vacancy rate to analyze how it impacts the debt service coverage ratio.
  • Stress test the loan interest rate to analyze how it impacts the debt service coverage ratio.

Apartment Investment Case Study Scenario

An investor is considering buying an apartment building with 140 units offered for sale at $16,500,000. The subject apartment building has the following unit mix: 

Additionally, the following assumptions are also being made by the investor in order to construct a 5-year cash flow proforma:

Vacancy and Credit Loss
In the current market, vacancy and credit losses are running at 9%. Due to the improving market conditions as well as the investor’s prior experience leasing and operating multifamily buildings, it’s expected that vacancy will steadily decline over the next 5 years to 5%.

Potential Rental Income
Potential rental income is based on the above unit mix. The 1-bedroom and studio rental rates are expected to increase at 2% annually. The 2-bedroom units are also expected to increase at 2% annually.

Financing
After a preliminary discussion with a relationship manager at a local bank it’s determined that a loan can be extended based on the lesser of a 1.25x debt service coverage ratio or 80% loan to value. Additionally, assuming the underwriting process doesn’t reveal any red flags, it’s expected that the loan will be based on a 20 year amortization and a 6% interest rate.

Operating Expenses
The following table breaks out historical operating expenses for the property as well as projected increases over the holding period.

Reserves for Replacement
In addition to the above operating expenses a reserve for replacement of $250 per unit will also be included in this analysis.

Sales Price and Cost of Sale
The projected sale price is estimated by applying a conservative 3% annual growth rate to the acquisition price of the property over the 5 year holding period. Additionally, a 6% cost of sale is factored into the net sales proceeds to account for selling costs.

Acquisition Costs
In addition to the $16,500,000 purchase price, an additional $50,000 is factored in to account for closing costs.

Discount Rate
For the purposes of this case study we’ll assume that the investor’s discount rate, or required rate of return, is 15%.

Apartment Investment Proforma

Using the above assumption we can now build a proforma for the proposed apartment investment property. This can be accomplished in Excel in a few hours, or in our case we did this entire analysis in less than 10 minutes.

Now that we have a 5 year proforma, let’s take a look at what the maximum supportable loan amount is based on these cash flows. Using the above 1.25x DSCR and 80% LTV assumptions we get the following:

As shown above, the maximum loan analysis based on year 1 proforma NOI is about $12,250,000. Assuming we can get this loan amount approved at the 6% rate amortized over 20 years, this is the updated proforma:

apartment investing proforma with leverage

You’ll notice that the debt we added to the property reduced our cash flow significantly, however, this also reduces our equity requirement and therefore improves yield. We’ll discuss this in more detail below, but first let’s take a look at some quick ratios:

Year 1 cash on cash return is 6.14%. At first glance this is well below our target rate of return of 15%, However, because the cash on cash return only takes into account a single year instead of the entire holding period, the IRR and NPV below will be much more relevant for our purposes.

The gross rent multiplier is 7.58x, which taken by itself doesn’t mean much. However, assuming we have some other submarket data to compare this to we can check whether or not it’s in line with comparable properties. The important take away here is to check whether or not the gross rent multiplier is abnormal, and if so, to further investigate why.

The debt service coverage ratio is in line with the bank’s requirement of 1.25x and improves over the holding period. This is partially due to our assumption of increasing occupancy over our investment horizon, as well as increasing rental rates. We’ll stress test these assumptions further below, but at first glance the DSCR is adequate for this deal.

Finally, the breakeven occupancy on this property is just under 79%. This means total vacancy can go up to 21% and the property will still produce enough cash flow to cover expenses and debt service. Good to know.

Apartment Discounted Cash Flow Analysis

Screening this property with the above ratios is a good starting point, but ultimately a full discounted cash flow analysis should be completed to determine IRR and NPV:

As you can see above, the levered internal rate of return comes in at 18.65%. While the above Year 1 cash on cash return didn’t meet our required rate of return of 15%, the full discounted cash flow analysis shows that the yield on this investment comfortably exceeds our target return. In fact, the net present value tells us that we can pay about $650,000 over the asking price and we’ll still achieve our target yield. This can come in handy during negotiations, especially in a competitive bidding situation.

Apartment Investment Sensitivity

So after a quick first pass it appears that this potential acquisition meets our target yield based on some reasonable assumptions. However, what if our assumption of a declining vacancy rate, from 9% in Year 1 to 5% in Year 5, turns out to be overly optimistic? Let’s take a look at what we deem to be a worst case scenario – that the market vacancy rate actually deteriorates after we acquire the property to 15%, rather than the current 9%. How will this impact our IRR?

While a worse than expected vacancy rate does reduce our cash flow, it turns out that we’d still achieve our target yield of 15%. What about the debt service coverage ratio? Will a higher than expected vacancy rate violate our 1.25x DSCR loan covenant? Let’s take a look at what happens to the debt service coverage ratio as we move from a 6% vacancy rate all the way up to a 20% vacancy rate:

As shown above, in Year 1 we actually can’t support a 1.25x DSCR requirement at a vacancy rate of 10%. While this does improve over the holding period, this could be problematic for us if the market turns out worse than expected. This could also be discovered during the loan underwriting process, resulting in a lower loan amount or stronger loan covenants. This information might come in handy during negotiations.

Next, let’s take a look at how sensitive our DSCR is to our loan interest rate. This is useful in understanding how much wiggle room there is in negotiating the interest rate with our bank, as well as understanding how capital market conditions might affect the buyer of our property at the end of the holding period.

As shown above, 6% appears to be the upper limit loan interest rate based on Year 1 cash flow. Once the rate gets beyond 6% it starts eating into our 1.25x DSCR requirement. However, in subsequent years, assuming we hit our projections, the property can support a much higher interest rate based on the same loan amount. This provides some cushion toward the end of our holding period, in case the then prevailing market conditions change and interest rates rise.

Conclusion

While there are several different angles you can look at when underwriting a potential acquisition, this simple case study illustrates a few core concepts. First, sizing up a loan amount based on proforma cash flow. Second, calculating and interpreting several quick but useful ratios. Third, understand whether or not an acquisition meets a target yield. And finally, understanding how changes in our assumptions affect our resulting cash flow and underwriting ratios. While there are several additional layers of analysis we can dive into for a property like this, the above analysis gives us a good starting point for screening this particular property.


Source: Apartment Investing Case Study

https://www.creconsult.net/market-trends/apartment-investing-case-study/

Monday, August 7, 2023

Difference Between Market Value and Investment Value in Commercial Real Estate

Value is traditionally defined as the power of a good to command other goods or services when exchanged. Within this broad definition of value, there are various types of value given to real property, such as investment value, market value, insurable value, assessed value, liquidation value, or replacement value. In this article we’ll go over different types of real estate value, and then zero in and focus on the difference between investment value and market value, which is often confused by commercial real estate professionals.

Types of Real Estate Value

First of all, let’s briefly go over several common types of commercial real estate value, then we’ll dive into the difference between investment and market value and clarify with an example.

Market Value is what’s typically meant when referring to a property’s value and is the value used for loan underwriting purposes. The Appraisal Foundation has a specific definition for market value as published in the Uniform Standards of Professional Appraisal Practice (USPAP). According to the Appraisal Foundation, market value is the most probable price a property would bring in a competitive and open market under all conditions requisite to a fair sale, with the buyer and seller each acting prudently and knowledgeably, and assuming the price is not affected by undue stimuli.

Investment Value refers to the value to a specific investor, based on that investor’s requirements, tax rate, and financing.

Insurable Value – This covers the value of the portions of a property that are destructible for the purposes of determining insurance coverage.

Assessed Value – Assessed value is the value determined by the local tax assessor to levy real estate taxes.

Liquidation Value – Liquidation value establishes the likely price that a property would sell for during a forced sale, such as a foreclosure or tax sale. Liquidation value is used when there is a limited window for market exposure or when there are other restrictive sale conditions.

Replacement Value – This is the cost to replace the structure with a substitute structure that is identical or that has the same utility as the original property.

A property can have any of the above types of value at any given time, with no two values necessarily being the same. This is an important point to remember when trying to understand the value of a commercial real estate property. This is especially true when determining market value and investment value.

Approaches to Market Value

Market value is what’s determined by an appraisal. During the commercial loan underwriting process, most lenders will require a third-party appraisal in order to determine a market value estimate, which is then used to find an appropriate loan amount and collateral value.

How do appraisers determine market value? First, before a market value can be estimated by an appraiser, the highest and best use for the property must be determined. The highest and best use is the legal use of a property that yields the highest present value. This process usually begins with evaluating the zoning laws to understand the legally permitted uses for the property.

Once the legally permitted uses are understood, the physically possible uses are then considered, within the bounds of the zoning ordinances. This takes into account the physical limitations of the property such as topography, size, layout, etc.

Finally, the financial feasibility is considered for all of the uses that are legally permissible and physically possible. The financially feasible use that produces the highest financial return is the highest and best use.

Once the highest an best use is determined, the appraiser can then determine market value. Appraisers may use three basic approaches to estimate market value: the sales comparison approach, the cost approach, and the income approach, using either the Direct Capitalization Method or the Discounted Cash Flow Model. We discuss each of these approaches in detail here, but below we’ll briefly summarize.

Sales Comparison Approach
The sales comparison approach links the value of a property to prices that recent buyers have paid for similar properties. In reality no two properties are exactly alike, but this approach can provide a reasonable estimation of value when there is a large quantity of recently sold comparable transactions.

Income Capitalization Approach
The income based approach to market value derives property value from the income it produces. The two methods used to value a property based on income are the direct capitalization method and the discounted cash flow valuation method.

Cost Approach
The cost approach bases value on the cost of reproducing a property, less any accrued depreciation. Accrued depreciation can come from three sources: physical deterioration, functional obsolescence, and external obsolescence. Once the replacement cost is determined and the accrued depreciation is netted out, the cost is added to the value of the land to determined an appropriate value based on cost.

Reconciliation of Value
In a full appraisal the above values are typically reconciled by using a weighted average to determine the final value estimate. For example, it may be determined that a higher weight should be given to the income approach because the available comparable sales data is weak, and as such this would be reflected in the final reconciled market value.

Approaches to Investment Value

While the market value process is usually used in appraisals for loan underwriting purposes, when deciding how much to pay for a property, investors also consider how much a property is worth. Investment value is the amount that an investor would pay for a specific property, given that investor’s investment objectives, including target yield and tax position.

Because investment value depends on an investor’s investment objectives, investment value is unique to the investor. As such, different investors can apply the same valuation methods and still come up with different investment values. Investors can choose from a variety of valuation methods when determining investment value, unlike appraisers who have to adhere to strict procedural guidelines. The following are the most common measures of investment value:

Comparable Sales (Comps) – This is the same sales comparison approach mentioned above that is used by appraisers. Typically investors will compare similar properties on a per square foot or per unit basis.

Gross Rent Multiplier – This is a simple ratio that measures investment value by multiplying the gross rents a property produces in a year by the market based Gross Rent Multiplier (GRM). The gross rent multiplier is usually derived from comparable properties within the same submarket.

Cash on Cash Return – The cash on cash return is another simple ratio used to determine investment value. It’s calculated by taking the first year’s proforma cash flow before tax and dividing it by the total initial investment.

Direct Capitalization – This is the same direct capitalization approach mentioned above that is used by appraisers. Capitalizing the income stream of a property is a very common and simple way to determine both market and investment value for a commercial property.

Discounted Cash Flow – The discounted cash flow model is used to find an internal rate of return, net present value, and a capital accumulation comparison. While the simple ratios above are quick and easy, they do come with several built-in limitation that are solved by a discounted cash flow analysis.

Investment Value vs Market Value

As shown above, market value is essentially the value of a property in an open market and is what’s determined by an appraisal. Investment value, on the other hand, is determined by an individual investor based on that investor’s unique investment criteria and goals.

Let’s take a quick example to illustrate this difference. Suppose an individual investor is contemplating the acquisition of a small apartment building and has projected the following cash flows:

As shown above, using the investor’s discount rate of 10%, the property generates a levered NPV of $210,820. This property is under contract with a total purchase price of $1,200,000 but the above analysis implies the investor could pay up to $1,410,820 and still achieve the target yield. Check out the intuition behind IRR and NPV to learn more about how this works.

The above levered analysis assumes that the investor can obtain a $960,000 loan (80% loan to value), amortized over 20 years at 5%. But suppose that during the underwriting process the bank orders a third-party appraisal and it comes in at $1,000,000 rather than the $1,200,000 the investor is paying. This also reduces the supportable loan amount to $800,000 (based on an 80% LTV) rather than the anticipated $960,000. Unfortunately, in this scenario it turns out that the seller refuses to sell for less than $1,200,000. In other words, this is an above market transaction where the investment value is higher than the market value. Does it still make sense to do the deal?

Let’s take a look at what the new cash flows look like to the investor in this new loan scenario:

investment vs market value

As shown above the new loan amount reduces the yield to 16% from 22%. But this still exceeds the investor’s required return of 10%. So, does it make sense to do the deal? As always, it depends.

In most cases the investment value and the market value should be approximately equal, but sometimes these two values will diverge. On the one hand investment value can be higher than market value. This can happen when the value to a particular buyer is higher than the value to an average, well-informed buyer. For example, this might be the case when a company expands to a new building for sale across the street, paying more than market value in order to keep competitors out of the sub-market. The additional value over and above the market value provides a strategic advantage and therefore might be justified. In the case of an investor, investment value could sometimes be higher than market value due to favorable financing terms or tax treatment that is non-transferable.

On the other hand, investment value can be lower than market value. This might be the case if the particular asset class in question is not a property type that you specialize in. For example, if you are primarily a multifamily developer, then decide to evaluate a site for possible hotel development, your internal investment value may be less than the market value due to the steeper learning curve costs involved. Additionally, investment value could be lower than market value if you require an above-average return based on your existing portfolio mix. In these cases it can sometimes be tempting to pursue a deal even though investment value is less than market value. In these cases think carefully before getting distracted by something that might not make sense.

Conclusion

The safest policy is of course to make sure a transaction makes sense both from an investment value perspective as well as a market value perspective. Keep in mind that investment value is much more subjective than market value, and as such it can be abused. To avoid falling victim to investment value abuse, it’s best to always estimate market value whenever a relevant market exists.  Be especially skeptical if someone claims that investment value differs from market value in a way that supports his or her sales pitch. They might be right, but as the saying goes, trust but verify.


Source: Difference Between Market Value and Investment Value in Commercial Real Estate

https://www.creconsult.net/market-trends/difference-between-market-value-and-investment-value-in-commercial-real-estate/

Sunday, August 6, 2023

Price Gap Between Rent and Home Ownership in Chicago

The price gap between average apartment rents and the cost of owning a home in the Chicago metro area is widening, providing landlords with leverage to push rents even higher.

According to a recent report by RentCafe, the average rent in Chicago is now $2,215 per month. This is significantly higher than the cost of owning a home, which is currently $1,950 per month, including mortgage payments, property taxes, and insurance.

The widening price gap is being driven by a number of factors, including rising interest rates and strong home values. As interest rates have increased, the monthly cost of owning a home has become more expensive. At the same time, home values in Chicago have continued to rise, making it even more difficult for first-time homebuyers to enter the market.

The widening price gap is giving landlords more leverage to push rents. With fewer people able to afford to buy a home, demand for rental housing is increasing. This is putting upward pressure on rents, and landlords are starting to see more success in raising rents.

The widening price gap is also having an impact on multifamily net operating income (NOI). NOI is the money that a multifamily property generates after paying all of its operating expenses. As rents increase, NOI also increases. This can help to offset the higher commercial mortgage interest rates that landlords are facing.

In the long term, it is unclear whether the widening price gap between rent and home ownership will continue. However, in the short term, it is likely to continue to put upward pressure on rents and boost multifamily NOI.

Bottom Line

The price gap between rent and home ownership in Chicago is widening, providing landlords with leverage to push rents even higher. This is being driven by rising interest rates and strong home values. The widening price gap is also having an impact on multifamily NOI, which is likely to increase in the short term.

https://www.creconsult.net/market-trends/price-gap-between-rent-and-home-ownership-in-chicago/

Net Operating Income (NOI): A Beginner's Guide

Understanding Net Operating Income (NOI) is essential in commercial real estate. Without a firm grasp of net operating income, commonly referred to as just “NOI”, it’s impossible to fully understand investment real estate transactions. In this article, we’ll take a closer look at net operating income, discuss the components of NOI, and also clear up some common misconceptions.

What is Net Operating Income (NOI)

Net operating income (NOI) is the most widely used performance metric in commercial real estate. What is NOI in real estate? The net operating income is defined as the total operating income for a property minus the total operating expenses for a property.

The net operating income is useful because it describes a property’s ability to generate income without considering its capital structure. Since different owners will have different capital structures and financing costs, the NOI enables evaluation of property performance before taking any of these owner-specific factors into account.

The net operating income is often referred to as “the line” because operating expenses are calculated “above the line” while capital expenditures and leasing costs are “below the line” items.

Net Operating Income Formula

Net operating income (NOI) is the income generated by a property minus all expenses incurred from operations. The basic net operating income formula is as follows:

Depending on the property type or the parties involved, there is often some nuance in how the net operating income is calculated. For example, a multifamily property will have property-specific line items such as the loss to lease, while an office building will have line items for tenant reimbursements. In any case, at a high level, the net operating income formula is the same and measures operating income minus operating expenses.

NOI Meaning

NOI means Net Operating Income and measures the net income generated by a property before considering any owner-specific expenses such as financing. Net operating income is positive when effective gross income exceeds operating expenses, and negative when operating expenses exceed effective gross income.

For the purposes of real estate analysis, NOI can either be based on historical financial statement data, or instead based on forward-looking estimates for future years, which is also known as a proforma.

Net operating income measures the ability of a property to produce an income stream from operations. Unlike the cash flow before tax (CFBT) figure calculated on a real estate proforma, the net operating income figure excludes any financing or tax costs incurred by the owner/investor. In other words, the net operating income is unique to the property, rather than the investor.

Net Operating Income and Lease Analysis

The vast majority of commercial real estate income is generated by contractual tenant leases. Before we go over each of the components of NOI in more detail, let’s first take a quick detour into the world of commercial real estate leases.

Lease analysis is the first step in analyzing any income-producing property, since it identifies both the main source of income and who pays for which expenses. As you can see from the net operating income formula above, understanding this is essential to calculating NOI.

While there are many industry terms for different real estate leases, such as the modified gross lease, triple net lease, or the full-service lease, it’s important to understand that these terms can have various meanings depending on who you are talking to and which part of the world you are in. That’s why it’s critical to remember that the only way to understand a lease is to actually read it.

At a high level, leases can be viewed on a spectrum of possible structures.

On the one hand, you have absolute gross leases where the owner pays all the operating expenses related to the property. On the other hand, you have absolute net leases, where the tenant is required to pay all operating expenses. Everything else falls in between these two extremes and is considered a negotiated or hybrid lease.

How to Calculate Net Operating Income (NOI)

Calculating net operating income is relatively straightforward once you break out each of the individual components. The major components of net operating income consist of potential rental income, vacancy and credit losses, other income, and operating expenses.

Potential Rental Income – Potential Rental Income is the sum of all rents under the terms of each lease, assuming the property is 100% occupied. If the property is not 100% occupied, then a market-based rent is used based on lease rates and terms of comparable properties.

Vacancy and Credit Losses – Vacancy and credit losses consist of income lost due to tenants vacating the property and/or tenants defaulting (not paying) their lease payments. For the purposes of calculating NOI, the vacancy factor can be calculated based on current lease expirations as well as market-driven figures using comparable property vacancies.

Effective Gross Income – Effective Gross Income (EGI) in the net operating income formula above is simply potential rental income less vacancy and credit losses. EGI is the amount of rental income that the owner can reasonably expect to collect from a property.

Operating Expenses – Operating expenses include all cash expenditures required to operate the property and command market rents. Common commercial real estate operating expenses include real estate and personal property taxes, property insurance, management fees (on or off-site), repairs and maintenance, utilities, and other miscellaneous expenses (accounting, legal, etc.).

Net Operating Income – As shown in the net operating income formula above, net operating income is the final result, which is simply effective gross income minus operating expenses.

Although these are the high-level line items used to calculate NOI, the format of a real estate proforma can vary widely depending on the property type, intended use, sophistication of the parties involved, and more. For more complicated net operating income calculations, you might consider using our commercial real estate analysis software.

What’s Not Included in Net Operating Income

It’s also important to note that there are some expenses that are typically excluded from the net operating income figure.

Debt Service – Financing costs are specific to the owner/investor and as such are not included in calculating NOI.

Depreciation – Depreciation is not an actual cash outflow, but rather an accounting entry, and therefore is not included in the NOI calculation.

Income Taxes – Since income taxes are specific to the owner/investor, they are also excluded from the net operating income calculation.

Tenant Improvements – Tenant improvements, often abbreviated as just “TI”, include construction within a tenant’s usable space to make the space viable for the tenant’s specific use.

Leasing Commissions – Commissions are the fees paid to real estate agents/brokers involved in leasing the space.

Reserves for Replacement – Reserves are funds set aside for major future maintenance items, such as a roof replacement, or air conditioning repair. While the textbook definitions of NOI usually exclude reserves from the NOI calculation, in practice many analysts actually do include reserves for replacement in NOI. For example, most lenders will include reserves for replacement into the NOI calculation for determining debt service coverage and the maximum loan amount. This makes sense because lenders need to understand the ability of a property to service debt, which of course has to consider required capital expenses to keep the property competitive in the marketplace. To see how much confusion and disagreement there is on this, just take a look at all the various answers you see here on this Reddit thread.

Capital Expenditures – Capital expenditures are expenses that occur irregularly for major repairs and replacements, which are usually funded by a reserve for replacement. Note that capital expenditures are major repairs and replacements, such as replacing the HVAC system in a property. This does not include minor repairs and maintenance which are considered an operating expense, such as replacing doorknobs and lightbulbs.

While many of the above items are almost always excluded from net operating income, it’s important to remember that some are open to interpretation depending on the context. Keep this in mind when building your own proformas and when evaluating NOI calculations performed by others.

Introducing CRE Investment Analysis Fundamentals

A complete online course that teaches you the entire commercial real estate investment analysis process

A big picture overview of the commercial real estate investment analysis process

A step-by-step walkthrough of the real estate proforma

How to calculate and interpret simple measures of investment performance

A complete time value of money crash course

A walkthrough of the intuition and calculations behind IRR and NPV

How commercial real estate loans work, including a lender comparison spreadsheet

Office building case study with 5-year proforma, ratios, and discounted cash flow analysis

Fully unlocked Excel models included

60-day money-back guarantee

Net Operating Income Example

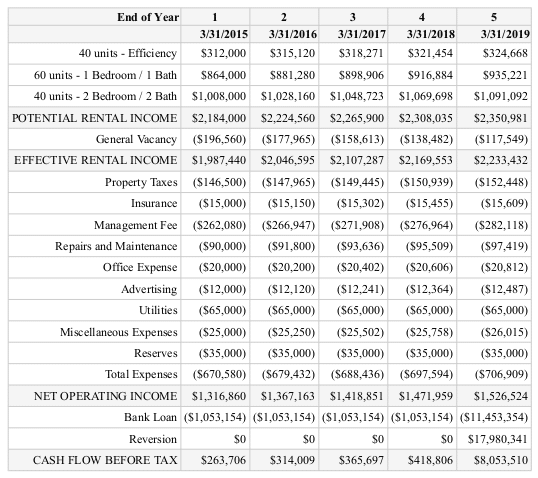
The following is an example of a typical real estate proforma that would be commonly used by lenders, investors, developers, brokers and appraisers. It breaks out how net operating income is calculated and presented for an example warehouse property.

The net operating income line is calculated by deducting vacancy and credit loss from potential gross income, then subtracting out all operating expenses. Notice that the debt service and replacement reserves are not included in the NOI calculation.

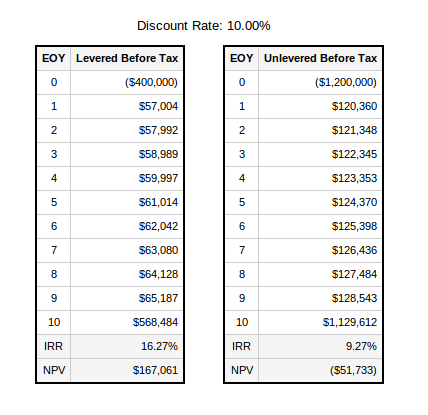
Net operating income projections like this are regularly created by appraisers and other commercial real estate professionals. Once you have a projection of net operating income you can then calculate property level metrics such as the capitalization rate, yield on cost, development spread, IRR, NPV, and more.

Conclusion

Calculating NOI is an important step in evaluating and valuing a property. Once you have an NOI figure, you can begin looking at various measures such as the cap rate or a maximum loan analysis. Then you can also move on to a more detailed analysis that includes a bottom-line cash flow figure and a full discounted cash flow analysis.

Keep the above NOI formula in mind when calculating and reviewing NOI figures, and also be aware of what’s included and excluded from NOI, and you’ll have a good framework for understanding net operating income for any property.


Source: Net Operating Income (NOI): A Beginner’s Guide

https://www.creconsult.net/market-trends/net-operating-income-noi-a-beginners-guide/

Saturday, August 5, 2023

Mason Square

Fully Equipped Car Wash For Sale
1250 Douglas Rd. | Oswego, IL | 3,750 SF | 6 Bays | 1.19 Acres
Mason Square Car Wash, a fully equipped and operational 6-bay carwash in southwest suburban Chicago’s Oswego, IL. Ideally located on an out-lot of the Mason Square Shopping Center along heavily trafficked Route 34, averaging 45,000 vehicles per day,
Listing Agent: Randolph Taylor 630.474.6441 | rtaylor@creconsult.net
https://www.creconsult.net/fully-equipped-car-wash-oswego-il-route-34/

Price Reduction – 1270 McConnell Rd, Woodstock, IL Now $1,150,000 (Reduced from $1,200,000) This fully occupied 16,000 SF industrial propert...