Thursday, January 18, 2024

Moody's Analytics CRE | Q4 2023 Preliminary Trend Announcement

Apartment and Industrial Changed Course, Office Entered Uncharted Territory, and Retail in Holding Pattern

The year 2023 ended on a generally positive macroeconomic note: inflation has made solid progress, with year-over-year growth of the CPI (consumer price index) down as shelter receded to the same level in November 2019. The labor market dialed back its pace but remained steady. There are still 1.3 jobs per every unemployed person, higher than 1.2 pre-pandemic. The unemployment rate also fell to 3.7% in November, well below its long-run average. Real GDP growth stayed above the US's potential for most of the year and accelerated in the third quarter, attributed to consumer spending and inventory investment. The long-feared recession did not materialize, and the hawkish Federal Reserve subtly pivoted, hinting at the peak of the current rate hike cycle.

While the broader economy seems to be heading towards a soft landing, much of the commercial real estate (CRE) world is stuck in limbo. Why?

  • The multifamily and industrial sectors experienced sudden shifts in supply and demand dynamics
  • Rising insurance costs increasingly pressured net operating income
  • The office and multifamily sectors led the CRE market in value declines, characterized by a few high-profile fire sales
  • High interest rates compressed capital funding and elevated refinance risks

While many events were indeed idiosyncratic or metro-specific, others may well be part of regime changes or even leading indicators of a new equilibrium. Moody’s Analytics Q4 data shows where the core CRE sectors’ (multifamily, office, retail, and industrial) conditions stand as we conclude 2023.

Multifamily

Multifamily performance changed course in the fourth quarter, with net absorption plummeted from an average of over 45,000 units in the previous quarters to less than one fifth (or 8,973 units) nationwide, making Q4 another quarter with less than 10,000 units of net move-ins this year. Year-to-date, total net absorptions were only a third of their pre-pandemic highs, driven by the stabilization of demographics and the lock-in effect on the substitutional single-family housing market.  While the journey to homeownership slowed, household formation was also challenged by a persistent rent burden especially on the lower end of the renter distribution.

Construction delivery over the investable space (20 units and above) fell short of initial estimates, with slightly over 40,000 units verified for the fourth quarter so far. According to the National Multifamily Housing Council’s quarterly construction survey, economic uncertainty, availability of construction financing, and economic feasibility are among the top reasons for project delays cited by the leading multifamily construction and development firms. We do expect upward revisions as we continue validating project completions over the next few weeks, but the glut of new supply significantly pressured the overall market performance.

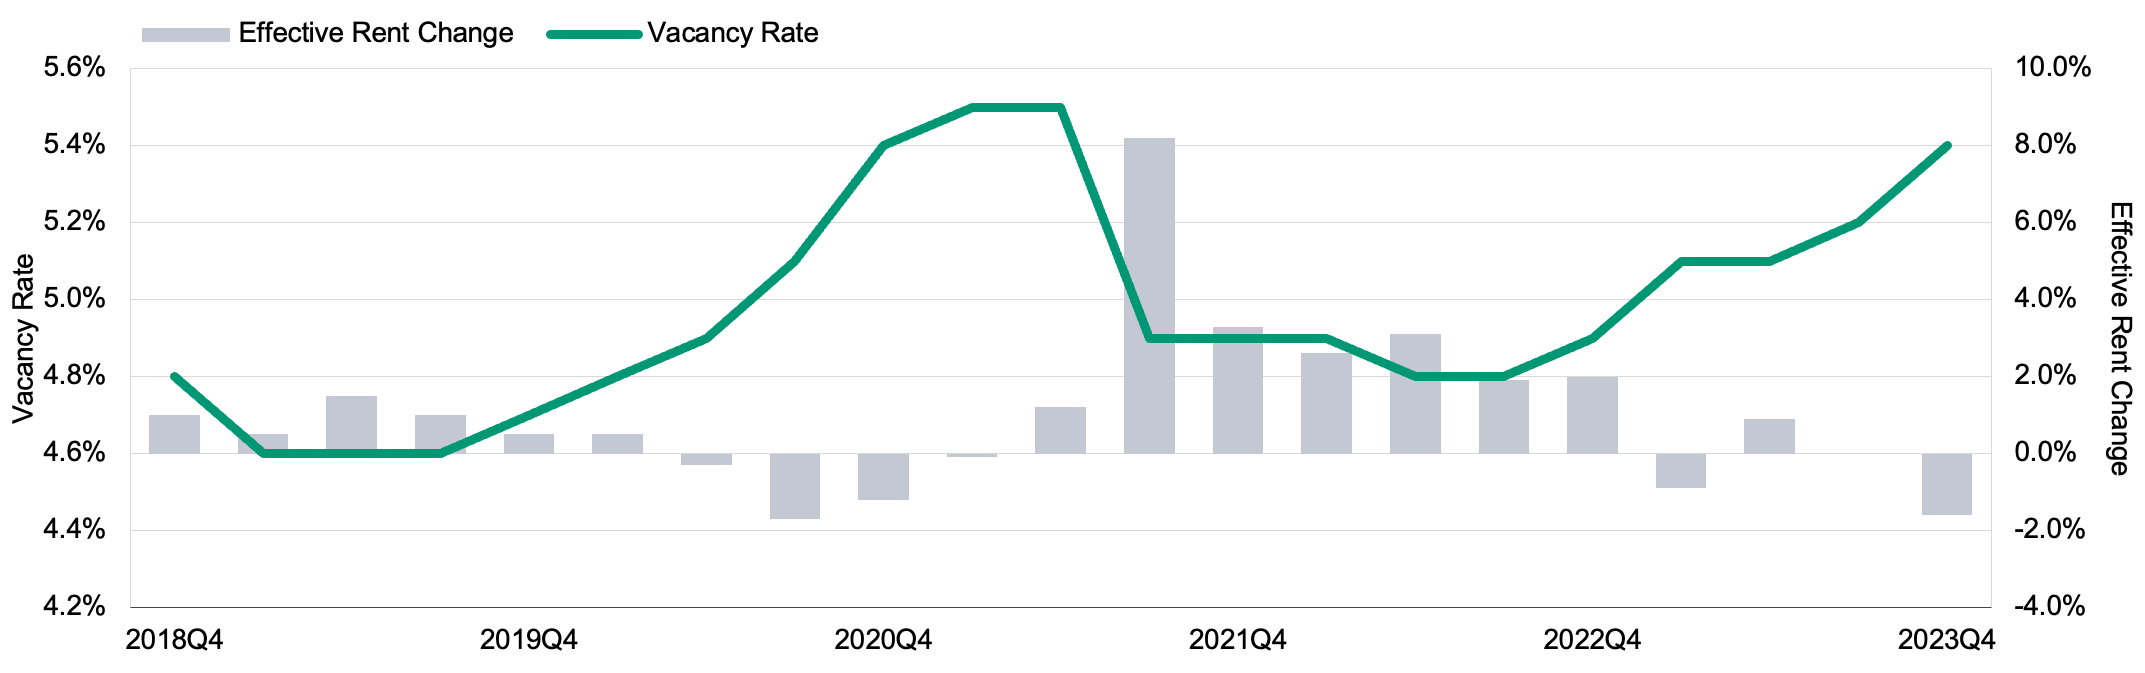
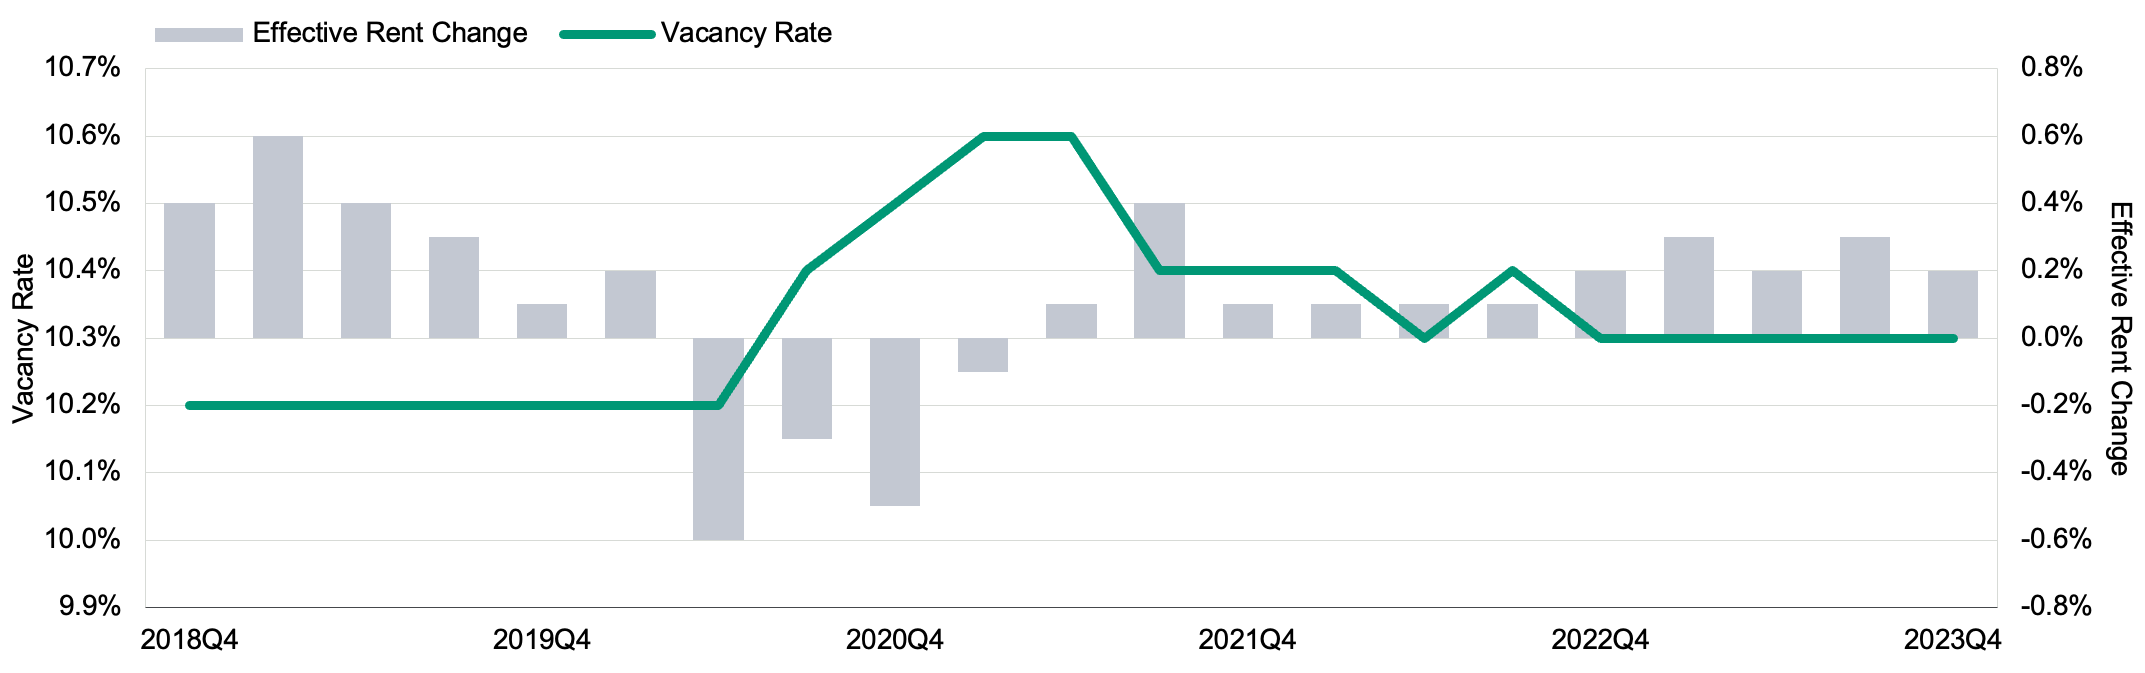
The national apartment vacancy rate went up 20 basis points (bps) to 5.4%, half a percentage point higher than last year’s and inching closer to its recent pandemic peak of 5.5%. A temporary imbalance of supply and demand compressed rent growth, with both asking and effective rent declining continuously in the last three months of the year. At the national level, asking rent was down to $1,825 while effective rent closed at $1,732, 0.8% and 1.7% lower than their respective year-ago levels.  It is striking to see the widened gap between asking rent and effective rent, which grew at a record speed over the second half of the year from 4.1% to 5.1%, a level not seen since 2010.

Figure 1: Apartment Rent and Vacancy Trend: Effective Rents Declined as the Vacancy Rate Climbed in 2023

Line and bar graph showing apartment data for Q4 2023
Moody's Analytics CRE

Office

The national office vacancy rate rose 40 basis points to a record-breaking 19.6%, shattering the previous record of 19.3% set twice previously: once in 1986, driven by a five-year period of significant inventory expansion, and the other in 1991, during the Savings and Loans Crisis. This surge represented the largest quarterly increase since Q1 2021, setting the latest office vacancy 280 bps higher than its pre-pandemic level.

New construction has added 24,474,000 square feet (sqft) of office space since the beginning of the year, well below our initial estimate and the lowest since 2012. With annual inventory expansion currently sitting at 0.54%, new Class A properties that offer flexible or smaller configurations are particularly attractive to tenants who decide to keep the physical office footprint for branding, purposeful gathering, training, and collaboration purposes. Suburban offices also fared better due to their proximity to local communities and, in some cases, shorter commute times.

Despite the increasingly optimistic consensus on the likelihood of a soft macroeconomic landing along with positive news from the labor market, the permanence of dynamic hybrid models has effectively muted office demand, making the year 2023 the most downbeat since the Great Financial Crisis (GFC). Net absorption has stayed consistently negative since July 2023 and finished Q4 at -12,965,000 sq ft, driving the end-of-year total to -18,320,000 sq ft. Subleases also absorbed some level of office demand as the market continued to adapt to the regime changes. Asking rents rose by 0.1% in Q4, but effective rents declined for a second straight quarter by -0.3% due to considerably high vacancies.

Figure 2: Office Rent and Vacancy Trend: Historic Vacancy Levels Lead to Declines in Effective Rent in Q4

Line and bar graph showing office data for Q4 2023
Moody's Analytics CRE

Retail

The retail sector remained largely steady throughout 2023, as the vacancy rate stayed flat at 10.3% in Q4. Asking rents rose by 0.2% to $21.7/sqft, while effective rents were up by 0.2% to $19/sqft in Q4. Early holiday season figures suggest consumers have continued spending, and retailers that have adopted omnichannel methods are in a better position to meet consumer needs by fusing in-person experiences with the ease and accessibility of online shopping. As consumers continue to subtly shift their preference from goods to services, physical experiences still have a place in the retail sector.

New retail construction grew by 583,000 sqft in Q4, bringing the preliminary year-end total to 5.7 million sqft, or 0.3% of inventory expansion. New construction faced many of the same financing and economic challenges as other sectors, but ongoing adjustment to a new equilibrium has lagged behind the consistent slowness in construction. While retail data indicates stagnation, a nuanced study shows persistent shuffling of winners vs. losers in the physical space. Elevated interest rates put many potential expansions, franchising opportunities, or even mergers and acquisitions on hold.

Bifurcated consumer spending habits challenged retailers that failed to adapt as the missing middle phenomenon persisted in 2023. Despite these significant headwinds, closer integration of live-work-play communities will save the retail form that used to heavily rely on commuting workers.

Figure 3: Retail Rent and Vacancy Trends: National Rent and vacant Levels Remained Mostly Flat as Retailers Navigated Uncertainty

Line and bar graph showing retail data for Q4 2023
Moody's Analytics CRE

Industrial (Warehouse/Distribution Center)

The industrial sector has enjoyed exceptional growth over the past few years, driven in part by the continued strength of e-commerce as a share of total retail sales and the impact of manufacturing reshoring and nearshoring initiatives. Construction has ramped up quickly since the beginning of the COVID-19 pandemic in response to intense demand. The annual rate peaked at 283 million square feet by mid-2023. As the market grew more balanced, construction started to slow amid higher interest rates and cooling demand. Completions declined steadily from 85 million sq ft at the end of last year to only 24.3 million sq ft in Q4, down more than half from just a quarter ago.

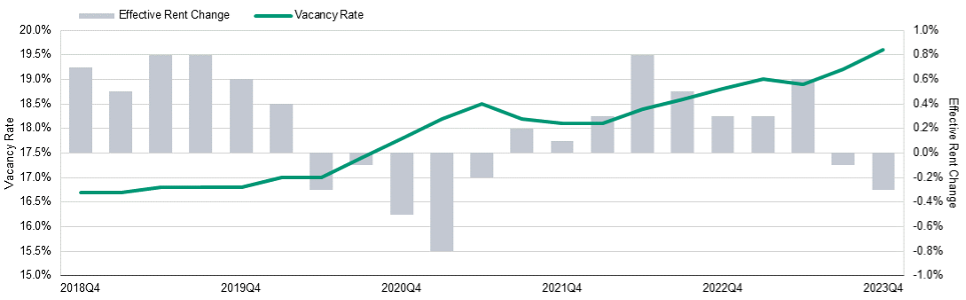
Demand for warehouse and distribution center space cooled as consumption shifted from goods to services, and high interest rates challenged inventory management. Net absorption in the fourth quarter was down 65% from the quarter ago to 8.8 million sq ft, only a fraction of its peak volume in Q3 2021. It is worth noting that net absorption teased negative territory at -438,000 sq ft in December, the first time since 2009! As demand cooled more rapidly than supply, the vacancy rate extended its upward trajectory established in mid-last year and climbed another 20 basis points to 5.4% at the national level in this quarter. Although vacancy increases reflected market rebalancing, the level remained significantly lower than the sector’s pre-pandemic average. As a result, the growth of asking and effective rent slowed but stayed positive at 0.8% and 0.5%, respectively, in Q4.

Figure 4: Industrial (Warehouse/Distribution Center) Rent and Vacancy Trends Vacancy Trends Continue an Upward Climb After Years of Historic Construction While Remaining Below Pre-Pandemic Levels

Line and bar graph showing Industrial data for Q4 2023
Moody's Analytics CRE

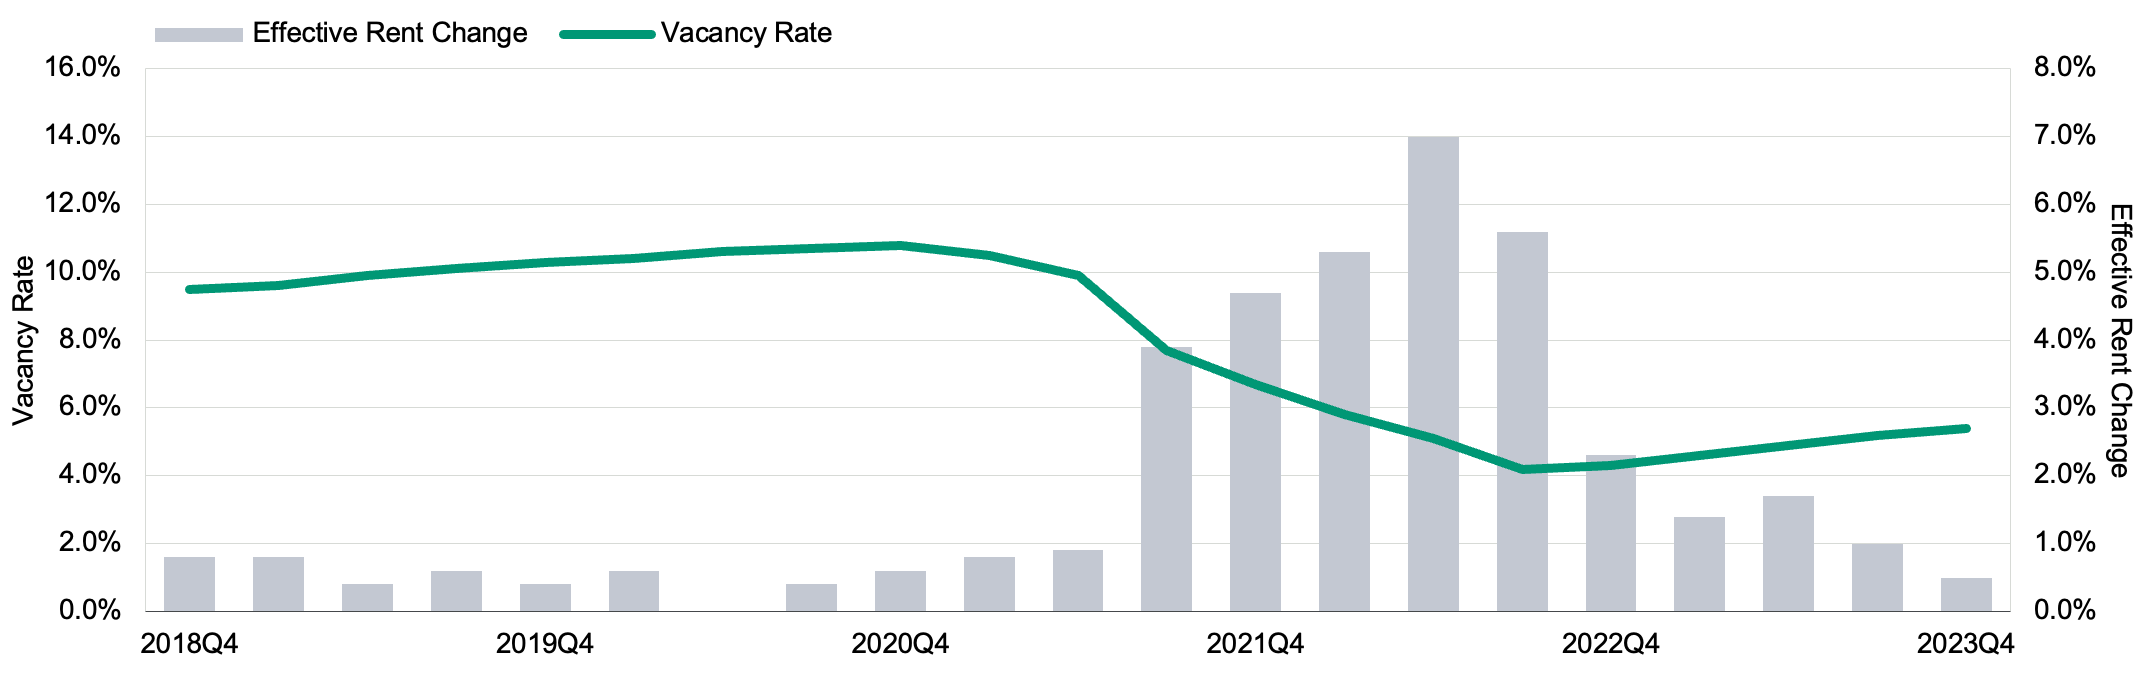
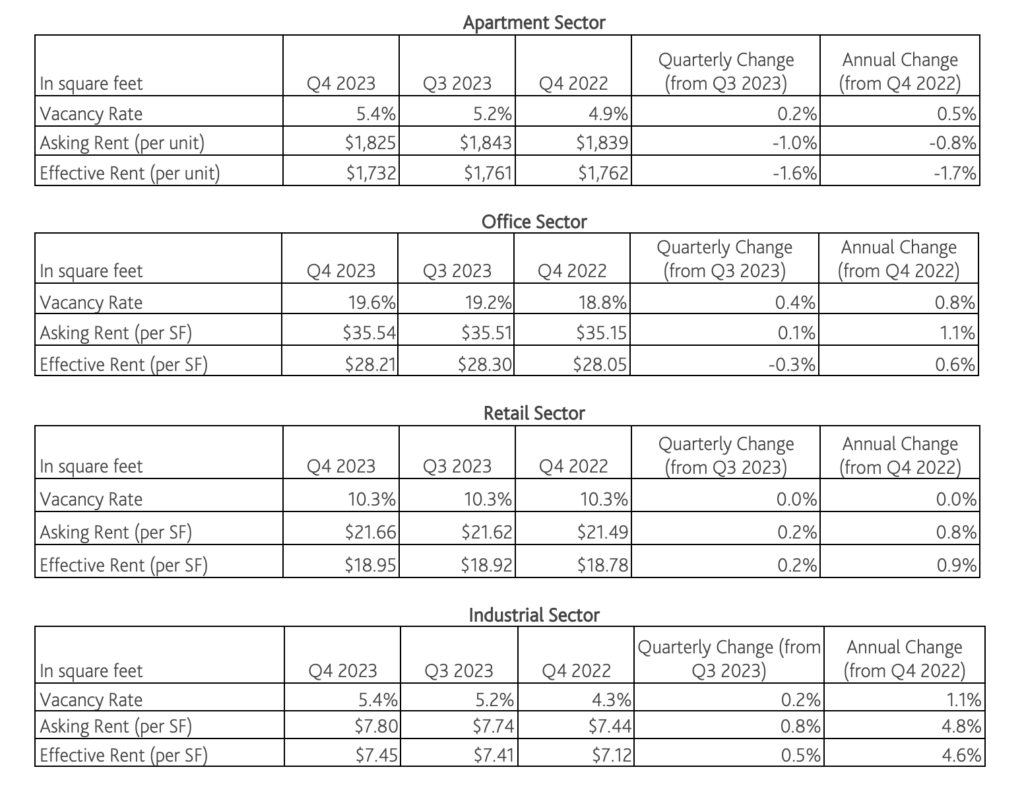
Table 1: Summary of Moody’s Analytics CRE Q4 2023 Statistics

Table with Q4 2023 statistics
Moody's Analytics CRE

US Metros

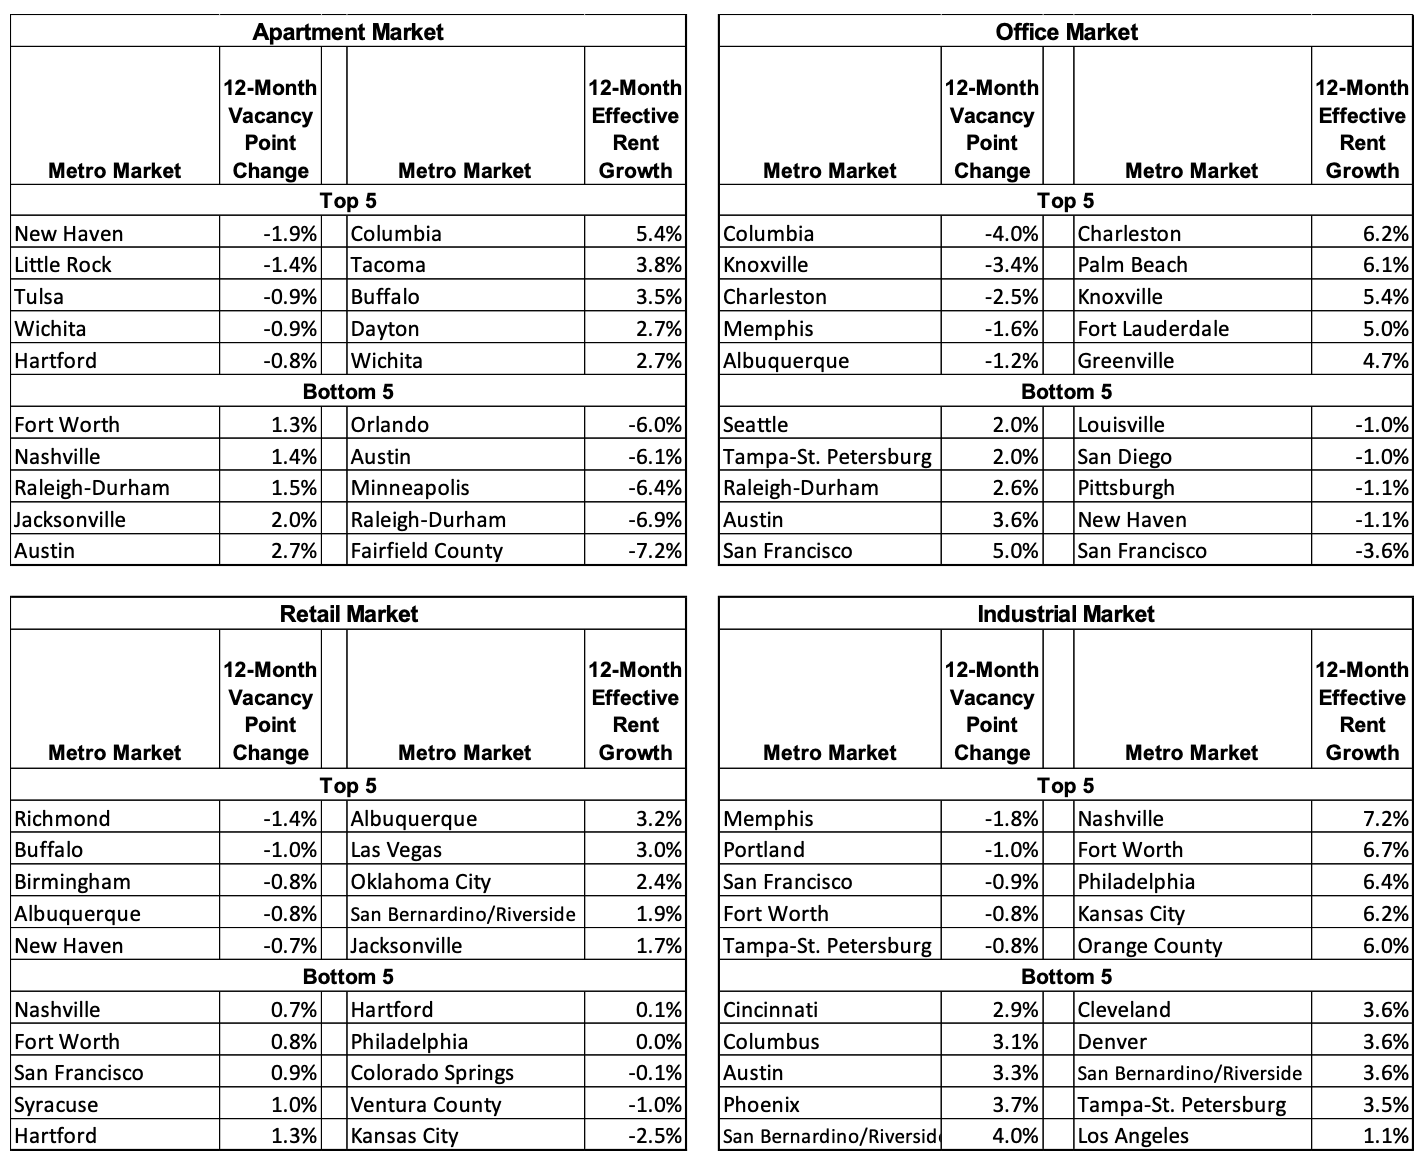
For multifamily, 1 in every 5 metros recorded over 2% of inventory growth in 2023, while nearly 60% (47 of 79) of primary metros had more move-outs than move-ins in the last quarter of the year.  Nashville (5.2%), Jacksonville (4.1%), Austin (4.0%), Phoenix (4.0%), Charlotte (3.7%), Salt Lake City (3.7%), and Fort Lauderdale (3.0%) were leading the annual inventory growth among all.  With little surprise, all of them suffered from year-over-year vacancy increases, ranging from 0.6% in Charlotte and Fort Lauderdale to 2.7% in Austin. Except for Salt Lake City, which was supported by more balanced market demand, all of the aforementioned metros also recorded notable annual effective rent declines, ranging from -1.3% in Nashville to -6.1% in Austin.  In the final three months of the year, over 90% of all primary metros have experienced quarter-over-quarter vacancy increases, more than half of which also recorded rent declines at the same time.  Nineteen primary metros recorded over 2% of asking rent declines in the fourth quarter, with Orlando (-3.8%), New Haven (-3.2%), Omaha (-3.2%), and Fort Worth (-3.1%) topping the list.

For offices, San Francisco (-4.4M sqft), Los Angeles (-2.4M sqft), Philadelphia (-2.0M sqft), Washington, DC (-1.4M sqft), Seattle (-1.3M sqft), Denver (-1.2M sqft), Orange County (-1.2M sqft), Baltimore (-1.1M sqft), and Raleigh-Durham (-1M sqft) each recorded more than 1 million sqft of negative net absorption in 2023. In the fourth quarter alone, Moody’s Analytics preliminary data showed over half (50 of 79) of US primary metros experienced negative absorption. San Francisco led the loss in Q4 with -2,400,000 sqft of net move-outs, while Washington, DC, and Chicago had over 100,000 sqft. Fifty-two primary office markets experienced vacancy increases in 2023, among which San Francisco (+5.0%), Austin (+3.6%), and Raleigh-Durham (+2.6%) significantly underperformed. Effective rents fell the most over the past 12 months in San Francisco (-3.6%), New Haven (-1.1%), Pittsburgh (-1.1%), San Diego (-1.0%), and Louisville (-1.0%), each experiencing a greater than -1.0% decline.

Retail vacancies declined or remained flat across 47 primary metros in Q4, but the changes were mostly moderate and stable, indicating the national trend was widespread. Retail vacancy changes ranged from -60 bps in New Haven to +100 bps in Syracuse, but only 6 of our 77 primary metros observed a shift of 40 bps or greater. Over 2023, retail star performers included Richmond (-140 bps), Buffalo (-100 bps), Birmingham (-80 bps), and Albuquerque (-80 bps), while Hartford (+130 bps), Syracuse (+100 bps), and San Francisco (+90 bps) experienced the sharpest rises in retail vacancy. Seventy-three of 77 primary markets recorded effective rent growth compared to a year ago, but Kansas City (-2.5%), Ventura County (-1.0%), and Colorado Springs (-0.1%) experienced declines while Philadelphia (0.0%) held flat.

Finally, over half of the primary industrial markets recorded negative net absorption in the final quarter of 2023. On a year-over-year basis, nearly 3 out of every 4 primary metros experienced higher vacancy. Five metros recorded more than 5% of warehouse-distribution space growth for the year, which are Austin (12.5%), Phoenix (10.5%), San Bernadino/Riverside (6.2%), Jacksonville (6.2%), and Fort Worth (5.1%).  Aside from Fort Worth, which was supported by its unique advantages of an expandable market, affordable rent, and central location for logistics, other rapidly growing industrial markets all recorded year-over-year vacancy growth ranging from 1.9% in Jacksonville to 4.0% in San Bernadino/Riverside. Los Angeles lagged behind other industrial markets due to more than 6 million square feet of move-outs throughout the year.

*These retail statistics represent neighborhood and community shopping centers only. Moody’s Analytics CRE does not report mall rents at the metro level.

Table 2: Annual Effective Rent Growth and Vacancy Changes: Top 5 and Bottom 5 Metros

Table showing annual rent growth and vacancy changes: top 5 and bottom 5 metros for Q4 2023
Moody's Analytics CRE

The US economy is gradually coming out of the good-news-is-bad-news paradox. Consumer confidence surged in the final month of 2023, which set the premise for another good year ahead. As inflation heads further in the right direction, rate cuts may finally be on the horizon. That will be welcome news for CRE transactions and the overall business environment. In the meantime, space market rebalancing and credit risks associated with CRE lending must be cautiously calibrated, monitored, and prepared for.

Each CRE sector has its own challenges and opportunities. The office's painful evolution depends on how the “Great Compromise” will set the broader return-to-office (RTO) policy in the near term. A glimmer of hope was ignited by a reset of property values (and therefore rent), especially in metros with the highest price per square foot. The multifamily market expects more projects to come online in 2024, as many projects in the pipeline faced delays due to capital constraints in the year prior. In contrast to the glut of supply will be the normalization of demand, driven by slowed population growth and (hopefully) renters moving up the homeownership ladder. Affordability continued to pressure renter households, especially those at the lower end of the income distribution. Retail was mostly in a holding pattern in recent quarters; lower-income households had to limit goods and service consumption due to elevated costs of living, the resumption of student loan payments, and the higher principal and interest on other debt. But lower interest rates may finally help retailers reconsider expansion, franchising, or even mergers and acquisitions. Regardless of a reliance on commuting workers, experiential retail and mixed-use communities are ever more appealing to local residents, businesses, and consumers. The industrial sector may have passed its golden period of growth due to the unexpected destruction of the supply chain over the past few years, but the revolution in inventory management and the requirement of warehouse/flex space for the important e-commerce industry continue to recalibrate the market equilibrium.

Space market challenges will pose potential risks to associated commercial loans, especially if the underlying collateral faces greater uncertainty with its performance metrics. That is indeed concerning for mid-size to smaller financial institutes, which have significant CRE exposures. But so far, Moody’s Analytics CRE does not believe this will become a source of systematic risk for the overall banking system. In 2024, we expect to see greater integration of live, work, and play communities to drive the formation of the space market’s new norm. Among many challenges, there will be abundant opportunities for market participants to invest in this new era if they believe in the future of commercial real estate.


https://www.creconsult.net/market-trends/moodys-analytics-cre-q4-2023-preliminary-trend-announcement/

Billions Flow to Student Housing as Rents Soar

Billions Flow to Student Housing as Rents Soar

Investors are flocking to student housing as its rent growth outpaces traditional multifamily properties, lured by its resilience during economic downturns and higher-than-average returns.

Billions Funneled into Student Housing as Rent Growth Exceeds Apartment Market


Investors are flocking to student housing as its rent growth outpaces traditional multifamily properties, lured by its resilience during economic downturns and higher-than-average returns.

Rising star: Major investors are pouring billions into the student housing market attracted by its higher rent growth, outperforming traditional apartments. The off-campus student housing sector saw a 7.1% rent increase over six months, with some universities noting growth above 20%. Seen as "recession-proof," investments are especially concentrated in Sun Belt states, known for their substantial rent and enrollment hikes. However, this trend has raised concerns over the capacity of campus housing.

Yardi Matrix

Student housing rent growth this year has far outpaced previous years, data from Yardi Matrix shows.

Student housing vs. apartment market: While student housing rents have surged, apartment rents have begun to plateau after reaching record highs in the past. For instance, student housing rent growth this year has substantially surpassed previous years, with data indicating a marked increase in rent growth rates. In contrast, multifamily property rents rose at a more modest rate, making student housing a more appealing investment.

Major deals: BREIT's acquisition of American Campus Communities for $13B last year underscored the growing appeal of student housing in the commercial real estate market. In addition, Blackstone's ACC has initiated two major student housing projects within its $3B program. However, as student enrollments rise, many universities struggle to provide adequate housing, leading to local market imbalances. Cities such as Boston, for instance, are experiencing shortages in off-campus apartments.

Shifting tides: Investor interest in student housing is now leaning towards luxury properties near campuses. Last year saw record property sales in this sector, with over $10B invested for two straight years. However, 1H23 saw a slower investment pace due to higher rates, changing the investor landscape. Investment funds made up 52% of deals in 1H23, a jump from 12% in 2H22, while universities and public REITs reduced their participation. There's also a spike in foreign investment, especially from the Middle East and Asia.

➥ THE TAKEAWAY

Campus housing crunch: The booming student housing sector is a double-edged sword. On the one hand, it's attracting significant investment, but on the other, it's amplifying accommodation issues in university towns. With universities experiencing record enrollments, there's an urgent need to house the growing student body without overburdening local housing markets. As enrollments surge, investors are faced with the challenge of benefiting from this growth while also addressing the housing deficits in academic communities.

Source: Billions Flow to Student Housing as Rents Soar

https://www.creconsult.net/market-trends/billions-flow-to-student-housing-as-rents-soar/

Wednesday, January 17, 2024

The New Era of Rental Prices

The New Era of Rental Prices

For renters who've felt the sting of rapidly increasing costs, there's a sigh of relief on the horizon. The rapid inflation of rent prices, which has been a pressing concern for many in recent years, is showing signs of stabilization.

From Skyrocketing to Stabilizing: The New Era of Rental Prices

rental prices across the US

Analysis based on average monthly rent data for provided by CoStar Group. The data includes newly posted rents, not lease renewals, for 1,660 counties for June of each year from 2019 to 2023. Counties with fewer than 1,000 multi-units, according to Census Bureau data, were excluded.

Good news is on the horizon for renters: The rapid escalation in rental prices, which had previously seemed unstoppable, appears to be taking a pause.

Rental rollercoaster: Between 2020 and 2022, rents surged by a striking 15%, the most rapid increase in nearly a century. However, the fervor has calmed. Rent growth has reverted to pre-pandemic rates, seeing an annual growth of about 1 to 3 percent. Interestingly, in cities that recently witnessed surging rents like Austin and Atlanta, prices are now dropping. As Igor Popov, chief economist at Apartment List, observes, the rental market is "taking a breath.

Why the slowdown? A significant factor in this slowdown is the surge in housing construction. An impressive nearly 1 million new apartment units are currently under construction nationwide. By the end of 2023, over half of these are expected to be on the market. Concurrently, the demand for rentals is waning as the U.S. adjusts to post-pandemic life. The appetite for apartment living has decreased, with fewer individuals moving out and more staying in familial homes. This change has created a discrepancy between available apartments and interested renters, thereby stabilizing price growth.

more new apartments over 50 years

The Sun Belt phenomenon: The Sun Belt region, which includes parts of the Southern U.S., experienced a unique scenario. Initially, during the pandemic, there was a spike in demand as individuals sought warmer climates and more affordable living conditions, moving away from urban centers like New York. This shift led to a boom in rental prices in cities like Phoenix, Dallas, and Miami. However, the rush to meet this demand has led to an oversupply, causing rents to stabilize and even decrease in some areas.

sun belt cities rent price growth

➥ THE TAKEAWAY

The new normal: While renters can find solace in stabilizing prices and even some reductions, it's crucial to note that the cost of renting remains substantially higher than pre-pandemic levels in many areas. Areas like Atlanta, despite witnessing recent rent reductions, still have renters paying substantially more than before the pandemic. The introduction of incentives like months of free rent indicates a market adjusting to new realities, but the days of pre-pandemic affordability seem to be a distant memory for now.

Source: The New Era of Rental Prices

https://www.creconsult.net/market-trends/the-new-era-of-rental-prices/

Tuesday, January 16, 2024

Mid-Priced Apartment Demand Soars Amid Economic Uptick

Mid-Priced Apartment Demand Soars Amid Economic Uptick

Plus: CoStar's analysis shows a continued dip in CRE sale prices in October, aligning with the ongoing trend of increased rates.

Leasing Surge in Mid-Priced Apartments with Improved Economy

In 2023, the U.S. multifamily market has seen a significant upswing in renter demand, especially for mid-priced apartments rated three stars. This shift marks a recovery from a sluggish performance in the latter half of 2022.

A surge in demand: There has been a 77% increase in occupancy over the last year, with 260,000 more units being filled than vacated. This surge is primarily in mid-priced, three-star properties, contrasting with the disappointing absorption of only 146,000 units in 2022.

Influencing the market: The market slump in 2022 was driven by a combination of high inflation, increased oil prices, and recession fears, which significantly impacted consumer confidence and demand, especially in mid- and low-priced properties. This led to renters seeking more affordable housing solutions or delaying household formation.

Improving economy: The rebound in 2023 has been fueled by improved consumer confidence, lower inflation, strong wage growth, and reduced recession fears. These factors have notably increased the demand for three-star properties by 54,000 units in the first three quarters of the year.

➥ THE TAKEAWAY

Positive outlook: The high-end segment of the market, comprising four- and five-star properties, has remained stable, thanks to the lower rent-to-income ratio of its renter households. Looking ahead, if the economy avoids a recession, multifamily demand could return to pre-pandemic levels by 2024, although supply is expected to exceed demand for the third consecutive year.


Source: Mid-Priced Apartment Demand Soars Amid Economic Uptick

https://www.creconsult.net/market-trends/mid-priced-apartment-demand-soars-amid-economic-uptick/

Chicago Multifamily Brokerage | eXp commercial

Chicago Multifamily Brokerage | eXp Commercial No Matter Where You Area In The Investment Cycle We Can Help You! Commercial Real Estate Brokerage firm specializing in the listing and sale of multifamily properties in the Chicago area and suburbs. Website: https://www.creconsult.net Phone: 630.474.6441 Email: rtaylor@creconsult.net

Monday, January 15, 2024

1031 Exchange: A Comprehensive Guide

1031 Exchange Rules: A Comprehensive Guide

In the world of real estate investment, savvy investors are constantly seeking strategies to maximize their returns while minimizing tax liabilities. To accomplish these objectives, the Section 1031 of the Internal Revenue Code-authorized 1031 exchange has grown in popularity. This comprehensive guide will provide an in-depth exploration of 1031 exchange rules, shedding light on the intricate details that investors must adhere to for a successful exchange. From understanding the concept of a 1031 exchange to meeting strict deadlines and utilizing qualified intermediaries, we will cover everything you need to know to make the most of this lucrative tax-saving strategy.

First, our Disclaimer: We are not licensed CPAs or attorneys. This article is not intended to provide deal-specific professional advice. This article discusses the general framework of 1031 exchanges. Anyone engaging in this tax strategy should seek professional accounting and/or legal advice.

What is a 1031 exchange?

At its core, a 1031 exchange, also known as a like-kind exchange, is a tax-deferral strategy that enables real estate investors to sell a property and reinvest the proceeds in a similar, like-kind property without recognizing any gain for tax purposes. By doing so, investors can defer the tax obligation associated with any gain, allowing them to reinvest the entire sale proceeds into a new property, ultimately increasing their purchasing power and potential for wealth accumulation.

To qualify for a 1031 exchange, both the relinquished property (the property being sold) and the replacement property (the property being acquired) must be held for investment, business, or income-producing purposes. Personal-use properties, such as primary residences or vacation homes, do not qualify for like-kind exchanges

The Benefits of a 1031 Exchange

The advantages of a 1031 exchange are multifaceted and offer real estate investors unique opportunities for growth and wealth accumulation.

Tax Deferral: One of the most powerful benefits of a 1031 exchange is the ability to defer all taxes associated with a real estate transaction.  When selling an investment property, the list of taxes is overwhelming. The most popular is the federal capital gains tax, usually 20%. But this is only the beginning of the list. If the property is located in (or the seller resides in) a state with income taxes, the transaction is also subject to state income taxes; the average state rate is 7.5%. The IRS assumes you have a good accountant who depreciated the property. Most of us do, but even if you did not, the IRS assumes you did and levies a 25% depreciation recapture tax on the amount you deducted (or should have deducted) for depreciation. In addition to these taxes, the IRS also levies a net investment income tax (NIIT) of 3.8% on your profit. Depending on where you live and how long you have owned the property, these taxes can exceed 30% of your sales proceeds. By engaging in a 1031 exchange, investors can defer these taxes, allowing the capital that otherwise would go to state and federal governments to reinvest the full proceeds into a replacement property, thereby maximizing their investment potential.

Increased Purchasing Power: With taxes deferred, investors have access to a larger pool of funds to invest in higher-value replacement properties—properties that better fit the investor’s values and portfolio goals. This increased purchasing power enables investors to upgrade their portfolio, acquire properties with higher income potential, or diversify their holdings to align with their long-term investment objectives.

Portfolio Diversification: 1031 exchanges offer investors an opportunity to diversify their real estate holdings without incurring immediate tax liabilities. This flexibility allows investors to adapt their portfolio to market conditions, economic trends, and changing investment strategies, all while maintaining tax-deferred status.

Wealth Accumulation: By deferring capital gains taxes, investors can compound their investment returns over time, accelerating wealth accumulation and financial growth. As the real estate market appreciates and property values increase, investors can harness the power of compounding to achieve substantial long-term gains.

Understanding 1031 Exchange Rules

To ensure a successful 1031 exchange, investors must adhere to a set of rules and guidelines established by the Internal Revenue Service (IRS). These rules cover various aspects of the exchange, from identification periods to the use of qualified intermediaries:

Like-Kind Property Requirement

One fundamental rule of a 1031 exchange is the requirement that both the relinquished and replacement properties must be of “like-kind.” While the term “like-kind” may sound restrictive, it is relatively broad when applied to real estate. Essentially, any type of real estate used for business, trade, or investment purposes can qualify as like-kind to another. For example, an investor can exchange a residential rental property for a commercial office building or an industrial warehouse for a retail shopping center. The like-kind requirement does not focus on the specific type of property but rather the nature or character of the investment. As long as both properties are held for investment purposes, they generally qualify for a 1031 exchange.

Using a Qualified Intermediary (QI)

A Qualified Intermediary (QI) is a critical player in facilitating a 1031 exchange. As a neutral third-party entity, the QI serves as the intermediary between the buyer of the relinquished property and the seller of the replacement property. The QI’s primary role is to receive the sale proceeds from the relinquished property and hold them in escrow until they are used to acquire the replacement property. Using a QI is mandatory in a 1031 exchange to avoid disqualification of the exchange due to constructive receipt of funds. If the investor were to directly receive the sale proceeds, the IRS would view this as taxable income, disqualifying the exchange. The QI ensures that the exchange is strictly on a like-kind basis and adheres to all 1031 exchange rules.

The first step in a 1031 exchange should be to select your QI. This must be done before you close the transaction on the relinquished property. When selecting a QI, it is essential to choose a reputable and experienced entity with a thorough understanding of the exchange process. The QI should be a qualified intermediary who has no personal relationship with the investor to maintain impartiality.

Identification Period

The IRS imposes a strict timeline for identifying potential replacement properties after selling the relinquished property. Known as the identification period, this timeframe lasts for 45 calendar days, commencing on the date the relinquished property was closed.

During the identification period, investors must identify the replacement properties they intend to acquire. There are two popular identification rules most investors choose from:

a) Three-Property Rule: Investors can identify up to three potential replacement properties, regardless of their value. This allows for more flexibility in finding suitable replacements.

b) 200% Rule: Investors can identify any number of potential replacement properties, but the total value of all identified properties cannot exceed 200% of the relinquished property’s sale price. This rule offers investors more options while maintaining a degree of fairness in the exchange process.

180-Day Exchange Period

Beyond the identification period, investors must complete the 1031 exchange by acquiring the replacement property within 180 calendar days of selling the relinquished property. The 180-day exchange period begins on the date of the relinquished property sale and ends when the replacement property is acquired.

It is essential to note that the 180-day exchange period includes the 45-day identification period. Therefore, investors must act decisively during the identification period to identify suitable replacement properties and move forward with the acquisition process.

One-Property Rule

While investors can identify multiple replacement properties during the identification period, they must ultimately close on one or more of the identified properties to complete the exchange successfully. This rule is known as the one-property rule. Investors can choose one of the identified replacement properties or purchase multiple identified properties, as long as the total value of the acquired properties is equal to or greater than the relinquished property’s sale price.

Holding Period

To qualify for a 1031 exchange, both the relinquished and replacement properties must be held for investment, business, or income-producing purposes. The IRS requires that the investor’s intent for both properties be for long-term investment rather than short-term speculation or personal use.

The holding period plays a critical role in demonstrating the investor’s intent to qualify for the tax-deferred benefits of the 1031 exchange. While there is no specific holding period requirement set by the IRS, investors are advised to hold both the relinquished and replacement properties for a reasonable period to substantiate their intent.

By deferring capital gains taxes and unlocking the potential for increased purchasing power, portfolio diversification, and wealth accumulation, a 1031 exchange empowers investors to make strategic real estate decisions with long-term benefits in mind.

Tips for a Smooth 1031 Exchange

Navigating the rules of a 1031 exchange can be complex, but with careful planning and expert guidance, investors can execute a successful exchange. Here are some essential tips to make the process as smooth as possible:

Plan Ahead: Planning is the cornerstone of a successful 10-31 exchange. Begin considering the exchange long before selling the relinquished property to ensure ample time for property identification and replacement property research.

Consult with professionals: Engage with experienced tax advisors, real estate attorneys, and qualified intermediaries early in the process. Their expertise will help you navigate the rules and ensure compliance with IRS regulations.

Identify Replacement Properties Wisely: During the 45-day identification period, carefully consider potential replacement properties and their feasibility. Be mindful of the specific rules governing the number of properties that can be identified to avoid disqualification.

Choose a Reliable Qualified Intermediary: The Qualified Intermediary is a crucial component of the 1031 exchange process. Selecting a reputable and experienced QI will facilitate a seamless and efficient exchange.

Consider Replacement Property Financing: Ensure that you have access to the necessary funds to acquire the replacement property within the 180-day exchange period. Explore financing options in advance to avoid delays or missed opportunities.If you sell a property for $2 million with $1 million of debt that gets paid off at closing, you must still exchange that property for a property that costs at least $2 million. In the current market, many investors are not prepared for the cost and difficulty of getting replacement financing.

Document Your Intent: Maintain clear documentation of your intent to hold the properties for investment or business purposes. This documentation will be crucial in substantiating your qualification for the 1031 exchange.

Common Pitfalls to Avoid

While a 1031 exchange can be a game-changing tax strategy, there are common pitfalls that investors must avoid to ensure a successful exchange:

Failing to Use a Qualified Intermediary: Attempting to handle the exchange funds directly or using an unqualified intermediary can lead to constructive receipt of the proceeds, disqualifying the exchange. This is an unforgivable sin. Once you take constructive receipt of the funds, your exchange is disqualified. Engage a QI while your relinquished property is under contract.

Missing Deadlines: Strict adherence to the 45-day identification period and the 180-day exchange period is essential. Missing these deadlines can lead to the disqualification of the exchange and tax liability.

Inadequate Replacement Property Research: Rushing through the identification process without thorough research on potential replacement properties may lead to unsuitable investments. Many exchangers begin searching for their replacement property before they even put the relinquished property on the market.

Non-Like-Kind Property Exchange: Failure to invest in a property that qualifies as like-kind can disqualify the exchange and trigger capital gains taxes. You cannot sell a rental property and buy a vacation home. If the replacement property is used for personal purposes, it will not qualify for the 1031 exchange, resulting in tax liability.

Forgetting to Account for Closing Costs: Make sure to account for any closing costs, including title fees and brokerage commissions, to avoid potential boot, which could result in partial taxation.

Conclusion

The 1031 exchange offers real estate investors a powerful tool for deferring capital gains taxes and maximizing investment potential. However, successful execution requires a thorough understanding of 1031 exchange rules, strict adherence to deadlines, and the use of a qualified intermediary. By deferring taxes, increasing purchasing power, and diversifying portfolios, investors can leverage the 1031 exchange to build long-term wealth and achieve their financial goals.


Source: 1031 Exchange: A Comprehensive Guide

https://www.creconsult.net/market-trends/1031-exchange-a-comprehensive-guide/

Sunday, January 14, 2024

Forecasters Expect 1% GDP in Foreseeable Future

Forecasters Expect 1% GDP in the foreseeable future.

Three-quarters of the economists think the chance of a recession is a coin flip at most.

The National Association for Business Economists released its December 2023 economic outlook from a panel of 40 professional forecasters. Their take: 2023 will have seen stronger growth than they expected in October, but they think that growth will slow to 1% sometime between now and the fourth quarter of 2024.

A slowdown in growth, by the way, is not necessarily a recession. “Fewer respondents than in the October 2023 Outlook survey expect a recession within the next 12 months, with more than three in four assigning a probability of 50% or less,” said NABE President Ellen Zentner, chief U.S. economist, Morgan Stanley, in prepared remarks. “While most respondents expect an uptick in the unemployment rate going forward, a majority anticipates that the rate will not exceed 5%. Too much monetary policy tightness and broadening conflicts in Ukraine and the Middle East are cited as the largest downside risks for the U.S. economy.”

Looking at core inflation—looking at goods and services absent food and energy because their volatility makes it difficult to find trends—the forecasters largely expected it to continue slowing, but they doubted that it would hit the 2% level the Federal Reserve has been seeking before the end of 2024. The median forecast still sees headline CPI to reach 2.4% year over year by the fourth quarter of 2024.

If correct, that is a counter to market expectations of rate cuts in 2024, at least if the Fed keeps the ground that it has staked out. The central bank has made it clear that there won’t be rate cuts until inflation reaches that 2% level. Counting on a Fed retreat may be counterproductive and lead not only to disappointment but also to poor planning for the future.

But the panelists are largely convinced that even if 2% inflation isn’t in hand, there will be rate cuts. “More than two-thirds expect the [2% inflation] target will be reached in 2025 or later,” NABE Outlook Survey Chair Mervin Jebaraj, director, Center for Business and Economic Research at the University of Arkansas, says in prepared remarks. “Still, more than 80% of panelists believe interest-rate cuts will begin in 2024, with most expecting cuts to start in the second or third quarter of 2024. Expectations for the 10-year Treasury bond yield for year-end 2023 and 2024 are higher than in the October 2023 survey—at 4.6% and 4.1%, respectively.”


Source: Forecasters Expect 1% GDP in Foreseeable Future

https://www.creconsult.net/market-trends/forecasters-expect-1-gdp-in-foreseeable-future/

Price Reduction – 1270 McConnell Rd, Woodstock, IL Now $1,150,000 (Reduced from $1,200,000) This fully occupied 16,000 SF industrial propert...