🏢 FOR SALE: 42-Unit Suburban Chicago Multifamily Portfolio | $5.55M
Fully stabilized apartment portfolio across three well-maintained assets in Lyons & Chicago Ridge, IL — 100% occupied with strong in-place income and significant upside through rental increases.
🔹 42 Units Across 3 Stabilized Properties
🔹 Blended Current Cap Rate: 6.88% | Pro Forma: 8.50%+
🔹 Turnkey Management & Strong Tenancy
🔹 Recent Renovations With Value-Add Potential
🔹 Ideal for 1031 Exchange or Portfolio Expansion
📍 Portfolio Includes:
12 Units – 4337 Prescott Ave, Lyons, IL
🔗 https://creconsult.net/chicago-multifamily-listings/lyons-il-multifamily-portfolio-for-sale/
12 Units – 7821 43rd St, Lyons, IL
🔗 https://creconsult.net/chicago-multifamily-listings/multifamily-property-lyons-il/
18 Units – 9826 Sayre Ave, Chicago Ridge, IL
🔗 https://creconsult.net/chicago-multifamily-listings/chicago-ridge-il-multifamily-property-for-sale/
💼 Offered individually or together as a portfolio — a rare opportunity to acquire stabilized, income-generating suburban multifamily assets in strong rental submarkets.
📩 Contact:
Randolph Taylor, CCIM
📧 rtaylor@creconsult.net
📞 (630) 474-6441
Dave Snehal, CCIM
📧 dave.snehal@expcommercial.com
📞 (773) 230-8055
#multifamily #chicagorealestate #cre #1031exchange #realestateinvesting #suburbanchicago #multifamilyportfolio #valueadd #expcommercial
Monday, July 21, 2025
Monday, July 14, 2025
🚨 New Listing | 100% Leased Chicago Retail Investment 🚨
📍 3217–3229 W Montrose Ave | Albany Park, Chicago
💰 Offered at $995,000
Excited to bring this fully leased ±4,000 SF retail condo to market in one of Chicago’s most vibrant neighborhoods. Located along high-traffic Montrose Avenue with over 21,000 VPD, this property offers:
✅ 6 storefronts with service, food, and professional tenants
✅ 100% occupancy
✅ Flexible lease terms for upside potential
✅ Current rents avg. $20/SF, while market rents are ~$28/SF MG
✅ Pro forma cap rate: 8.37%
📈 Low submarket vacancy (3.1%) and strong tenant demand make this a prime opportunity to secure stabilized income with immediate rent growth potential.
🔗 Full details, photos, and financials:
👉 https://creconsult.net/chicago-retail-investment-property
Reach out with questions or to request the offering memorandum.
—
Randolph Taylor, CCIM
Vice President | eXp Commercial
📞 630.474.6441
📧 rtaylor@creconsult.net
#ChicagoRealEstate #RetailInvestment #CommercialBroker #AlbanyPark #PassiveIncome #CRE #RetailForSale #eXpCommercial
Wednesday, July 9, 2025
🏢 Two Adjacent Turnkey Office Buildings For Sale – Joliet, IL 🏢
Located just off Larkin Ave and adjacent to Ascension St. Joseph Medical Center, these two well-maintained office buildings offer flexible layouts, optional furnishings, and strong owner-user or investment potential.
📍 2435 & 2439 Glenwood Ave | Joliet, IL
🔹 2435 Glenwood: ±10,311 SF | $1,295,000
🔹 2439 Glenwood: ±9,410 SF | $1,100,000
🔹 Total: ±19,721 SF | Offered Individually or Together
🔹 Delivered Vacant | Elevator Access in 2435
🔹 Recently Renovated | Fully Furnished Option
🔹 Ideal for Medical, Office, or Professional Use
📂 View Full Listings & OMs:
➡️ 2435 Glenwood: https://creconsult.net/office-building-for-sale-joliet
➡️ 2439 Glenwood: https://creconsult.net/2439-glenwood-office-sale-joliet
—
Listed exclusively by:
Randolph Taylor, CCIM
Vice President | Broker – eXp Commercial
📧 rtaylor@creconsult.net
📱 (630) 474-6441
🌐 https://creconsult.net
—
#OfficeForSale \#JolietIL #CommercialRealEstate #TurnkeyOffice #CRE #MedicalOffice #OwnerUserOpportunity #ProfessionalOffice #OfficeBuildings #CREBroker #RandolphTaylor
Wednesday, July 2, 2025
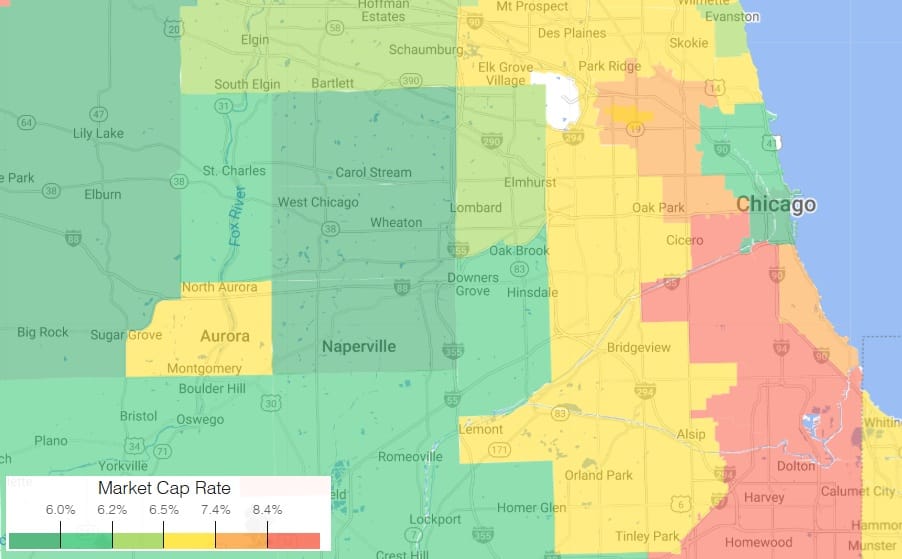
Chicago Multifamily Cap Rate Map: What Drives Investment Value
Chicago Multifamily Cap Rate Map: What Drives Investment Value
Understanding the Chicago multifamily cap rate landscape is essential for investment decisions in 2025. This thematic map offers more than just a visual of pricing — it reveals operational risk, submarket fundamentals, and asset class volatility that drive investor returns and pricing behavior.
Multifamily cap rates are uniquely complex. Unlike single-tenant net lease properties, where cap rates reflect tenant credit quality and lease duration, multifamily pricing is shaped by a dynamic mix of local economics, operational burdens, and tenant behavior.
Why Multifamily Cap Rates Behave Differently
Multifamily assets are short-term lease products with intensive operating models. Cap rates are influenced by:
Tenant churn and leasing friction
Market-specific demand volatility
Local policy factors (rent control, permitting)
Asset condition and cap-ex requirements
Class segmentation (Class A vs. B/C)
These factors result in cap rate spreads that reflect true income risk — not just credit quality. Net leased properties trade with narrow spreads because of credit-backed income streams, while multifamily spreads widen significantly due to greater unpredictability in NOI.
Read: Cap Rate Spreads: Understanding Multifamily Risk Premiums
2025 Trends in the Chicago Multifamily Cap Rate Market
Class A properties in neighborhoods like the Loop and North Lakefront trade in the mid-6% cap rate range, reflecting newer construction, institutional capital, and more predictable demand.
Class B/C stock in South and West Side submarkets often trades at 7.5–8.5%, pricing in turnover, deferred maintenance, and income fragility.
Citywide average: ~7.5%, though individual sales have ranged from 2.7% to over 20%, depending on property-level and locational risk.
Explore this in depth in the 2025 Multifamily Market Outlook
Interpreting the Cap Rate Map: Color as Risk and Opportunity
The map is not just a price guide — it’s a visual reflection of where investor risk premiums are most pronounced:
Green zones: Lower cap rates tied to stability, higher liquidity, and strong underlying demand
Red/orange zones: Higher cap rates due to rent stagnation, maintenance exposure, and affordability constraints
Class B/C assets in red zones may show low vacancy, but often have compressed rent potential and elevated cap-ex risk. Meanwhile, green zones often reflect stabilized assets with institutional appeal and longer-term appreciation upside.
Cap Rate Comparison: Multifamily vs. Net Lease
In net lease investments, cap rates respond to bond-like factors: credit ratings, lease term, and passive ownership. In contrast, multifamily cap rates are operationally intensive and respond to:
Rent collections and delinquencies
Turnover costs and resident churn
Capital expenditures
Micro-market volatility
As detailed in Cap Rate Spreads: Understanding Multifamily Risk Premiums, these layers of risk result in higher spreads — even in similar markets — making cap rates an expression of operational complexity rather than lease reliability.
For context on macro investment trends, see CBRE’s Multifamily Investment Outlook
Class A vs. B/C: Divergent Risk Profiles
Class A: Typically newer construction, higher-income tenant base, lower maintenance burden — and therefore tighter cap rates.
Class B/C: Older assets often require repositioning or increased management and capital, leading to higher cap rates but also potentially higher returns if well executed.
Interestingly, Class B/C properties have posted lower vacancy rates (~3%) than Class A (~8%) in recent quarters — due to affordability demand — but the true return calculus must factor in expenses, rent ceilings, and risk of turnover.
Investor Takeaways
Use cap rate maps as signals of risk, not just return.
Understand the operational burden behind higher yields — they may reflect friction, not opportunity.
Cap rate spreads reveal asset class truth — especially when comparing multifamily to credit-backed sectors.
Expect divergence by class and submarket — underwriting must be hyperlocal and asset-specific.
Cap rates are macro-sensitive — higher interest rates can tighten spreads and compress values fast.
Looking to position your asset for resale or value extraction? Start with our guide: Maximizing Your Multifamily Property’s Sale Potential
https://creconsult.net/chicago-multifamily-cap-rate-drivers/?fsp_sid=1152
Tuesday, July 1, 2025
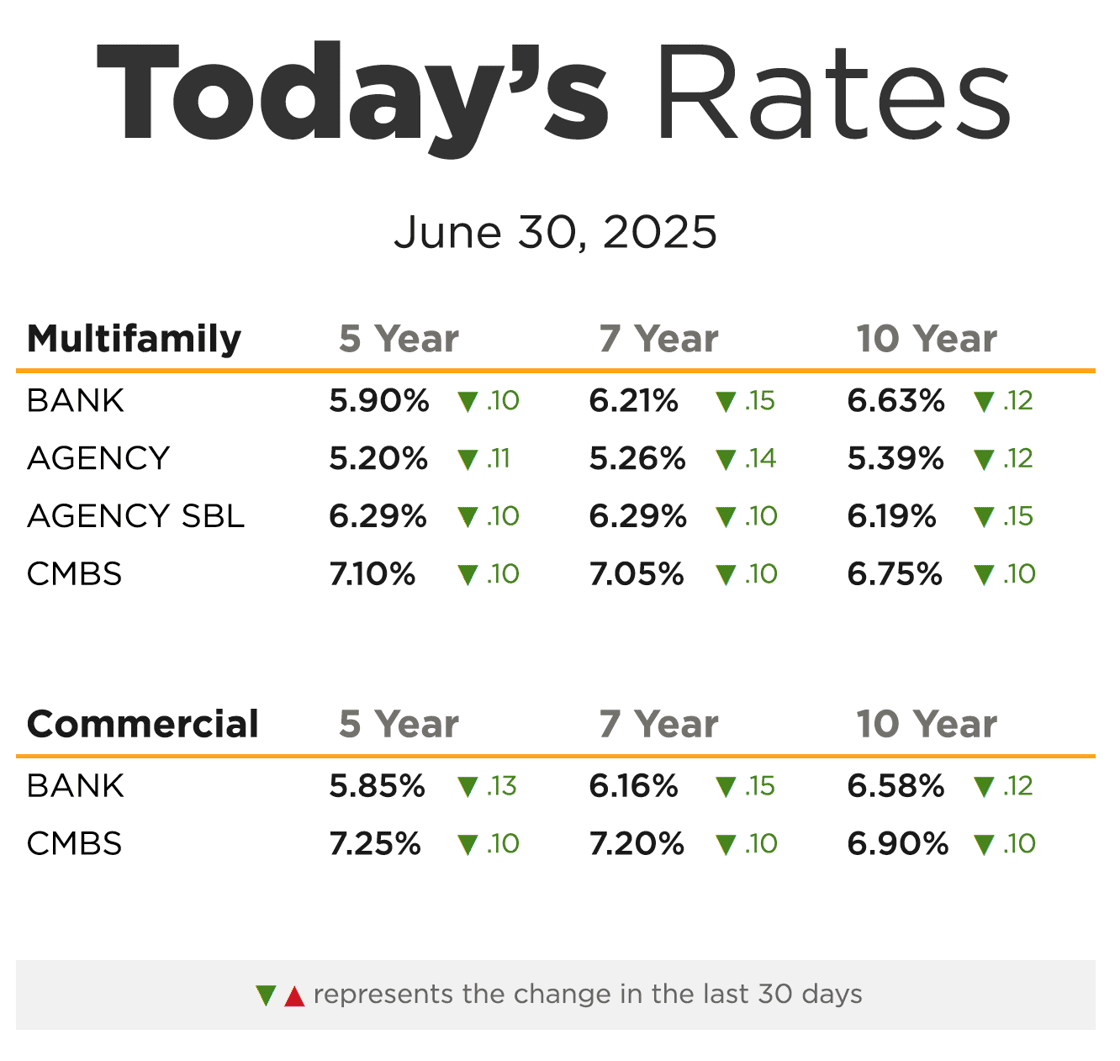
Chicago Multifamily Mortgage Rates June 2025 | Market Update
Introduction: Tracking Chicago Multifamily Mortgage Rates in June 2025
Chicago multifamily mortgage rates have dropped across most products in June 2025. These movements directly impact refinancing, investment acquisition, and underwriting strategies in the city’s multifamily sector. In this post, we break down the numbers and help you act on them.
Multifamily Mortgage Rates – June 2025 Overview
| Loan Type | 5‑Year | 7‑Year | 10‑Year |
|---|---|---|---|
| Bank Loans | 5.90% ▼ 0.10 | 6.21% ▼ 0.15 | 6.63% ▼ 0.12 |
| Agency Loans | 5.20% ▼ 0.11 | 5.26% ▼ 0.14 | 5.39% ▼ 0.12 |
| Agency SBL | 6.29% ▼ 0.10 | 6.29% ▼ 0.10 | 6.19% ▼ 0.15 |
| CMBS Loans | 7.10% ▼ 0.10 | 7.05% ▼ 0.10 | 6.75% ▼ 0.10 |
📌 Source: eXp Commercial Capital Markets
Why June 2025 Chicago Multifamily Rates Matter
With Chicago multifamily mortgage rates down this month, property owners and investors may want to reassess their lending strategies. Lower costs can open refinancing options, extend hold periods, or enable more aggressive acquisitions.
Key Lending Trends Impacting Chicago’s Market
1. Bank Loan Rates Provide Lower Entry
5‑Year rate: 5.90%, down from May.
Opportunity: Ideal for owners targeting short- to mid-term value.
2. Agency Loans Offer Stability
5‑Year rate: 5.20%, a notable decrease.
Best Use: Long-hold strategies for stabilized, higher-end assets.
3. Small Balance (SBL) Loans Trending Down
June 2025 multifamily SBL rates dropped 10 bps.
Use Case: Great fit for owners of smaller, workforce housing assets.
4. CMBS Remains Niche but Active
7-Year CMBS Rate: 7.05%
Strategic Use: Complex asset types, especially with portfolio-level financing.
Chicago Multifamily Investors: What to Do Now
Refinance if your current rate is over 6%.
Lock in loans before rates potentially rebound.
Partner with brokers who understand lending volatility and its effect on cap rates.
Chicago Multifamily Market Resilience
Despite rate fluctuations, Chicago’s fundamentals remain strong:
Demand for Class B and C properties is rising.
Submarkets like Bridgeport, Albany Park, and Bronzeville are attracting interest.
Broad employment base supports rental income stability.
Need Guidance on Chicago Multifamily Mortgage Rates?
With over two decades of experience, I help owners and investors navigate every rate shift with precision. From property valuation to debt strategy, I provide insights that maximize ROI.
📞 (630) 474‑6441
📧 rtaylor@creconsult.net
🌐 More multifamily insights
https://creconsult.net/?p=135668&fsp_sid=1118
Chicago Multifamily Market 2025: Rents & Cap Rates

The Chicago multifamily market remains one of the strongest in the country midway through 2025, with robust rent growth, competitive cap rates, and high investor interest. Despite broader economic uncertainty, Chicago continues to outperform many national peers due to its steady rental demand and limited new supply.
Tight Supply and Rising Rents in the Chicago Multifamily Market
Vacancy Rate: 4.7%, among the lowest in large U.S. metros
12-Month Rent Growth: 3.8%
Effective Rent Forecast for 2025: 5.3%
Average Asking Rent: $1,888/month or $1.60/SF
Absorption (12 Months): 10,153 units vs. 5,433 delivered
Units Under Construction: 8,286 (1.4% of inventory)
Chicago’s development slowdown, combined with population stability and international migration, continues to push asking rents higher across submarkets.
See our previous full-year analysis for comparison.
Aurora Submarket Insight: Suburban Value and Investment Stability
In suburban Aurora, IL, investment metrics show:
Effective Rent: $1.24/SF
Vacancy: 3.5%
Under Construction: 246 units (delivery expected Jan 2026)
Rent Growth (YoY): 3.4%
Recent Deals: Prices range from $77,000 to $190,000/unit depending on size and finish
Aurora’s affordability and low vacancy rates make it an attractive target for value-add multifamily investment.
Cap Rates, Price Per Unit, and Market Velocity
Sales Volume (Past 12 Months): $4.4 billion
Average Cap Rate: 6.2%
Price Per Unit: Typically ranges from $150,000–$275,000 in metro Chicago
Price Per SF: Averages $185–$325 depending on asset location and class
Although the transaction pace has eased from 2021 highs, Chicago’s multifamily investment market remains active, particularly in high-demand suburbs and core neighborhoods.
Multifamily Market Outlook: 2025–2026
With a historic slowdown in construction and continued population gains, rent growth is expected to accelerate. Submarkets with favorable fundamentals, like Aurora, Naperville, and Elgin, are poised to deliver higher returns for long-term investors.
Stay updated via CREConsult’s market insights and sign up for our monthly newsletter.
https://creconsult.net/?p=135678&fsp_sid=1135
Thursday, June 19, 2025
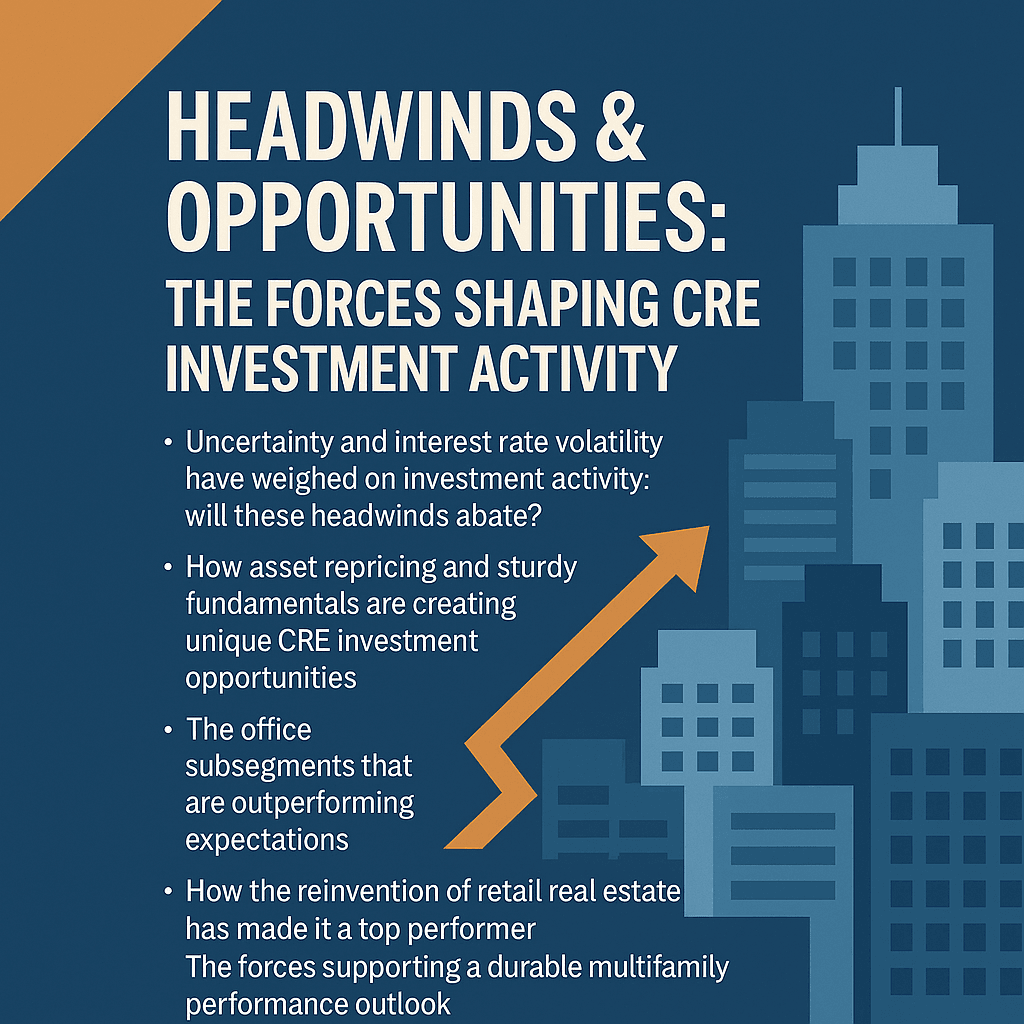
Commercial Real Estate Market Trends: 2025 Industry Insights
Introduction
In 2025, the real estate world looks different. Warehouses are booming, retail is rebounding, and suburban office spaces are outshining their urban counterparts. These changes are creating new opportunities—and challenges—for investors. In this article, we’ll break down the trends shaping today’s real estate market and what they mean for your next move.
Section 1: Commercial Real Estate Is Not One-Size-Fits-All
Smaller Deals Are Shaping the Market
Even though the headlines focus on billion-dollar buildings, most real estate deals today are much smaller. In fact, over 80% are under $10 million. These deals, often led by families or small firms, have a major impact on local markets.
Industrial Growth Is Leading the Way
Warehouses and storage facilities are in high demand. In places like Québec, rents could increase by up to 12% in 2025. This demand comes from the ongoing rise in e-commerce and the need for better supply chains (Colliers Forecast).
A Tale of Two Office Markets
Office buildings show a big divide. Older offices in city centers are seeing vacancy rates near 30%. On the other hand, suburban offices built after 2010 have rates closer to 11%. This shows how age and location now matter more than ever.
“Suburban offices built after 2010 are averaging about 11% in vacancy, compared to almost 30% for older downtown spaces.”
Section 2: Rates, Tariffs, and Market Uncertainty
Interest Rates Shake Up Values
Since 2022, interest rates have jumped up and down. That makes it tough to figure out how much a property is really worth. Buyers want lower prices, and sellers want yesterday’s rates. As a result, deals are slowing down.
Timing Is Everything
Even though there’s a pause now, lower mortgage rates are expected in 2025. That could make it easier to buy or sell. If you can wait out the current uncertainty, better conditions may be just around the corner.
Tariffs Add to the Pressure
Building costs are changing fast because of tariffs. Since these affect materials and labor, developers are putting projects on hold. That slowdown could keep supply tight in some markets, pushing up rents and values.
Section 3: Retail and Multifamily Stay Strong
The Retail Comeback Is Real
Retail is bouncing back—especially in local neighborhoods. Empty malls are being turned into gyms, health clinics, or delivery hubs. Since fewer new stores are opening, prime retail locations are seeing stable rents and low vacancies.
Renting Keeps Growing
Buying a home is tough right now. Prices are high, and interest rates are still a factor. Because of this, more people are choosing to rent. That’s good news for multifamily housing, which is seeing record demand in many cities.
Conclusion
The real estate market today is complex but full of opportunity. Smaller deals are becoming more common, and industrial spaces are seeing rapid growth. Offices are split between struggling downtown towers and thriving suburban buildings. Meanwhile, retail and rental housing continue to perform well.
Helpful Links
Learn more: CRE Investment Strategy Guide
Read next: Multifamily Market Insights
Data: Colliers 2025 Industrial Report
Rate trends: Federal Reserve Monetary Policy
https://creconsult.net/commercial-real-estate-market-2025/?fsp_sid=1035
Subscribe to:
Posts (Atom)