|
||
|
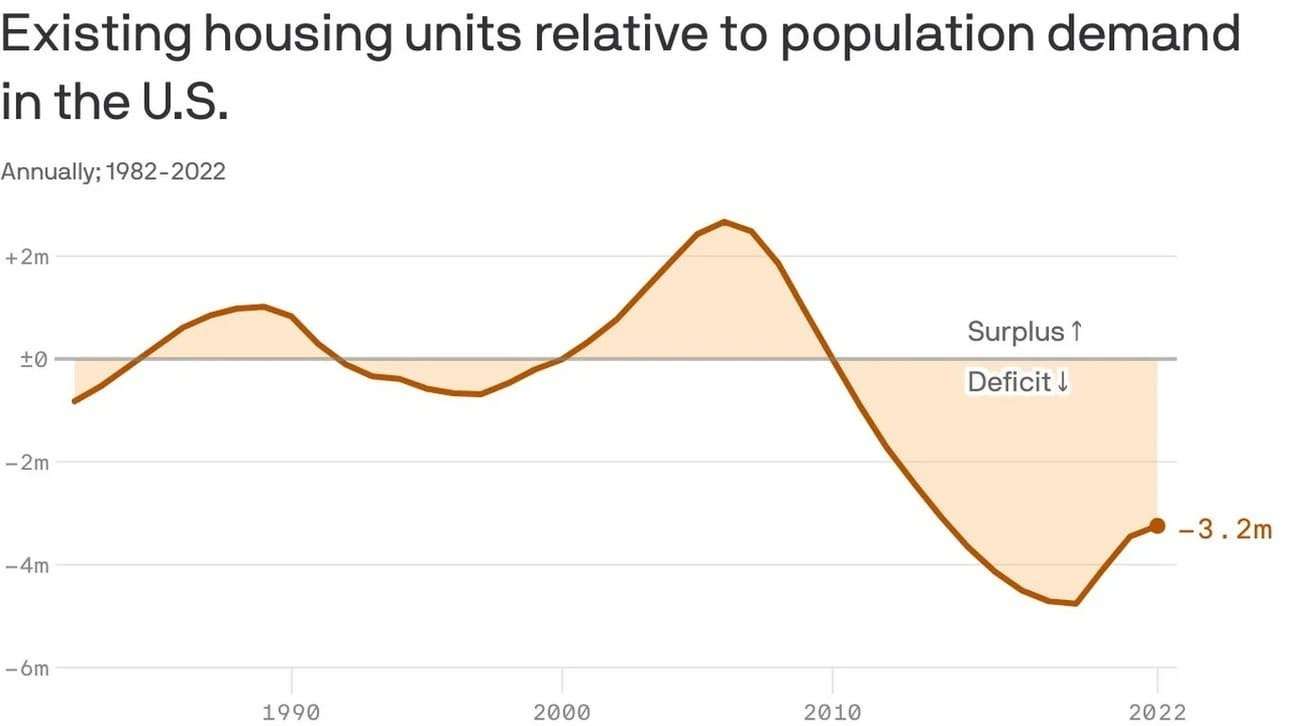
America’s housing shortage explained in one chart The United States faces a significant housing shortage, with a deficit of approximately 3.2 million homes. This shortfall, which represents about 2.5% of the total U.S. housing inventory as of 2022, is a major contributing factor to the sustained high prices in the housing market. This chart underscores a critical issue: the supply of homes is not keeping pace with the growing number of households, impacting affordability and availability in the housing market. |
Source: America’s housing shortage explained in one chart
https://www.creconsult.net/market-trends/americas-housing-shortage-explained-in-one-chart/

No comments:
Post a Comment