Monitoring the Cost of Homeownership vs. Cost of Renting in Your City
Rent vs. Own Psychology
The battle between renting and owning is intuitive. If renting is significantly cheaper than owning a home, more of the population will gravitate towards renting. If homeownership is only moderately more costly than renting, people will be more inclined to pursue ownership.
As a multifamily investor, you can get in trouble if you lose sight of this. Sometimes, you'll see evidence of rent growth in the submarket, within the rent comps, and even at the property. However, the price of homeownership in the market will always act as a governor, regardless of what the rent data says.
I think of 30% as the "danger zone." In other words, when the cost of homeownership is less than 30% more costly than renting, prospective renters start gravitating towards homeownership. While 30% is still a wide margin, the benefits of homeownership can eat into that:
- Tax benefits
- Appreciation
- Stability of long-term fixed mortgage
- Principal Loan paydown
High Cost-of-Living States
Realistically, some U.S. cities never have to worry about rents creeping into the "danger zone." Coastal cities like Los Angeles, San Francisco, New York, and Seattle have always been supply-constrained. Further factoring in rising interest rates, the cost of homeownership vastly exceeds renting costs. I'll show you some concrete examples of how this could look later in the article.
However, markets in the Midwest, Great Plains, and tertiary cities around the county could run into instances where housing costs fall in line with rentals (or at least close to it). Investors would be wise to monitor homeownership vs. rental trends as the cost of homeownership could be a real threat to rental fundamentals.
Tracking Rental & Ownership Costs
To look at a city and figure out a “homeownership vs. renting cost delta trend,” we will need to collect a few pieces of historical information:
- Submarket Rents
- Submarket Home Values
- Mortgage Rates
- Other Homeownership Costs (MIP, insurance, property taxes)
I want to collect the bulleted information for three different dates:
- Current: 07/2023
- Pre-Inflation: 07/2021
- Pre-Covid: 07/2019
The current date will reflect the cost of homeownership with high mortgage rates. Pre-inflation will give us the idea of homeownership with artificially low-interest rates. And finally, pre-covid data is potentially more of a "normalized period" before the pandemic, mild recession, stimulus, and aggressive rate hikes.
For MSAs, let's pick:
- Memphis
- Detroit
- San Francisco
We will research and gather rental, home value, mortgage rates, and other homeownership costs for each city at three defined periods.
MSA Rent Trend Research
I'm going to focus on the Memphis "metro" rents (specified in column "B") as opposed to "city" rents.

I'm focusing on 2BR rents as those are more comparable to a house. I will now grab the gross rent for the following dates from the download:
- 07/2023 = $1,155
- 07/2021 = $1,082
- 07/2019 = $902
MSA Home Valuation Research
I'm going to focus on the Memphis "MSA" valuations (specified in column "D")

I will now grab the home valuations:
- 07/2023 = $236,067
- 07/2021 = $198,096
- 07/2019 = $153,971
Mortgage Rate Research
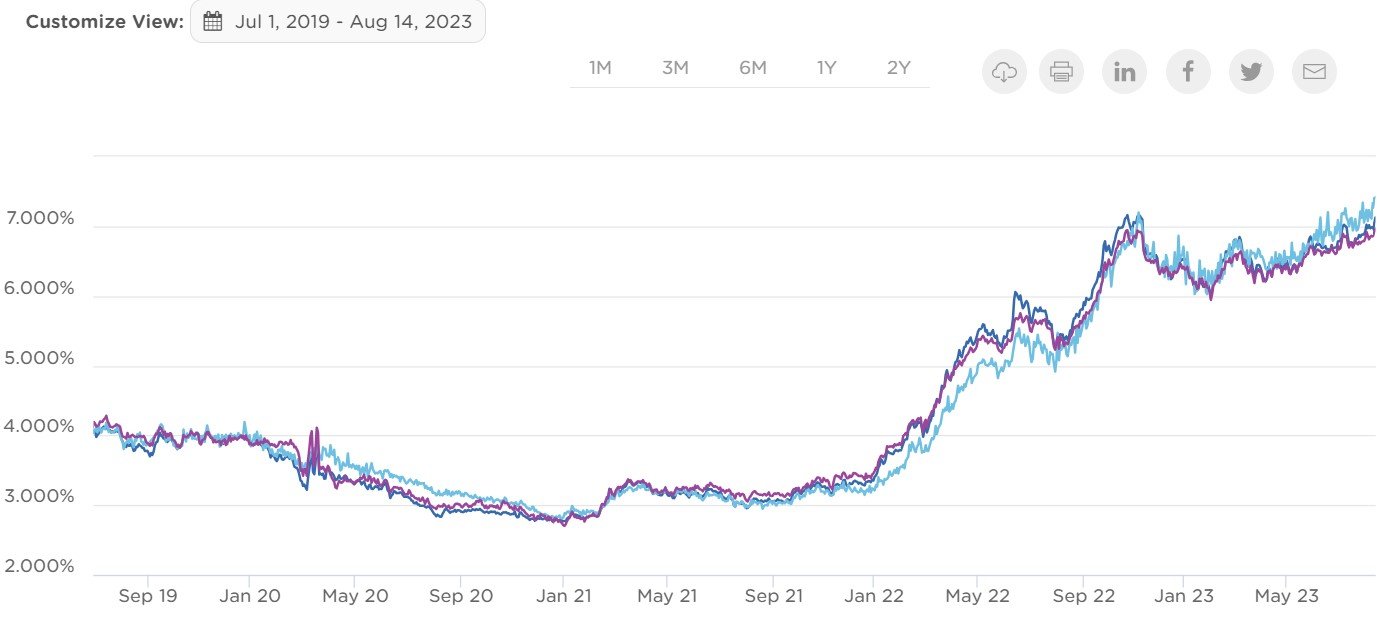
Let's use OptimalBlue to get mortage rate information. I set a custom range and grabbed the 30-year conforming interest rate (dark blue line) on the last business day of July in 2019, 2021, and 2023

- 07/2023 = 6.881%
- 07/2021 = 2.987%
- 07/2019 = 4.048%
We need to estimate a few more variables to calculate a mortgage payment and the interest rate.
- Loan Amount
- Loan Term (Amortization)
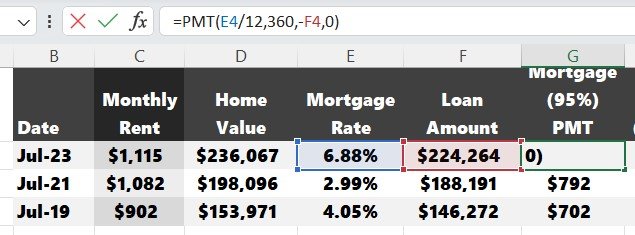
Let's assume the loan amount is 95% of the home valuation. The minimal down payment for a conventional loan is 5%. We'll use a 30-year loan term. Now, we can calculate a corresponding mortgage payment for each home valuation we pulled from Zillow Research.
Other Costs Research
The mortage payment is only one of the financial obligations you’ll face if you own a home. You'll also have to insure the home, pay property taxes and mortgage insurance if you're down payment is less than 20%.
These costs add up, and it's important to factor them in when comparing homeownership to renting (this analysis won't include repairs and maintenance but should also be considered).
First, let's calculate the MIP. This calculation depends on factors such as credit score, total loan amount, and your lender. For now, we will keep it simple and assume the annual MIP expense is 0.75% of the loan amount.
Use the Census Bureau's "quick facts" page for other property taxes and insurance costs. It's located in the "Housing" section once you select your city (Memphis). This information is titled:
"Median selected monthly owner costs - without a mortgage, 2017-2021" = $464

I will use this assumption for the years 2019 and 2021
- 07/2023 =
- 07/2021 = $464
- 07/2019 = $464
The data is stale (2017-2021), and considerable inflation has happened since 2021. I will increase this number by 20% for the 2023 entry. Since property taxes tie out to home values (which have increased considerably), and insurance has also increased, 20% feels like a fair adjustment.
- 07/2023 = $464 x 1.20 = $557
- 07/2021 = $464
- 07/2019 = $464
Compiling Rental vs. Ownership Data
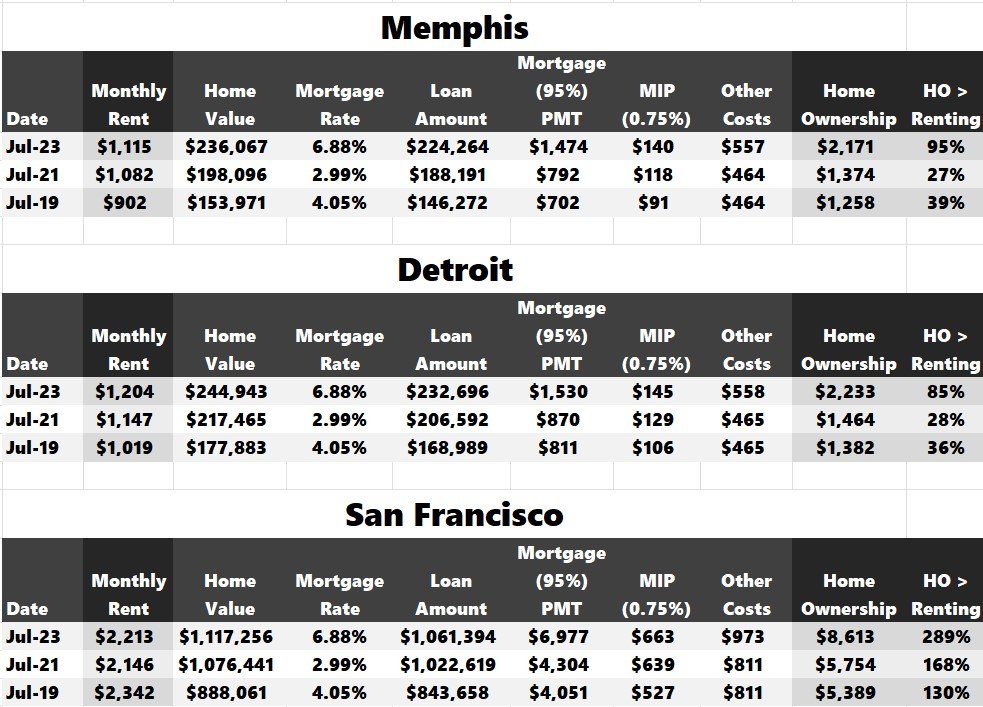
Let's go ahead and compile all the data we've collected thus far.

Note: The “Mortgage Payment” column is just a PMT function in Excel.

MIP is taking the loan amount multiplied by 0.75% and diving by 12 months.
We’re ready to add two more columns to determine the total monthly homeownership cost and how much more costly it is than renting.

In July 2021, it was 27% more expensive to own than rent, flirting with "the danger zone." However, skyrocketing interest rates have caused homeownership costs to increase significantly more than rents over that same period (nearly 2x more expense to own in 2023).
Note: We're only comparing average 2BR rents in Memphis to the average homeownership cost. The next step would be to plug in your proforma rents for your proposed property.

If you were targeting $1,250 for a class B value-add in 2019, it would have been a tough sell to potential renters on the fence about homeownership. Costs are nearly identical between rent and own. However, present day, there’s a much more prominent buffer.
It's also important to note that this data is in constant flux. You should check back in at least twice a year. Housing values could start to deteriorate if rates stay high, leading to homeownership costs falling closer to rents.
We can also repeat the same steps for Detroit and San Francisco and compile those results.

Detroit is similar to Memphis. It's a market that has flirted with homeownership being a better deal than renting. Homeownership was likely more financially prudent than renting luxury units in Memphis and Detroit before rates spiked over the past year.
San Francisco is on the other end of the spectrum. Homeownership has never really been affordable compared to renting. Rents have declined since 2019, and owning a home is almost 4x more expensive than renting.
Many markets require a multifamily investor to be very in tune with the residential housing market because there are periods when renting and owning compete with each other.
If you miss this realization, it could be a costly lesson during your ownership tenure.
Conclusion
You want to understand how big of a threat homeownership is in the city you invest in. You can skip this step if you're an investor in San Francisco, Los Angeles, Boston, or other high cost-of-living coastal markets.
However, if you invest in condos converted to apartments in Detroit or a build-to-rent luxury development in Memphis, you'd be wise to ensure your rent projections aren't in the "danger zone."
Some other rental property types that may be more prone to competition from homeowners are:
- Converted condos
- Townhome rentals
- Build-to-Rent
- Luxury (Class A)
Gathering the pertinent information and checking this diligence item off your box will take a few minutes once you're proficient. Once you confirm a reasonable buffer between your rental and homeownership, you can underwrite your proforma rents with information from comps, submarket outlook, and historical trends.
Source: Monitoring the Cost of Homeownership vs. Cost of Renting in Your City
https://www.creconsult.net/market-trends/monitoring-the-cost-of-homeownership-vs-cost-of-renting-in-your-city/
No comments:
Post a Comment