1,500–3,673 SF | $26/SF MG
1120 E Ogden Ave., Suite 101, Naperville, IL 60563
Broker: Randolph Taylor, rtaylor@creconsult.net, 630.474.6441
https://www.creconsult.net/retail-office-for-lease-1120-e-ogden-ave-suite-101-naperville-il-60563/


Multifamily sellers: How to qualify a buyer before going under contract
As the seller of a multifamily asset, it’s crucial that the buyer you select is the best possible prospect for your property. Don’t waste time, money, and opportunities: you must ensure they’re qualified and can close and execute the contract as signed.
Keep reading to learn why it’s essential to qualify a buyer before going under contract on your multifamily property and how to do it.
Why do I need to qualify a buyer?
It’s important to close with the first buyer you select. If you don’t, each buyer after that will ask themselves, “What did that other buyer discover about this property that I am missing?”.
When you enter into a contract with a refundable deposit, you’re basically giving your chosen buyer a free option on your property for a period of time, typically 30–60 days. Before you proceed, you must be confident that they can close and execute the contract as signed.
What’s more, your tenants and staff will be disturbed throughout the contract process. To minimize the period of disruption, you should do all you can to ensure the transaction will close successfully at the end of the contract process.
As a seller, you’re required to provide due diligence information to the prospective buyer. When you qualify your buyer, you’ll greatly reduce the risk of wasting a lot of time and doing a lot of work only to not close on the property.
How do I qualify a buyer?
Before you sign the contract, make sure that your prospective buyer can provide certain items. Always ask them for the following:
– Proof of funds
– Lender pre-qualification
– A list of the other properties they own
– A list of the sellers and agents that they have worked with
For added reassurance, it’s recommended that you call the buyer’s lender to confirm their pre-qualified status. You can also call the agents, sellers, and buyers they’ve closed with in the past to enquire about how the transactions went.
Has the buyer toured the property in person before making an offer? Have they reviewed the due diligence information beforehand? If they have, this is a great sign. It’s proof that they have seen and have taken into account any issues with your property, and this greatly reduces the chances that they may later want to back out of the sale, saying they were unaware of the building’s condition. Be very wary of a buyer who doesn’t tour your property in person.
A prospective buyer who shows they’re motivated and wants to move quickly is also a great sign for a successful closing. The shorter the due diligence period, the better, and the larger the deposit, the better.
When you spend the time making sure your prospective buyer fulfills these criteria, you’ll put yourself in a great position to close successfully and ensure a quick and smooth transaction.
If you need help selling your multifamily property, eXp Commercial is here. Our objective as your multifamily advisor is to help you achieve your investment goals: from determining the listing price to selecting the best buyer and handling the sale process through to the closing, we’ll facilitate a smooth transaction for you.
Source: Multifamily sellers: How to qualify a buyer before going under contract
https://www.creconsult.net/market-trends/multifamily-sellers-how-to-qualify-a-buyer-before-going-under-contract/
One of the most important ways to use all of the data gathered in a real estate market analysis is to examine the supply and demand factors for a particular type of real estate. For example, an investor considering the construction or purchase of a new multifamily residential property uses the market analysis to determine what cash flows they can expect to receive given the expected demand for units. The demand must be high enough to generate cash flows that provide a rate of return high enough to make the investment feasible.
In order to estimate the demand for multifamily housing units, it is necessary to understand recent population growth trends for the city. Then, it’s important to consider the major industries in the market area and the forecasted growth for those industries over the next few years. You can then put this information together to forecast multifamily housing demand and compare that demand to the existing and proposed supply of multifamily units. This case study takes data about population and industrial activity in the Orlando, Florida region and analyzes supply and demand of multifamily residential units in the region.
Recent data from the U.S. Census Bureau and the Orlando Economic Development Commission lists the total population of the Orlando metro area at 2,387,138 (2016). Between 2015 and 2016, the population of the Orlando metro area grew by 2.6%. That made Orlando the fastest growing region in the United States. The Orlando Economic Development Commission estimates that population growth in the region since 2000 equates to a gain of 138 people per day. Population growth is mostly fueled by domestic migration. Americans moving to Orlando for retirement in warmer weather or for new career opportunities account for about 40% of the population increase. International migration (mainly from Central and South America) accounts for 34% of the increase in population. People have been moving to the Orlando area due to the region’s comparative advantages (climate, entertainment and lifestyle, and economic growth). Without these advantages, Orlando would not be one of the fastest growing regions of the country.
With an average household size around 2.5, that means there are an estimated 954,855 households in the Orlando metropolitan area. Data from the American Consumer Survey indicates that about 43% of the population is renters. So, 43% of households would give an estimated demand of 410,588 multifamily units. In reality, not all renters live in multifamily units since many rent single-family homes. Therefore, it is necessary to estimate how many of those renters occupy multifamily units.
A 2016 report from Fannie Mae estimated that there were 156,000 multifamily units in the Orlando metro area with a 5.75% vacancy rate. So, in 2016 there were around 147,030 occupied multifamily units (156,000 x (1-.0575) = 147,030). This means an estimated 35.8% of the households that are renters occupy multifamily units while the remaining 64.2% of renters occupy single-family homes.
Employment data from the Bureau of Labor Statistics confirms that economic growth is driving the population growth in the Orlando metro area. In fact, job growth from 2015-2016 in Orlando was over twice the national average. A strong economy and growth in the number of jobs indicates that the population should continue to grow over the next few years unless there is a major shift to the national economy or a natural disaster. Furthermore, the job growth rate of 4.22% exceeded the population growth rate of 2.6%. If the major industries in Orlando continue to grow at this pace, more new workers will need to move into the region to fill these new jobs. So, forecasted population growth may be higher than the average of 2% seen over the past 10 years. It might be more appropriate to estimate population growth of at least 3% annually.
| Area | Industry | Annual Average Employment | Change Employment 2015-2016 | Growth Rate | |
| 2016 | U.S. TOTAL | Total, all industries | 141,870,066 | 2,378,367 | 1.71% |
| Orlando-Kissimmee-Sanford, FL MSA | Total, all industries | 1,157,536 | 46,844 | 4.22% | |
| 2015 | U.S. TOTAL | Total, all industries | 139,491,699 | ||
| Orlando-Kissimmee-Sanford, FL MSA | Total, all industries | 1,110,692 |
Using a Location Quotient Analysis, Orlando has a competitive advantage in the services, construction, and leisure and hospitality industries. All of these industries should remain strong over the next few years as long as the national economy continues to grow and national unemployment remains low.
| Industry | Location Quotient |
| Goods-producing | 0.664674599 |
| Natural resources and mining | 0.330605357 |
| Construction | 1.213038593 |
| Manufacturing | 0.41740123 |
| Service-providing | 1.143132811 |
| Trade, transportation, and utilities | 0.99493952 |
| Information | 0.983670576 |
| Financial activities | 1.092321103 |
| Professional and business services | 1.153196509 |
| Education and health services | 0.819187622 |
| Leisure and hospitality | 1.952753058 |
| Other services | 0.993404995 |
| Unclassified | 0.13973717 |
The economic base analysis of the Orlando metro area showed that the region has an economic base multiplier of around 1.5. This means that if one of these base industries created an additional 100 jobs, the entire region would have a resulting total employment increase of 150 jobs. If only leisure and hospitality, services (providing), and professional and business services all created the same number of jobs the following year, it would cause additional job growth of around 28,000. So, there is the possibility for continued high population growth in the region.
| Industry | Annual Average Employment | Change Employment 2015-2016 |
| Total, all industries | 1,042,526 | 43,773 |
| Goods-producing | 113,104 | 7,874 |
| Natural resources and mining | 5,052 | -324 |
| Construction | 66,175 | 6,884 |
| Manufacturing | 41,878 | 1,314 |
| Service-providing | 929,422 | 35,899 |
| Trade, transportation, and utilities | 219,205 | 7,049 |
| Information | 22,448 | -292 |
| Financial activities | 70,887 | 1,340 |
| Professional and business services | 188,416 | 10,818 |
| Education and health services | 144,734 | 5,111 |
| Leisure and hospitality | 247,860 | 9,333 |
| Other services | 35,563 | 2,808 |
| Unclassified | 310 | -266 |
The simple analysis presented above estimated that the demand for rental units in 2016 was around 147,030. Consider a situation where the Orlando metropolitan area had a supply of 156,000 multifamily units that year and a vacancy rate of 5.75%. If the population grew by 3% per year and the proportion of renters stayed the same, by 2018 the demand for multifamily units would fill all of the existing supply. So, there is clearly a demand for additional multifamily units. How many new units could the market absorb each year?
| No new supply | |||
| 2016 | 2017 | 2018 | |
| Total units | 156,000 | 156,000 | 156,000 |
| Vacant | 8,970 | 4,559 | 16 |
| Multifamily Renters | 147,030 | 151,441 | 155,984 |
With a population growth of 3% and a similar proportion of apartment renters, that would mean the multifamily renting population in the Orlando metro area would grow by between 4,500 and 5,000 units per year. Real estate developers would need to increase the supply of multifamily units by a minimum of 3,250 per year just to meet the housing demand through 2022. Here’s what the forecasted supply and demand would look like if real estate developers delivered 5,000 new apartment units per year:
| 5,000 new units annually | |||||||
| 2016 | 2017 | 2018 | 2019 | 2020 | 2021 | 2022 | |
| Total units | 156,000 | 161,000 | 166,000 | 171,000 | 176,000 | 181,000 | 186,000 |
| Multifamily Renters | 147,030 | 151,441 | 155,984 | 160,664 | 165,484 | 170,448 | 175,562 |
| Vacant | 8,970 | 9,559 | 10,016 | 10,336 | 10,516 | 10,552 | 10,438 |
| Vacancy rate | 5.75% | 5.94% | 6.03% | 6.04% | 5.98% | 5.83% | 5.61% |
This example provided a simple method for using data from a real estate market analysis to forecast apartment unit demand. A more in-depth forecast would consider actual growth forecasts in key industries, a more detailed look at actual supply and construction permits for multifamily units in the area, and how changing economic factors could influence the percentage of the population that chooses to rent rather than to buy a home. The results from the final chart considering changes in supply and demand over time can also be extended to consider the growth rate of expected market rents. Although the detailed inputs can become more complicated, the basic framework for analysis is the same.
Source: How to Analyze Supply and Demand For Apartment Buildings
https://www.creconsult.net/market-trends/how-to-analyze-supply-and-demand-for-apartment-buildings/

The first step in creating a market analysis is to define the market area of the subject property. The market area is the most probable geographic area that the subject property will service. The size of the market area is dependent upon the type of property it is and the service it provides. For example, the market area of a convenience store is relatively small. The majority of the customers the convenience store serves typically live in less than a one-mile radius of its location. On the other hand, a larger community center development may include a variety of retail stores and offices that serve an area within around a ten-mile radius.
Typically, the general market area is the smallest geographic area that has publicly accessible economic and demographic data. The neighborhood is the area that includes any major competitors to the subject property. Consider where the subject property’s neighborhood is in the neighborhood life cycle. The life cycle contains four stages. In the growth stage, there is a lot of new construction, and the population in the area increases at an above-average rate compared to other neighborhoods in the area.
At some point, however, the growth rate slows, the neighborhood becomes fully developed, and the period of stability begins. Depending on development trends in the area along with the overall physical characteristics of the improvements, a neighborhood could remain in a relatively stable part of its cycle for a long time. During this period, vacancy rates are stable, and prices generally increase along with the national average.
Eventually, the neighborhood will begin to decline as the economic welfare of the area declines or the real estate begins to fall into disrepair. This stage is characterized by falling property values and high vacancy rates.
Often with some local government intervention, however, the neighborhood undergoes revitalization. Urban renewal or gentrification efforts bring new residents and businesses into a neighborhood in which prices are at their lowest levels. Businesses and residents are enticed into the area by the low prices along with promises of tax breaks. If successful, a neighborhood can begin the life cycle again by transitioning into a new growth phase.
Population trends can help illustrate these changes in the neighborhood. Trends in census data over time help to tell the story of the area. The market analysis should consider the population size, household size, age distribution, marital status, education level, and employment rate for the residents in the area. Population growth is fueled by economic and employment growth. In some areas, however, population growth is fueled immigration or retirement destinations in warmer locations. Population growth of this kind can bring both unique opportunities and challenges into an area, and it is important to consider those long-term implications.
There are many good data sources available for free online to assist with a demographic analysis. The U.S. Census Bureau provides extensive population and demographic data, but the only problem is the gap in the data points, since they only gather data every ten years. The Federal Reserve collects economic and financial data, and the Department of Housing and Urban Development provides access to housing data. Depending on the size of the area and the level of detail needed for the market analysis, private sources of data may be required. There are a variety of companies that provide demographic and economic data for a fee.
| Type of Data | Sources of Data |
|---|---|
| Population size and demographics | US Census Bureau |
| Unemployment rate | Bureau of Labor Statistics |
| Household income | Bureau of Labor Statistics; US Census Bureau |
| Housing prices | FRED economic research; HUD |
| Interest rates | FRED economic research |
| Daily traffic counts | Data.gov |
| Public schools | Data.gov |
| Building permits | Data.gov; Local city offices |
| Commercial real estate sales | Costar; LoopNet |
For example, here are some demographic data comparing the population of Orlando to both the state of Florida and the United States overall. One of the first observations about Orlando is that the population is comparatively young and more likely to speak Spanish compared to other parts of the state and the country. The area is densely populated. The demographic section of the market analysis would include additional data about education, age, and income over time. Growth rates illustrate the dynamic population characteristics of an area.
Population trends are an important component of understanding the real estate market in an area. Specific demographic groups have shopping preferences that can influence retail development. Populations with an older average age may need more office space and medical facilities. Areas with young or transient populations may need more of the overall housing supply dedicated to apartments and condominiums.
In addition to analyzing the population and economics of the market area and neighborhood, it is important to analyze the competition. What other properties in the area are supplying the space market for a particular property type? Find out what rental rates competitors charge and their average vacancy rate. Consult the public records in the area to find if there are any permits for new construction in the area that will also change the current supply levels and create additional sources of competition for buyers and tenants.
Organizations such as the Urban Land Institute publish statistics such as the typical retail sales per square foot across the country. After researching the typical per capita sales or per capita demand for the subject property type, research the current sales volume and rents for competitors in the market area. The population data forecasts expected demand based off growth expectations. The current real estate data show whether the existing supply of real estate is less than, greater than, or matching the current and projected national average sales or demand per square foot of space. Although the influences on supply are generally the same across property types, the demand influences can differ across commercial property types.
For instance, consider and example neighborhood with a population growth rate of a steady 3%, and a projected population of around 27,500. Multiply that population by the national forecasted per capita sales in the next year. If projected per capita sales for a specific type of retail store was $175, sales demand in the area would be $4,812,500 next year.
Then, divide that sales demand by the typical sales per square foot for similar stores around the country. If the average store had typical sales of $140 per square foot, that would equal a square footage demand in the area of 34,375 square feet. Consider whether the market area currently has less than or greater than that amount of square footage devoted to serving this demand. If demand is greater than the current supply, current owners may earn higher than average per capita sales, but there is also room for the market to absorb additional supply of real estate. If demand is less than current supply, the market tends to have lower than average sales and rents along with higher than average vacancy rates. Population demographics also determine suitable absorption rates for new developments, which is the length of time it takes to reach a stabilized occupancy level for a new commercial property.
The multiplier effect describes the propensity for economic activity to lead to job growth, population growth, and rising income levels in a region. This is why a real estate market analysis needs to include information about the population and the industries that create the local economy. In general, the higher the skill and education level requirements of the industry, the greater the multiplier effect is on the local economy. For that reason, areas with a strong technology presence are considered to benefit the most from the multiplier effect. Industries that require relatively low skill and low levels of education also have the lowest multiplier effects. Forecasting potential growth in the demand for particular types of real estate should consider the impact of economic growth in local industry along with its propensity to create new jobs and higher income for the region. The multiplier effect models changes in aggregate demand caused by cash injections into the local economy.
The intensity of the multiplier effect is represented by the change in real GDP divided by the change in the amount of cash injected into the economy.
Multiplier (k) = change in real GDP / change in cash injections
In a simple economy, the multiplier can also be represented as a function of the population’s marginal propensity to consume and marginal propensity to save. Where the marginal propensity to save is 10% and marginal propensity to consume is 90%, the multiplier effect is 10.
k = 1/marginal propensity to save = 1/.1 = 10
k = 1 / (1-marginal propensity to consume) = 1 / (1-.9) = 10
For example, a cash injection of $100,000 into the economy gets paid out as wages and then spent in the local economy on goods and services. Local businesses then pay that money out as wages, which in turn results in more spending on goods and services. If the multiplier effect is equal to 10, it means this $100,000 additional cash injection ultimately results in $1,000,000 of effective income into the region.
Although the idea of Tobin’s q was originally established to describe a firm’s decisions regarding investment in capital assets, the theory can be expanded to describe investment in real estate. The original equation for Tobin’s q was:
Tobin’s q = market value of reproducible real capital assets/current replacement cost of assets.
In real estate, the cost of reproduction is defined by an appraiser’s cost approach to valuation. So, Tobin’s q can be generalized to apply to real estate assets using the following equation:
Q = market price of existing real estate/cost of land + improvements’ construction cost.
Applying this theory to real estate and urban development, the market has the capacity to absorb additional supply if the construction is creating additional value. Mathematically, this is true any time q>1. When this is true, developers have the ability to earn enough profit to make new construction projects financially feasible. When that new inventory becomes available on the market, however, the market value of similar real estate assets will fall until the demand grows to meet the new supply. When market prices decline due to the new supply, the value of Tobin’s q also decreases. So, Tobin’s q is a useful tool for evaluating current supply and demand conditions for real estate market segments and the impact new development has on the current space market.
In this article, we briefly outlined at a high level the steps taken to complete a real estate market analysis. The first task is to define the market area, which is the geographic area a property is expected to service. Then, we discussed how and where to gather relevant market data for a property. And finally, we discussed supply and demand factors to consider, including the multiplier effect and Tobins q. Real estate market analysis is a complicated subject, and this article gives a high-level overview on how to get started.
Source: Getting Started with Real Estate Market Analysis
https://www.creconsult.net/market-trends/getting-started-with-real-estate-market-analysis/
A real estate market analysis contains a few basic sections, and each provides key information needed for analyzing the valuation and financial feasibility of any real estate investment. The first section defines the area under consideration. Defining the area is more than just finding the lot boundaries but involves defining the size of the target market most likely to generate income. Accurately defining the target market and neighborhood allows the investor to identify competition and the current supply to meet current demand in that area.
The second section contains a thorough analysis of the physical and environmental factors impacting the real estate. Physical factors include things like location, natural resources, topography, soil conditions, climate, water availability, and transportation patterns. At first glance, some of these factors may not seem terribly important to analyzing the profitability of a real estate investment. In some cases, however, the community’s location next to an ocean or pleasant climate could be an integral part of the community’s economy, industry, and desirability. It would be impossible to fully understand the community dynamics without an appreciation of these physical characteristics.
In addition to these physical factors, the market analysis may also include more information about the neighborhood features. Often, this includes detailed information about the neighborhood’s access to public goods and services. The access to and quality of public utilities can be extremely important to commercial real estate development. Real estate developers must consider whether or not a particular parcel of land has sufficient access to utilities as well as whether those utilities are capable of meeting the additional servicing demands of the new development. If not, the developer must convince the local government to invest in upgraded utility services to the area. So, the availability of adequate utility services and construction costs should not be overlooked since they can ultimately determine the feasibility of any real estate project.
After addressing the physical factors of the location, the market analysis evaluates the economic characteristics and trends in the area. The purpose of this economic analysis is to provide an understanding of the underlying population, business conditions, and the future demand for a particular type of real estate. Trends in demographic data provide some insight into the future economic health of a region. For example, a growing population is generally a good sign of economic prosperity in a region as long as there are growing job opportunities for the residents. Population age distribution, education, and income are also important indicators of regional growth patterns.
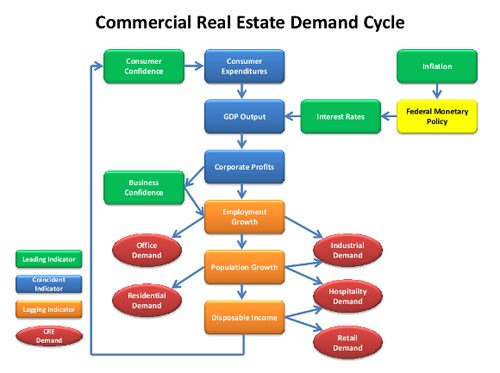
Broader economic trends in the region as well as at the national level should also be addressed in the market analysis. Although all real estate is local, larger, macroeconomic forces have ripples throughout all local markets. As a result, interest rates, current and proposed changes to tax policies, inflation, GDP growth, and unemployment rates need to be analyzed in a market analysis. All of these factors play an important role in the growth or decline of the economic base surrounding the subject property. The CCIM institute has a nice demand cycle flow chart that puts all of this together:
Investigating other new construction in the area should also be part of a market analysis. Searching for building permits can be an excellent indicator of past development as well as new supply that will be on the market in the future. New construction is a signal that a neighborhood is considered desirable, but it can also be a source of competition for tenants or buyers. Other issues related to construction are zoning and development requirements for a new construction. The market analysis should investigate the zoning and building regulations as well as the timeline, costs, and attitude of the local planning board. These three factors alone can determine whether or not a real estate investment is financially feasible or not.
Overall, the market analysis should provide a comprehensive picture of the subject property, location, neighborhood, and the larger market economic drivers. The final document should allow the reader to understand the current supply and demand conditions for this particular type of real estate as well as a picture of how these conditions may change in the future. It should also provide conclusions about the changing demographics and regulations in the neighborhood and how those factors as well as economics could impact the subject property.
Not only is a thorough market analysis necessary to understand the outlook for a real estate investment, but also, it is critical to creating the real estate proforma. Proforma forecasts are simply a best, educated guess about future performance. In order to make an educated estimate, however, the investor needs a lot of background information about the market. All of this information comes from the market analysis.
For example, consider the top line in a real estate proforma. Potential Rental Income is an estimate of the maximum rent an owner could obtain at 100% occupancy. Forecasting potential rental income requires a forecast of expected future rental rates that owner can reasonably attain. An investor could simply assume a fixed annual growth rate based on past experience. A more accurate estimate of future rental rates, however, involves an analysis of current supply as well as future supply that may be entering the market. Future demand estimates involve understanding the desirability of the location relative to neighboring areas, growth patterns and traffic patterns in the area, population growth and demographics, and overall health and stability of the neighborhood’s economic base. All of these items are components of the market analysis.
The next item on a proforma accounts for vacancy. Again, it is possible for an investor to use a fixed vacancy rate every year in the analysis. Unfortunately, it is not always realistic to assume vacancy rates will never change. The expected vacancy rate is a function of future supply and demand conditions that are generated through an analysis of current available space and expected new construction, relative market pricing, and demand generated by the economic base of the area. So, any meaningful forecast of vacancy rates requires a thorough market analysis.
Estimating future operating expenses also requires an understanding of the current market costs and how they will change over time. These changes relate back to the fundamentals of the local economy and industry as well as national macroeconomic trends. The information contained in the market analysis can help determine appropriate growth rates for operating expenses.
The bottom-line net operating income gets put into a variety of valuation and feasibility models. One of the common methods for discounting net operating income to quickly generate a valuation is by using a market capitalization rate. The market capitalization rate is a measure of how buyers discounted net operating income to value nearby comparable properties. Finding the most appropriate comparables is one more component of the market analysis. So, from start to finish, the proforma and valuation models rely on the data contained in the market analysis.
Real estate investors should never purchase a property without conducting a thorough and detailed market analysis. Although the process of researching the location, the local market, and the larger economic influences on the population and property is time-consuming, its importance should never be overlooked. Investors don’t want to put money into an asset that will not earn a target rate of return over their anticipated holding period. Making projections and decisions without the benefit of a detailed market analysis adds unnecessary risk into an investment analysis or feasibility analysis. Not paying proper attention to the market fundamentals that generate cash flows can cause significant error in the proforma financial statements. Unfortunately, these errors could cause investors to select projects that will not end up meeting their target rate of return. Alternatively, investors could also overlook a property that does have the ability to earn a target rate of return due to errors in their cash flow forecasting model.
Source: Why Is Real Estate Market Analysis So Important?
https://www.creconsult.net/market-trends/why-is-real-estate-market-analysis-so-important/
