Showing posts with label Market Trends. Show all posts

Wednesday, September 9, 2026

Chicago Multifamily Financing 2026: More Capital, Disciplined Leverage


The Chicago multifamily financing 2026 environment is improving, but apartment owners should distinguish between more available capital and easier leverage.


Banks, agencies, debt funds, and other lenders are competing more actively for commercial real estate loans. Multifamily originations are rising, credit spreads have tightened, and recent Federal Reserve survey data indicates that some banks are modestly easing multifamily lending standards.


At the same time, lenders remain disciplined on loan-to-value ratios, debt-service coverage, debt yield, and property-level cash flow.


For Chicago-area multifamily owners, that distinction matters.


More lenders willing to finance acquisitions can improve transaction liquidity. More refinancing options can also help owners approaching loan maturities. But buyers still need sufficient net operating income to support the debt.


In many transactions, DSCR or debt yield can limit proceeds before the lender's advertised maximum LTV becomes relevant.


That means today's financing environment affects more than borrowers. It can influence property value, buyer purchasing power, sale execution, and the decision to refinance, hold, or sell.


Multifamily Lending Activity Is Increasing


Commercial real estate lending improved materially during the second quarter of 2026.


CBRE reported that the number of commercial loans increased 11% year over year, while average loan size increased 5%. Multifamily loan spreads tightened by 15 basis points to 162 basis points on fixed-rate permanent loans.


At the same time, average multifamily leverage actually declined. Multifamily LTV averaged 63.3%, compared with 65.8% one year earlier.


That combination is significant.


Lenders appear increasingly willing to compete for good multifamily loans—but primarily through pricing rather than additional leverage.


The Mortgage Bankers Association reported a similar improvement in lending activity. Multifamily mortgage originations increased 8% year over year and 15% from the first quarter of 2026.


Depository institutions were particularly active, with commercial and multifamily loan originations by banks increasing 61% from one year earlier.


For apartment owners, the takeaway is relatively straightforward:


Capital availability is improving, but underwriting discipline has not disappeared.


Current Multifamily Mortgage Rates


As of September 8, 2026, CommLoan reported the following average multifamily mortgage rates from participating lenders:


Loan Type5-Year7-Year10-Year
Bank6.25%6.77%6.90%
Agency5.92%5.91%5.93%
Agency SBL6.21%6.27%6.24%
CMBS7.03%6.98%6.68%


These figures are market averages for comparison rather than loan commitments. Actual pricing depends on the property, borrower, leverage, loan amount, amortization, term, prepayment structure, and other underwriting considerations.


The important point is that debt remains considerably more expensive than it was during the exceptionally low-rate period preceding the recent tightening cycle.


Improved lender competition therefore does not automatically mean dramatically higher loan proceeds.


A lender may reduce its spread and offer more competitive terms, but the property still needs enough cash flow to support the requested debt.


Banks Are Returning to the Multifamily Market


One of the more constructive developments in 2026 has been increased participation from banks.


CBRE reported that banks represented approximately 30% of non-agency loan closings in Q2 2026, compared with 24% one year earlier.


Alternative lenders represented 38% of non-agency volume, life companies 21%, and CMBS lenders 11%.


Federal Reserve data provides additional evidence of improving credit availability.


In its July 2026 Senior Loan Officer Opinion Survey, the Federal Reserve reported that a modest net share of domestic banks had eased standards for multifamily loans during the second quarter.


However, there is an important qualification.


The Federal Reserve also found that multifamily lending standards remain toward the tighter end of their historical range.


That combination describes the current market well:


Credit is becoming more available, but lenders remain selective.


For borrowers, more competition creates additional financing options.


For sellers, it matters as well.


A larger lender pool can help qualified buyers obtain financing, reduce execution risk, and improve the probability that an otherwise sound transaction reaches closing.


More Capital Does Not Mean Maximum Leverage


The most important feature of the current Chicago multifamily financing 2026 market may be what lenders are not doing.


They are not broadly returning to the aggressive leverage assumptions of the previous low-rate cycle.


CBRE reported that average multifamily LTV declined to 63.3% from 65.8% even as lending activity increased.


Across CBRE's commercial lending activity:


  • Average DSCR increased from 1.34x to 1.43x


  • Average debt yield increased from 9.7% to 10.2%


  • Average commercial LTV declined from 60.8% to 59.6%


Those are signs of disciplined underwriting rather than aggressive credit expansion.


For an apartment owner considering a sale, this is important because a lender's stated maximum LTV is only one limitation on a buyer's financing.


Actual loan proceeds can also be constrained by:


  • Debt-service coverage ratio


  • Debt yield


  • Interest rate


  • Amortization period


  • In-place NOI


  • Vacancy assumptions


  • Management expense


  • Replacement reserves


  • Property taxes


  • Insurance


  • Capital expenditures


A lender may advertise financing of up to 70% or 75% LTV.


That does not mean every property will actually support that amount of debt.


How DSCR Can Limit a Buyer's Loan


Consider a simplified acquisition example.


Assume:


  • Purchase price: $3,600,000


  • Net operating income: $240,000


  • Interest rate: 6.25%


  • Amortization: 30 years


  • Required DSCR: 1.25x


  • Maximum LTV: 75%


At 75% LTV, the buyer would request a:


$2,700,000 loan


But a 1.25x DSCR means annual debt service cannot exceed:


$240,000 ÷ 1.25 = $192,000


At a 6.25% interest rate with 30-year amortization, approximately $192,000 of annual debt service supports a loan of roughly:


$2.60 million


That equals approximately 72% LTV, rather than 75%.


The buyer therefore needs roughly another $100,000 of equity compared with the headline 75% LTV scenario.


It is a simplified example, but it demonstrates an important concept for sellers:


The income produced by the property directly affects how much debt a buyer can obtain.


And the amount of debt available affects the buyer's equity requirement and investment return.


Why a Lender's NOI May Differ From the Owner's NOI


A lender may also calculate NOI differently from the owner.


Multifamily lenders commonly normalize operating expenses.


Depending on the property and underwriting standards, adjustments may include:


  • Market-based management expense


  • Replacement reserves


  • Stabilized vacancy


  • Property taxes


  • Insurance


  • Recurring repairs and maintenance


  • Utilities


  • Other operating expenses required to maintain the property


This is particularly relevant for owner-managed apartment buildings.


An owner may legitimately manage the property personally and therefore show little or no management expense on the operating statement.


A lender underwriting the purchaser may still include an economic management expense.


That reduces lender-underwritten NOI.


Lower underwritten NOI reduces debt-service capacity.


Lower debt-service capacity can reduce maximum loan proceeds.


This is one reason clean and defensible financial reporting matters when preparing a multifamily property for sale.


Financing Conditions Can Affect Sale Pricing


Owners sometimes think of financing as exclusively a buyer issue.


It is not.


A buyer may determine value using comparable sales, capitalization rates, and anticipated investment returns, but the buyer still needs a workable capital structure.


When financing proceeds are constrained, the buyer generally has several alternatives:


  1. Contribute more equity


  2. Accept a lower leveraged return


  3. Find a different lender or loan structure


  4. Reduce the purchase price


  5. Walk away from the transaction


That is why improving lender competition is constructive for Chicago multifamily investment sales.


More available capital increases the likelihood that a qualified buyer can find financing that works.


But sellers should not assume that tighter lending spreads alone will restore the pricing environment that existed when debt was substantially cheaper.


Property-level cash flow remains critical.


Strong NOI Has Value Beyond the Cap Rate


Improving sustainable NOI can affect value in more than one way.


Owners commonly think of NOI primarily in terms of capitalization rates.


For example, an additional $25,000 of NOI capitalized at a 6.5% rate theoretically represents approximately $385,000 of value.


But a stronger NOI may also improve:


That makes sustainable operating performance especially important in today's financing environment.


Chicago apartment fundamentals remain comparatively favorable. The recent Chicago Multifamily Market Q3 2026 report showed tight vacancy, above-average rent growth, constrained construction, and improving investment sales liquidity.


Those market fundamentals help.


But lenders ultimately finance the individual property, not simply the Chicago market.


A well-operated property with defensible income may therefore finance more favorably than another property in the same submarket.


What Refinancing Owners Should Evaluate


Owners approaching a loan maturity should look beyond the quoted interest rate.


A proper refinancing analysis should consider:


  • Current loan balance


  • Proposed interest rate


  • Amortization period


  • Loan term


  • Required DSCR


  • Maximum LTV


  • Debt yield


  • Current NOI


  • Lender-normalized NOI


  • Cash-out availability


  • Prepayment provisions


  • Recourse


  • Fixed versus floating rate


  • Required reserves


  • Upcoming capital expenditures


A lower credit spread is beneficial.


But an owner refinancing debt originated during the previous low-rate environment may still face a significant increase in annual debt service.


That can materially change the economics of holding the property.


For some owners, refinancing will clearly remain the preferred strategy.


For others, additional equity requirements, reduced cash flow after debt service, capital needs, or current sale pricing may justify comparing a disposition.


The important point is that a refinance-versus-sell decision should be based on today's numbers, not financing assumptions from several years ago.


Fixed-Rate Versus Floating-Rate Debt


The relationship between short-term and intermediate-term interest rates has also affected borrower decisions.


CBRE reported increased borrower interest in floating-rate structures as the spread between SOFR and five-year fixed-rate benchmarks widened.


Floating-rate debt can offer:


  • Greater prepayment flexibility


  • Potentially lower initial borrowing cost


  • Flexibility for shorter-duration strategies


It also introduces:


  • Interest-rate volatility


  • Rate-cap costs


  • Greater uncertainty in future debt service


CBRE noted that increased rate-cap costs could limit the attractiveness of floating-rate financing despite the initial pricing advantage.


For a stabilized apartment owner planning a longer hold, fixed-rate debt may still provide valuable predictability.


For shorter-duration or transitional strategies, floating-rate financing may warrant consideration.


The appropriate structure depends on the property and business plan rather than simply choosing whichever quoted rate is lowest.


What This Means for Chicago Multifamily Owners


The current lending environment is meaningfully healthier than the most restrictive period of the recent credit cycle.


But the improvement is nuanced.


More lender competition is constructive.


More lenders competing for quality multifamily loans can improve refinancing options and increase transaction liquidity.


NOI remains critical.


Strong, sustainable property-level income can support greater loan proceeds and improve buyer economics.


Headline LTV can be misleading.


A lender may advertise 70% or 75% LTV, but DSCR or debt yield may ultimately determine the available loan amount.


Financial reporting matters


Accurate rent rolls, operating statements, and supporting documentation make it easier for buyers and lenders to confidently underwrite the property.


Sale and refinancing alternatives should be compared


Owners approaching a maturity or major capital decision should evaluate the economics of refinancing, holding, and selling side by side.


What to Watch Through the End of 2026


Several factors will determine whether multifamily financing conditions continue to improve:


  • Treasury yields


  • SOFR


  • Federal Reserve policy


  • Bank lending standards


  • Agency pricing


  • Credit spreads


  • Apartment operating performance


  • Property taxes


  • Insurance costs


  • Loan maturities


  • Transaction volume


  • Investor demand


The constructive development is that capital is becoming more available.


The limiting factor remains underwriting.


That is ultimately a healthier financing market than one driven primarily by maximum leverage.


Chicago Multifamily Financing Outlook


The Chicago multifamily financing 2026 outlook is improving heading into the final months of the year.


Banks are participating more actively.


Multifamily originations are increasing.


Credit spreads have tightened.


Federal Reserve survey data shows modest easing in multifamily lending standards.


At the same time, leverage remains disciplined, and current borrowing costs continue to make property-level cash flow central to both acquisition and refinancing decisions.


For Chicago-area apartment owners, financing therefore belongs in the property-value discussion rather than being treated as a separate buyer issue.


A current Broker Opinion of Value should consider not only comparable sales and capitalization rates but also property-level NOI, buyer underwriting, and the financing assumptions available to the likely buyer pool.


If you are evaluating a sale, refinance, partnership change, or hold strategy, understanding how today's lenders are likely to underwrite the property can provide important context before making that decision.


https://creconsult.net/chicago-multifamily-financing-2026/?fsp_sid=2937

Monday, May 4, 2026

2026 Multifamily Investment Outlook | CoStar Webinars


Understanding the precise Multifamily Investment Outlook is essential for thriving in today’s dynamic commercial real estate market. As a multifamily owner, navigating this landscape requires more than just gut instinct—it demands hard, actionable data. Whether you are holding strong in the Chicago market or managing a national portfolio, knowing where demand is heading, how cap rates are shifting, and what capital markets are doing is crucial to maximizing your asset's long-term value.


That is why I am thrilled to share an incredible resource with you. As a multi-family investment sales broker with eXp Commercial, I pride myself on partnering with the best data providers in the industry to give my clients an edge. CoStar, our premier national data partner, is hosting two highly anticipated "State of the Market" webinars this May. These events are specifically designed to give you the exact Multifamily Investment Outlook you need to make profitable, data-backed decisions for the remainder of the year.


Elevating Your 2026 Multifamily Investment Outlook


If you want to understand the macro trends impacting your micro-level property performance, mark your calendar for these two free, expert-led sessions. Attending these will directly enhance your personal Multifamily Investment Outlook.


1. US National Multifamily Outlook


Understanding demand patterns, construction pipelines, and regional rent growth is essential for underwriting and operational strategy.


  • Date & Time: Wednesday, May 13 at 1:00 PM EST


  • Presenter: Grant Montgomery, National Director of Multifamily Analytics at CoStar


  • What You Will Learn:
    • Demand and Absorption Trends: Discover the leading markets and shifting demand patterns.


    • New Supply Delivery: Get the latest updates on the construction pipeline and delivery shifts.


    • Vacancy Trends: Understand regional disparities and quality-class differences.


    • Rent Growth: Gain a clear outlook on market trends and pricing power.


    • Capital Markets: Review current multifamily investment conditions.


Register for the Multifamily Outlook Here


2. US National Capital Markets Outlook


Interest rates and market volatility are the top concerns for investors right now. This session will break down the economic backdrop dictating commercial real estate liquidity and asset values so you can adjust your Multifamily Investment Outlook accordingly.


  • Date & Time: Thursday, May 14 at 1:00 PM EST


  • Presenter: Chad Littell, National Director of US Capital Markets Analytics at CoStar


  • What You Will Learn:
    • Economic Backdrop: Monitoring market volatility and what it means for your portfolio.


    • Key Metrics to Watch: A deep dive into interest rates and financing environments.


    • Sales Volume: Analyzing our second year of double-digit growth.


    • Cap Rates: Why we are seeing "more of the same" in the near term.


    • Asset Values: Exploring price stability versus market inflections.


Register for the Capital Markets Outlook Here


Applying These Insights to the Chicago Market


National data is incredibly valuable, but it is the local application that truly generates wealth. As an expert in the Chicago market, I help owners translate these broad national trends into actionable local strategies. If CoStar’s data shows a stabilization in cap rates or shifts in regional vacancy, you need to know exactly how that impacts your specific building's equity and cash flow.


Whether you attend the webinars or not, taking a proactive approach to your portfolio is non-negotiable in this economic climate. I specialize in helping owners navigate complex market conditions by utilizing a highly localized Multifamily Investment Outlook.


Reach out to me today if you need assistance with:


  • Operations & Yield Optimization: Are your rents keeping pace with the market trends highlighted by CoStar?


  • Valuation & BOVs (Broker Opinion of Value): Discover exactly what your property is worth in today's capital markets.


  • Strategic Disposition: Timing the market for a profitable exit.


  • 1031 Exchange Reinvestment: Successfully moving your equity from a management-intensive property into a high-yield, passive investment.


Contact Us Today to Discuss Your Portfolio
Don't leave your investment strategy to chance. Leverage the power of eXp Commercial, the premier data from CoStar, and local market expertise to maximize your multifamily returns this year.


https://creconsult.net/multifamily-investment-outlook-costar/?fsp_sid=2480

Tuesday, February 17, 2026

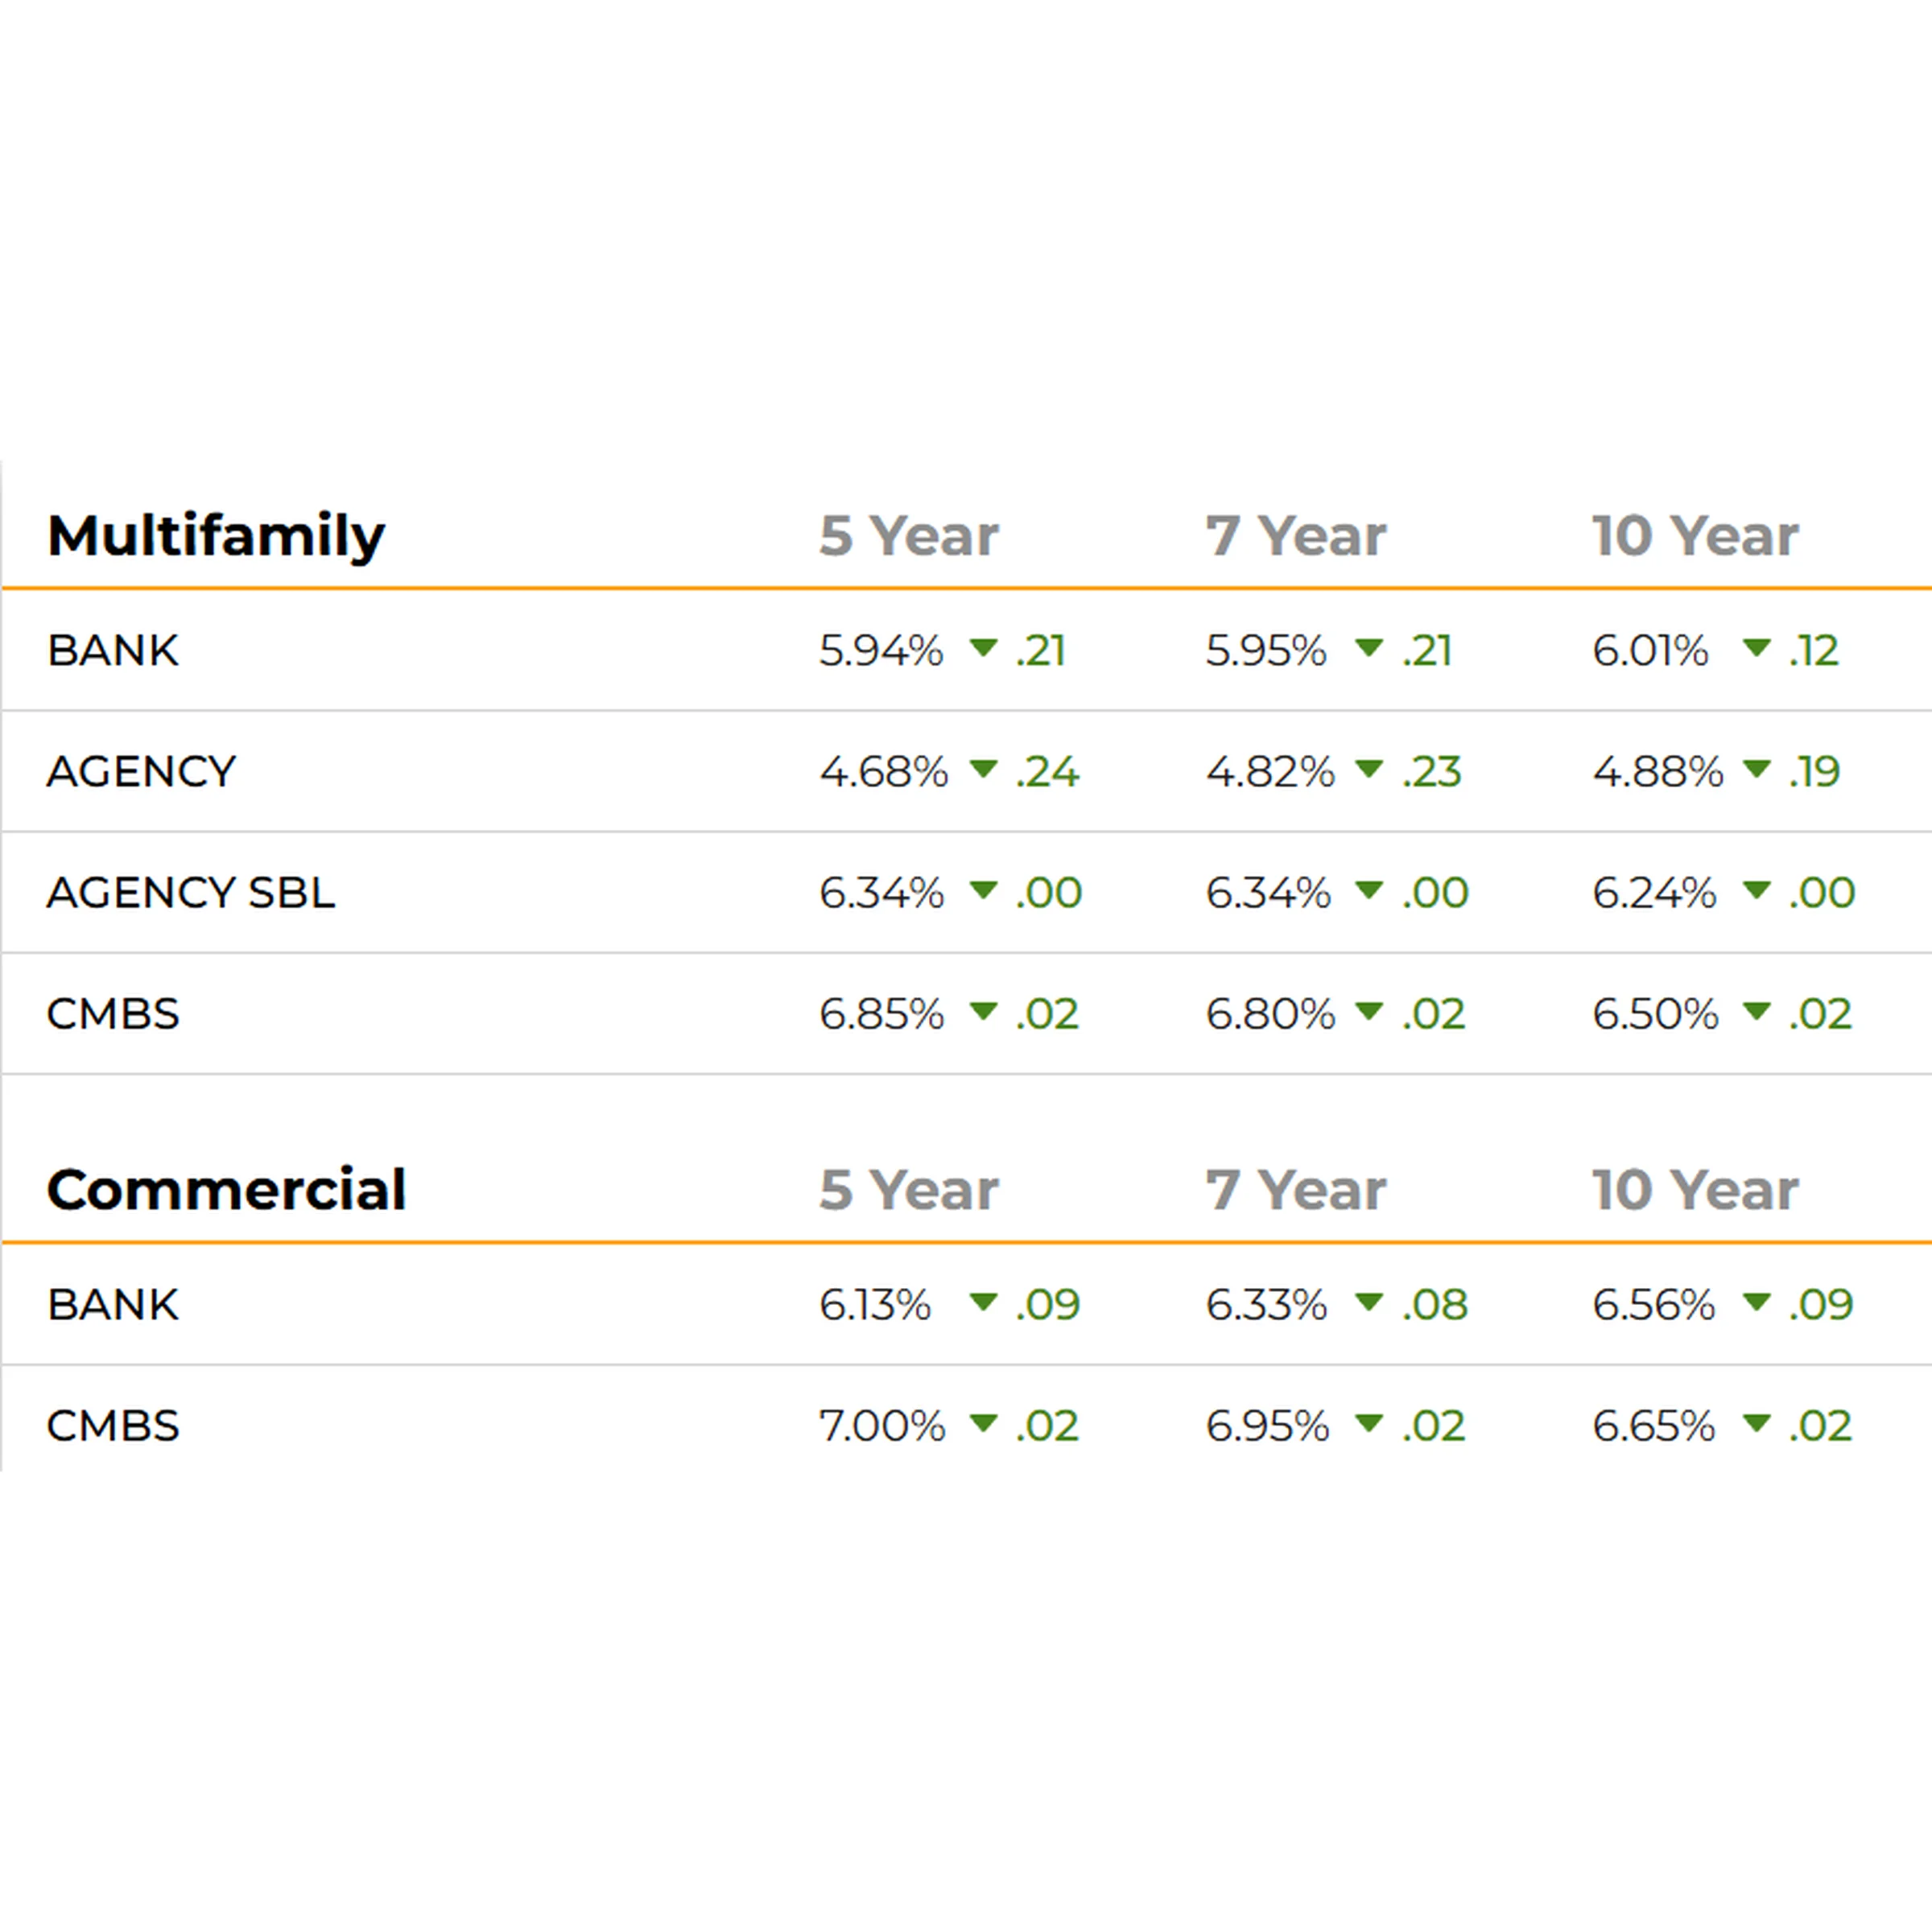
Chicago Multifamily Mortgage Rates – February 2026 Market Update


Stabilizing Debt Costs Create Tactical Opportunities for Apartment Owners


Updated: February 2026


Chicago multifamily mortgage rates are stabilizing with incremental compression across Agency and Bank executions. Capital markets are gradually improving, providing apartment owners and investors with renewed clarity heading into 2026.


This update outlines current multifamily mortgage rates in Chicago and what they mean for refinancing, acquisitions, and valuation strategy.


Multifamily Mortgage Rates – February 2026


Loan Type5-Year7-Year10-Year
Bank5.94% ▼ 0.215.95% ▼ 0.216.01% ▼ 0.12
Agency4.68% ▼ 0.244.82% ▼ 0.234.88% ▼ 0.19
Agency SBL6.34% —6.34% —6.24% —
CMBS6.85% ▼ 0.026.80% ▼ 0.026.50% ▼ 0.02


📌 Source: CREConsult Capital Markets | February 2026
📌 Benchmark references: CommLoan Multifamily & Commercial Mortgage Indices


Why Chicago Multifamily Mortgage Rates Matter in 2026


Debt costs directly impact:


  • Property valuation


  • Cap rate spreads


  • Cash flow


  • Refinance feasibility


  • Acquisition underwriting


With Chicago multifamily mortgage rates showing measured compression, owners now have a clearer window to structure long-term fixed-rate debt before potential Treasury volatility later in 2026.


Current Lending Trends Impacting Chicago Multifamily Owners


1. Agency Loans Lead on Pricing


Agency multifamily mortgage rates in Chicago remain the most competitive:


  • 5-Year: 4.68%


  • 7-Year: 4.82%


  • 10-Year: 4.88%


The spread advantage versus CMBS (over 200 basis points on 5-year terms) reinforces Agency dominance for:


  • Stabilized Class A and B multifamily


  • Institutional-quality assets


  • Suburban core markets


  • Non-recourse executions


Fannie Mae and Freddie Mac programs continue to attract capital due to stability and flexible amortization structures.


2. Bank Multifamily Rates Tighten Modestly


Chicago bank multifamily mortgage rates are now:


  • 5-Year: 5.94%


  • 7-Year: 5.95%


  • 10-Year: 6.01%


While pricing has improved by approximately 20 basis points, underwriting remains disciplined:


  • DSCR above 1.25x


  • Leverage typically 60–65% LTV


  • Strong sponsor liquidity required


Banks are competitive on stabilized mid-market properties but cautious on transitional assets.


3. Agency SBL Supports Smaller Assets


Agency Small Balance Loan (SBL) pricing remains stable:


  • 5- and 7-Year: 6.34%


  • 10-Year: 6.24%


This channel continues to support:


  • 5–50 unit apartment buildings


  • Workforce housing


  • Suburban Chicago markets such as Aurora, Naperville, and Glen Ellyn


SBL remains attractive due to non-recourse options and simplified execution.


4. CMBS Rates Hold Steady


Chicago CMBS multifamily mortgage rates:


  • 5-Year: 6.85%


  • 7-Year: 6.80%


  • 10-Year: 6.50%


Slight tightening suggests improving bond market stability, though pricing remains elevated relative to Agency.


Best suited for:


  • Large portfolios


  • Cross-collateralized structures


  • Higher leverage scenarios


  • Long-term hold strategies


Chicago Multifamily Market Fundamentals Remain Resilient


Debt markets are stabilizing while fundamentals remain strong:


  • Sub-4% vacancy in core submarkets


  • Steady renter demand


  • Moderate but sustainable rent growth


  • Controlled new supply relative to national averages


Chicago multifamily mortgage rates are no longer volatile — they are predictable. Predictability restores transaction confidence.


Strategic Outlook for Chicago Apartment Owners


Owners should evaluate:


  • Refinancing maturing 2026–2027 debt


  • Locking fixed-rate loans before Treasury shifts


  • Recapitalization opportunities


  • Strategic dispositions into improved liquidity


Debt structure is now a competitive advantage.


Work With a Chicago Multifamily Specialist


With over 26 years in multifamily brokerage, I help apartment owners align valuation, capital markets, and exit timing to maximize returns.


If you are considering:


  • Refinancing


  • Selling


  • Recapitalizing


  • Evaluating portfolio value


A structured review of your asset and current Chicago multifamily mortgage rates can clarify the optimal strategy.


https://creconsult.net/chicago-multifamily-mortgage-rates-february-2026/?fsp_sid=2252

Friday, February 13, 2026

Chicago Multifamily Outlook: Rents, Caps, 1031 Plans


The Chicago multifamily market enters 2026 defined by a tightening supply-demand gap, as new deliveries fall to historic lows. While national rent growth has cooled, Chicago apartment rents remain resilient in core submarkets, supporting stable apartment asset values despite broader economic volatility. This analysis examines the current cap rate outlook for Chicago, which remains elevated above the national average, and provides a framework for a 1031 exchange strategy tailored to a higher-for-longer interest rate environment.


Executive snapshot: Where national trends meet Chicago


National rent growth cooled, with pockets of strength


After mid-2025, U.S. rent growth slowed, but select Sun Belt hubs rebounded. National rent growth in Q4 2025 was +2.1% year over year, while top Sun Belt markets posted +4.0% to +6.0% in 2025. This gap matters because national rent growth outperformed Chicago in 2025, shaping broader Multifamily investment trends 2026 toward cautious, income-focused deals.


Chicago multifamily market: softer leasing and rent drift


In the Chicago multifamily market, leasing velocity was softer and several submarkets saw modest negative rent drift. Chicago apartment rents were -1.2% year over year in Q4 2025, alongside a 6.2% vacancy rate. Local vacancy and concessions are the primary drivers of rent softness, especially where new deliveries compete for the same renter pool.


Seasonality can amplify short-term swings: student leasing cycles, corporate relocations, and the timing of new deliveries can temporarily lift or pressure occupancy and effective rents.


John Reynolds, Senior Director at Lakeshore Advisors: "Chicago’s rent path is uneven—owners with stabilized, well-located assets still see healthy demand."


Maria Lopez, Multifamily Strategist, Windy City Capital: "Underwriting discipline matters more than ever; the numbers are nuanced by submarket and product class."


Immediate investor takeaway


  • Reprice underwriting assumptions for operating income to reflect concessions and slower absorption.


  • Stress-test exit cap rates and valuation sensitivity, given uneven rent momentum.


  • Align with Multifamily investment trends 2026: cautious allocation toward stabilized assets with durable demand drivers.


Data snapshot: National vs. Chicago metrics (table)


This single table gives CFOs, asset managers, and advisors a quick scan of market exposure. It highlights how negative rent movement in Chicago can pressure near-term NOI and, by extension, Apartment asset values. It also frames the Cap rate outlook Chicago, where Chicago’s 2025 cap rate runs about 0.7% higher than the national average, and notes softer deal flow tied to reduced 1031 activity.


Metric (Q4 2025 / 2025)


National


Chicago Metro


YoY / YTD Note


Rent growth (YoY, Q4 2025)


+2.1%


-1.2%


Chicago rent decline can depress NOI near term


Average multifamily cap rate (2025)


4.9%


5.6%


~0.7% cap rate premium vs. national


Estimated apartment asset values (2025 YTD)


—


-4.5%


Value pressure aligns with weaker rent trend


1031 exchange transaction volume (2025 YoY)


-10%


-10%


Reduced activity suggests more hold decisions


Common 1031 timelines


45-day identification; 180-day exchange completion (1031 exchange strategy timing risk)


Ethan Patel, Portfolio Manager, Midwest Capital Partners: “Tables don't replace fieldwork, but they highlight where to dig deeper—Chicago's cap rate premium is real.”


Olivia Grant, Tax Counsel, Grant & Meyers LLP: “1031 exchange rules are rigid; timing and documentation are the hidden risks for every owner.”


What softer Chicago apartment rents mean for landlords


Revenue pressure and Apartment asset values


Softer Chicago apartment rents create immediate revenue pressure: negative rent drift and longer marketing windows can reduce year-one NOI for value-add plans. In 2025, typical days on market rose +12 days YoY, increasing vacancy loss and carrying costs. Because concessions and vacancy trends materially affect effective rent, even modest giveaways can ripple into underwriting and Apartment asset values across the Chicago multifamily market.


Chicago sample (2025)


Observed impact


Average concession impact on effective rents


1.5% to 3.0%


Marketing time


+12 days YoY


Renewal lift strategies


~8% lower turnover (hedged portfolios)


Leasing tactics: protect occupancy, watch effective rent


Owners are using concessions and flexible lease terms to stabilize occupancy, but these tools compress effective rents if not tightly managed. Location and product quality remain the primary near-term drivers, so pricing power is strongest where demand is deepest.


Samantha Cole, COO, Harborpoint Property Management: "Small operational fixes—faster turnovers, smarter renewals—can offset a surprising amount of rent pressure."


Operational levers and submarket variance


  • Turnover work orders: shorten downtime with faster make-readies and vendor scheduling.


  • Utility controls: reduce waste and align RUBS/submetering where feasible.


  • Targeted amenity spend: prioritize high-ROI items (package rooms, access control) over broad upgrades.


  • Micromarketing: neighborhood-specific ads and employer outreach for lease-up.


Downtown, the lakefront, and select neighborhood nodes are holding up better than peripheral suburbs. One North Side landlord cut concessions from two weeks to one by focusing on renewals and service response times, protecting cash flow while keeping occupancy steady.


Cap rate outlook Chicago and asset-value implications


Cap rate outlook Chicago and asset-value implications


The Cap rate outlook Chicago remains the key swing factor for pricing in 2026. Cap rates have re-priced higher for smaller, older, or higher-variance assets, while institutional core properties in top submarkets have been more insulated. Research suggests cap-rate widening is the principal near-term valuation risk for Chicago multifamily assets, and well-underwritten, stabilized properties should see less erosion in value than transitional or niche product.


Chicago’s average multifamily cap rate in 2025 is about 5.6% versus a 4.9% national average. That wider spread can influence portfolio rebalancing: some allocators may demand higher yields to stay in Chicago, while others may view the spread as compensation for market-specific risk and a reason to selectively add exposure.


Apartment asset values: why small cap moves matter


Rising cap rates reduce Apartment asset values even when operations are stable. As an illustrative aside, a stabilized property with $600,000 NOI values at $600,000 / 0.050 = $12,000,000 at a 5.0% cap, but at 5.5% it values at $600,000 / 0.055 = $10,909,091 (about -9.1%). Every 25 bps move can change valuation materially.


Multifamily investment trends 2026: underwriting sets the pace


  • Debt pricing and tighter lender DSCR tests can slow value discovery and cap aggressive bids.


  • Stabilized cash flow supports tighter caps than transitional business plans.


Daniel Keane, Head of Transactions, Prairie Real Estate Group: “Cap-rate moves are the simplest technical factor that convert income misses into capital losses—prepare for modest spread normalization in 2026.”


Strategic moves: Acquisitions, dispositions, and 1031 exchange strategy


In the Chicago multifamily market, opportunistic sellers may face thinner buyer pools as 1031 activity cools (estimated -10% YoY in 2025). That makes a disciplined 1031 exchange strategy more important, especially when buyer demand tightens and pricing becomes less forgiving. With Chicago cap rates running about ~70 basis points above national levels (2025), owners should underwrite exits conservatively and avoid assuming quick cap-rate compression.


Acquisitions: focus on durable cash flow


For Multifamily investment trends 2026, buyers are prioritizing cash flow resilience: stable submarkets, transit and job access, and tenant-demographic tailwinds. When exchange volumes decline, relationship-based sourcing matters more because the best deals trade quietly and timelines are shorter.


Dispositions and exchange logistics


Owners weighing a sale should model two paths: taxable sale versus exchange. If cap-rate compression looks unlikely, tax deferral may be the stronger outcome—but only with strict timing discipline and clean execution.


  • 45-day identification rule: identify replacement properties within 45 days of closing the sale.


  • 180-day completion rule: close the replacement purchase within 180 days.


  • Qualified intermediary required: sale proceeds cannot be received directly by the investor.


Creative structures can help. A reverse 1031 may fit when buying first is necessary, but it raises capital and diligence demands in a slower market.


Olivia Grant, Tax Counsel, Grant & Meyers LLP: "In a slower 1031 market, liquidity planning and early pairing become competitive advantages."


Mark Fisher, Principal, Riverbend Investments: "Some owners find a reverse 1031 attractive when buying first makes sense—just plan for upfront capital needs."


Forward-looking risks, scenarios, and tactical checklist


In the Chicago multifamily market, forward risk centers on rate volatility (Fed guidance and regional lending spreads), uneven job growth by submarket, a new supply pipeline of roughly 6,000 to 8,000 metro deliveries in 2025–2026 (illustrative), and shifting commuter patterns as remote work settles into a new normal. These variables shape Multifamily investment trends 2026 and the Cap rate outlook Chicago, making flexibility a core advantage.


John Reynolds, Senior Director at Lakeshore Advisors: "Owners who maintain flexible capital plans will be best positioned across scenarios."


Three scenarios and responses


Base (stability): modest leasing, flat-to-slight rent movement. Tactics: protect NOI with renewal focus, targeted concessions, and expense controls while keeping dry powder for small value-add work.


Downside (prolonged softness): slower absorption as supply competes and financing stays tight. Tactics: stress-test DSCR and refi timing, extend debt where possible, and prioritize resident retention over aggressive rent pushes.


Upside (renewed demand): stronger job formation and improved credit availability. Tactics: move quickly on acquisitions, lock financing early, and pre-identify 1031 targets—pre-planning and committed capital can be a competitive differentiator.


Sensitivity and wild-card readiness


Scenario planning shows how small rent moves can materially affect value: a hypothetical +3% rent rebound in 12 months could recapture roughly 2–4% of lost asset value for stabilized assets. As a wild card, a sudden local job boom—such as a major corporate HQ move—could reverse rents fast; owners should keep a quick-response playbook, including lender outreach, broker shortlists, and pre-approved 1031 exchange pathways.


TL;DR: National rent momentum cooled in late 2025; Chicago lagged the national recovery. Expect modest pressure on apartment asset values, a higher-but-stable cap rate band, and selective 1031 exchange opportunities for well-positioned owners.


https://creconsult.net/chicago-multifamily-outlook-rents-caps-1031-plans/?fsp_sid=2208

Chicago Multifamily Offer Terms: 8 Deal Points That Protect Sellers

The strongest multifamily offer is not necessarily the one with the highest headline price. Earnest money, diligence, financing, buyer credi...