Saturday, December 2, 2023

Diving Into CRE Debt Stats

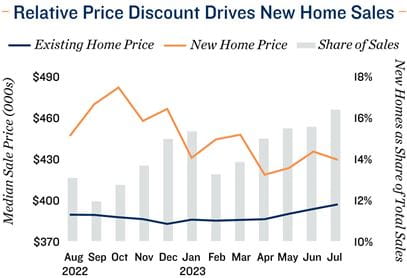
Amid rising interest rates, some troubles at regional banks and investment sales volume that has shrunk to a fraction of its size from cyclical peaks, a lot of the debate around commercial real estate for the past half a year has revolved around how much people should worry about potential defaults. The Mortgage Bankers Association, an industry trade group, reported that in the first quarter of 2023, banks and thrifts experienced a 13-basis-point quarter-over-quarter increase in the 90-plus days delinquency rate on their commercial/multifamily loans, while life insurers and CMBS lenders experienced 10-basis-point increases each.

Real estate data firm MSCI Real Assets reported that at midyear, the volume of distress in the U.S. commercial real estate market rose to $71.8 billion, outpacing workouts by more than $8 billion. MSCI defines distress as encompassing bankruptcies, defaults, court administration, tenant distress or liquidation and loan transfers to special servicers. Much of that distress is concentrated on two property sectors with more than $24.0 billion of that outstanding distress tied to office buildings, and $22.6 billion in the retail sector. As of the second quarter, multifamily properties accounted for $6.8 billion in distressed situations. So, while the amount of distress in the commercial real estate market is growing, the question is how broad-based the challenges will be for borrowers and lenders.

To get a perspective on what’s happening in the lending market, WMRE talked with Willy Walker, chairman and CEO of Walker & Dunlop, a commercial real estate finance and advisory firm with a loan servicing portfolio that last year totaled $123 billion.

This Q&A has been edited for length, style and clarity.

WMRE: We keep seeing headlines about how the commercial real estate industry is “headed for a crisis.” How do you assess the commercial real estate industry’s health right now, what’s your outlook on it?

Willy Walker: I think it’s very important to define commercial real estate. Inside of commercial real estate there are various asset classes that all have very distinct performances at this time in the economy, at this time in the cycle. With that said, many people say “commercial real estate debt crisis” and they throw everything into [their definition of] commercial real estate and that’s not the case. If you look at the amount of debt outstanding in the commercial real estate today, it’s $4.5 trillion, but it’s very important to note that half of the debt outstanding in the commercial real estate world, $2.0 trillion, is to multifamily properties. There’s no crisis in multifamily whatsoever today. Period. So, when headlines say there’s a crisis in commercial real estate debt, half of that debt is in multifamily. What most people are talking about when they are talking about the crisis is they are talking about office. The office market is not doing so great. [But] when people say “commercial real estate crisis,” they are not looking at the performance of multifamily, retail, industrial, hospitality and they are going straight to office. So, specifically to your question, there is no crisis in commercial real estate.

WMRE: How much of a problem are office loans right now?

Willy Walker: Office is 17% of the total debt outstanding in commercial real estate today. And the Mortgage Bankers Association estimates that there are $98 billion of bank office loans that need to be refinanced in 2023. That’s a very significant amount of loans. But what you are finding right now is that lenders are working with borrowers to rework those loans and make it so the borrower is not defaulting and the lender is not taking control of the property. So the Office of the Comptroller of the Currency, the Federal Reserve and FDIC in June guided the banks that they could set up reserves against those loans and be able to engage with borrowers to rework the terms and conditions of those loans. So, what you saw in Q2 earning of CitiGroup, and JP Morgan and Wells Fargo were significant reserves [about $1 billion each for CitiGroup and JP Morgan] that allow them to go and work with the borrowers on those loans and make it so they don’t have to foreclose on those loans. The banks have plenty of liquidity today to be able to work with borrowers to rework these loans. Will there be defaults? Yes. Will there be loans foreclosed on? Yes. But there has not been this huge crisis [people] are talking of. Are there problems in the office sector? Yes. There is no investor, no lender today that says “I need to make a loan on an office.” [But they will work with borrowers on existing loans]. So, the big difference between 2023 and 2009 is that in the Great Financial Crisis, banks didn’t have liquidity, banks had to foreclose on properties and they had to move fast to get any money they could. Today, they don’t need to nor want to do that.

WMRE: If the Federal Reserve continues to raise interest rates, how do you expect it to impact the availability of debt in the commercial real estate sector?

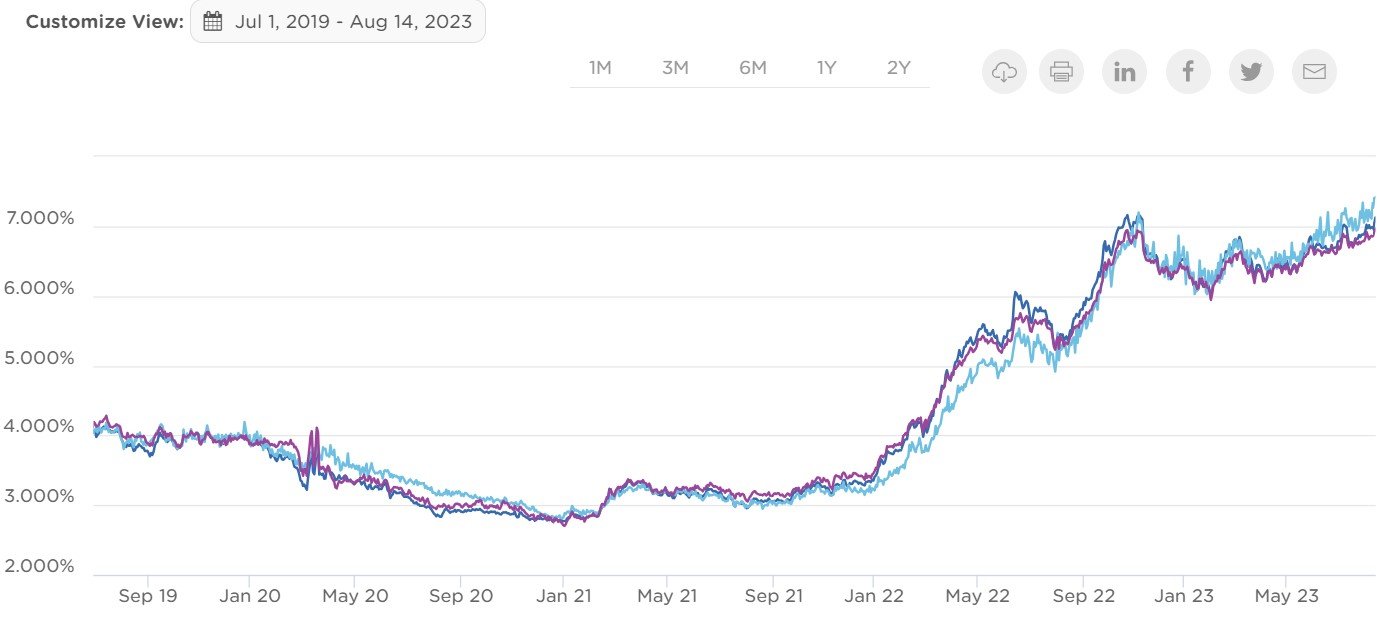
Willy Walker: So, my understanding of what the Fed said is that they are not planning on continuing to raise rates, but they will look in September at whether they need to raise rates. What I did hear is that they are having difficulty getting to their 2% inflation target and that they have work to get through it. There are two very important things to keep in mind—the Fed Funds rate, which is a short-term interest rate and directly ties into SOFR, has gone up now by 525 basis points in the last 16 months. The 10-year Treasury over the last year has gone up about 100 basis points. The real estate capital markets are based off, in today’s market, the 10-year Treasury and not SOFR. There’s clearly a significant amount of debt that is outstanding in commercial real estate that is SOFR-based. So, if you were going to have borrowed on a floating-rate loan two years ago, your interest rate on that loan will have gone up by 400 to 500 basis points. If you are a fixed-rate borrower, you loan is based on the 10-year Treasury, and when you go to refinance, most people today are borrowing at a fixed rate. So, what’s important to understand is that there is plenty of real estate debt outstanding where the cost has gone up to the borrower, but if you are a fixed-rate borrower and you are refinancing, it’s not that dramatic a change. Also, if the short-term rates keep going up, the chance of a recession gets greater and greater, and so that is why the long yield of the curve has continued to be shorter and shorter and actually going down. One of the big issues here is how much more will [the Fed] raise on the short end of the curve and how it relates to the long end of the curve. The bottom line is if they keep raising rates, the chance of recession continues to go up, which will have the inverse effect on the long end of the curve [and bring financing costs down] because most people today are borrowing at fixed-rate and not floating- rate.

WMRE: Has Walker & Dunlop changed its lending strategy in any significant way in response to rising rates and concerns about the health of commercial real estate?

Willy Walker: No. But you also have to be clear. We only take risk on multifamily loans. So, we don’t have any risk in our loan portfolio on office, retail, industrial, hospitality. Ninety-one percent of those multifamily loans are fixed-rate loans. So, we don’t have credit issue. Specifically to multifamily loans, we’ve always been a predominantly fixed-rate lender. But also, the loans we take risks on we originate and securitize with Fannie Mae, and Fannie Mae and Freddie Mac since the Great Financial Crisis [GFC], have been debt service coverage lenders and not leverage lenders. So, they have a floor of 1.25 debt service coverage. So, we will not do a loan that does not have that coverage. What that means is that values can move around quite a bit as it relates to cap rates, and at the same time, all of these loans that were underwritten at 1.25 debt service coverage and because the majority of them are fixed-rate loans, you have no credit issue whatsoever. So, have we changed our underwriting standards over the last year? No. The issue with that is that we’ve been doing very low loan-to-value deals because of that 1.25 debt service coverage requirement. So, most of the lending we’ve been doing in 2023 is that low 50s to 50% loan to value. What that means is that many of our borrowers are getting 55% leverage.

WMRE: From conversations you might have had with executives from banks that do hold office loans and other types of commercial loans that are more prone to experience distress than multifamily, how are they dealing with it? How much “pretend and extend” situations are happening in the marketplace?

Willy Walker: There is a lot of pretend and extend going on. That term is a very bad term. Pretend and extend, it should be more like—"reality check and let’s work together.” In other words, “pretend and extend” is a term that basically said you are going to pretend the loan is okay, you are going to extend it for a period of time and cross your fingers that everything works. It’s a really bad way of looking at loan modifications. You are not pretending anything. You are realizing that the property isn’t performing, and you are making adjustments to make sure that the owner can hold on to the property and that the lender can get their money back at some point in the future. If there is anything I would underscore in that conversation is that “pretend and extend” is a very bad term. Banks don’t need the capital back right now, they don’t need their principle balance back right now, so as long as the banking system remains healthy, and we don’t drop ourselves into some big recession, you are going to be able to work with real estate borrowers and developers to work these loans out. But there are concerns. There is a lot of work going on at a lot of banks and they don’t want to take on additional exposure right now. If you go in and say “I need a new loan,” they are not going to be excited. And so that’s a problem right now.

WMRE: Some people did make money during the Great Financial Crisis because they were willing to take some risks where they saw opportunity for the future. Do you see any new opportunities in today’s marketplace? What are they?

Willy Walker: There is always opportunity. An example is seniors housing right now is still quite challenged because you still have a hangover from the pandemic. Fundamentals haven’t gotten back to where they used to be before the pandemic. But the demographics behind seniors housing are fantastic because of the aging population and their needs. So, if you can buy into the market today, with challenged fundamentals [at an appropriate cap rate] and finance it with a fixed-rate loan and wait, you know there are going to be improving fundamentals over the next five years. And I do think we will start to see a shift in back-to-office in the U.S. I don’t think that office recovers quickly. But first, it will happen to trophy assets, trophy office is an asset class that’s performing very well right now and [it gets mixed in with regular office]. Retail—lots of people are sitting there saying “consumer sales are weak, we are going into a recession.” We are not going into a recession right now. We just got the numbers. Retail is an asset class that’s held up exceedingly well. So, there are plenty of opportunities to invest in retail properties, and with retail cap rates where they are and financing costs on retail where they are, you can actually find positive leverage on retail that is very hard to find in multifamily.


Source: Diving Into CRE Debt Stats

https://www.creconsult.net/market-trends/diving-into-cre-debt-stats/

1120 E Ogden Ave

New Listing | Retail-Office For Sale Naperville IL
eXp Commercial is pleased to present to market 1120 E Ogden Avenue, a highly visible 10,860 square foot retail-office property on 1.26 acres in desirable affluent Naperville, Illinois, along the I-88 E-W corridor approximately 28 miles west of Chicago. The property is currently owner-occupied and will be fully vacated shortly after closing, with the seller seeking approximately 60 days of post-closing possession. Flexible B3 zoning allows for a number of retail and office uses, ideal for an investor, owner-user, or redevelopment of the property.
Listing Broker: Randolph Taylor | rtaylor@creconsult.net

https://www.creconsult.net/retail-office-for-sale-1120-e-ogden-ave-naperville-il-60563/

Friday, December 1, 2023

Monitoring the Cost of Homeownership vs. Cost of Renting in Your City

Monitoring the Cost of Homeownership vs. Cost of Renting in Your City

Rent vs. Own Psychology

The battle between renting and owning is intuitive. If renting is significantly cheaper than owning a home, more of the population will gravitate towards renting. If homeownership is only moderately more costly than renting, people will be more inclined to pursue ownership.

As a multifamily investor, you can get in trouble if you lose sight of this. Sometimes, you'll see evidence of rent growth in the submarket, within the rent comps, and even at the property. However, the price of homeownership in the market will always act as a governor, regardless of what the rent data says.

I think of 30% as the "danger zone." In other words, when the cost of homeownership is less than 30% more costly than renting, prospective renters start gravitating towards homeownership. While 30% is still a wide margin, the benefits of homeownership can eat into that:

  • Tax benefits
  • Appreciation
  • Stability of long-term fixed mortgage
  • Principal Loan paydown

High Cost-of-Living States

Realistically, some U.S. cities never have to worry about rents creeping into the "danger zone." Coastal cities like Los Angeles, San Francisco, New York, and Seattle have always been supply-constrained. Further factoring in rising interest rates, the cost of homeownership vastly exceeds renting costs. I'll show you some concrete examples of how this could look later in the article.

However, markets in the Midwest, Great Plains, and tertiary cities around the county could run into instances where housing costs fall in line with rentals (or at least close to it). Investors would be wise to monitor homeownership vs. rental trends as the cost of homeownership could be a real threat to rental fundamentals.

Tracking Rental & Ownership Costs

To look at a city and figure out a “homeownership vs. renting cost delta trend,” we will need to collect a few pieces of historical information:

  • Submarket Rents
  • Submarket Home Values
  • Mortgage Rates
  • Other Homeownership Costs (MIP, insurance, property taxes)

I want to collect the bulleted information for three different dates:

  • Current: 07/2023
  • Pre-Inflation: 07/2021
  • Pre-Covid: 07/2019

The current date will reflect the cost of homeownership with high mortgage rates. Pre-inflation will give us the idea of homeownership with artificially low-interest rates. And finally, pre-covid data is potentially more of a "normalized period" before the pandemic, mild recession, stimulus, and aggressive rate hikes.

For MSAs, let's pick:

  • Memphis
  • Detroit
  • San Francisco

We will research and gather rental, home value, mortgage rates, and other homeownership costs for each city at three defined periods.

MSA Rent Trend Research


I'm going to focus on the Memphis "metro" rents (specified in column "B") as opposed to "city" rents.

Memphis, TN row in the report.

I'm focusing on 2BR rents as those are more comparable to a house. I will now grab the gross rent for the following dates from the download:

  • 07/2023 = $1,155
  • 07/2021 = $1,082
  • 07/2019 = $902

MSA Home Valuation Research


I'm going to focus on the Memphis "MSA" valuations (specified in column "D")

Memphis, TN row within the report.

I will now grab the home valuations:

  • 07/2023 = $236,067
  • 07/2021 = $198,096
  • 07/2019 = $153,971

Mortgage Rate Research


Let's use OptimalBlue to get mortage rate information. I set a custom range and grabbed the 30-year conforming interest rate (dark blue line) on the last business day of July in 2019, 2021, and 2023

Mortgage rates from July 2019 - Present.

  • 07/2023 = 6.881%
  • 07/2021 = 2.987%
  • 07/2019 = 4.048%

We need to estimate a few more variables to calculate a mortgage payment and the interest rate.

  • Loan Amount
  • Loan Term (Amortization)

Let's assume the loan amount is 95% of the home valuation. The minimal down payment for a conventional loan is 5%. We'll use a 30-year loan term. Now, we can calculate a corresponding mortgage payment for each home valuation we pulled from Zillow Research.

Other Costs Research

The mortage payment is only one of the financial obligations you’ll face if you own a home. You'll also have to insure the home, pay property taxes and mortgage insurance if you're down payment is less than 20%.

These costs add up, and it's important to factor them in when comparing homeownership to renting (this analysis won't include repairs and maintenance but should also be considered).

First, let's calculate the MIP. This calculation depends on factors such as credit score, total loan amount, and your lender. For now, we will keep it simple and assume the annual MIP expense is 0.75% of the loan amount.

Use the Census Bureau's "quick facts" page for other property taxes and insurance costs. It's located in the "Housing" section once you select your city (Memphis). This information is titled:

"Median selected monthly owner costs - without a mortgage, 2017-2021" = $464

Housing costs for Memphis, TN.

I will use this assumption for the years 2019 and 2021

  • 07/2023 = 
  • 07/2021 = $464
  • 07/2019 = $464

The data is stale (2017-2021), and considerable inflation has happened since 2021. I will increase this number by 20% for the 2023 entry. Since property taxes tie out to home values (which have increased considerably), and insurance has also increased, 20% feels like a fair adjustment.

  • 07/2023 = $464 x 1.20 = $557
  • 07/2021 = $464
  • 07/2019 = $464

Compiling Rental vs. Ownership Data

Let's go ahead and compile all the data we've collected thus far.

Entering all the data we've collected thus far in Excel.

Note: The “Mortgage Payment” column is just a PMT function in Excel.

PMT formula inputs.

MIP is taking the loan amount multiplied by 0.75% and diving by 12 months.

We’re ready to add two more columns to determine the total monthly homeownership cost and how much more costly it is than renting.

Homeownership cost compared to rental cost in the Excel table.

In July 2021, it was 27% more expensive to own than rent, flirting with "the danger zone." However, skyrocketing interest rates have caused homeownership costs to increase significantly more than rents over that same period (nearly 2x more expense to own in 2023).

Note: We're only comparing average 2BR rents in Memphis to the average homeownership cost. The next step would be to plug in your proforma rents for your proposed property.

Comparing your specific proforma rents to local homeownership costs.

If you were targeting $1,250 for a class B value-add in 2019, it would have been a tough sell to potential renters on the fence about homeownership. Costs are nearly identical between rent and own. However, present day, there’s a much more prominent buffer.

It's also important to note that this data is in constant flux. You should check back in at least twice a year. Housing values could start to deteriorate if rates stay high, leading to homeownership costs falling closer to rents.

We can also repeat the same steps for Detroit and San Francisco and compile those results.

Memphis, Detroit, and San Francisco data rent vs. own data.

Detroit is similar to Memphis. It's a market that has flirted with homeownership being a better deal than renting. Homeownership was likely more financially prudent than renting luxury units in Memphis and Detroit before rates spiked over the past year.

San Francisco is on the other end of the spectrum. Homeownership has never really been affordable compared to renting. Rents have declined since 2019, and owning a home is almost 4x more expensive than renting.

Many markets require a multifamily investor to be very in tune with the residential housing market because there are periods when renting and owning compete with each other.

If you miss this realization, it could be a costly lesson during your ownership tenure.

Conclusion 

You want to understand how big of a threat homeownership is in the city you invest in. You can skip this step if you're an investor in San Francisco, Los Angeles, Boston, or other high cost-of-living coastal markets.

However, if you invest in condos converted to apartments in Detroit or a build-to-rent luxury development in Memphis, you'd be wise to ensure your rent projections aren't in the "danger zone."

Some other rental property types that may be more prone to competition from homeowners are:

  • Converted condos
  • Townhome rentals
  • Build-to-Rent
  • Luxury (Class A)

Gathering the pertinent information and checking this diligence item off your box will take a few minutes once you're proficient. Once you confirm a reasonable buffer between your rental and homeownership, you can underwrite your proforma rents with information from comps, submarket outlook, and historical trends.

Source: Monitoring the Cost of Homeownership vs. Cost of Renting in Your City

https://www.creconsult.net/market-trends/monitoring-the-cost-of-homeownership-vs-cost-of-renting-in-your-city/

Thursday, November 30, 2023

Grand Prairie 2nd

NEW LISTING: 4,408 SF Medical-Dental | Dallas-Fort Worth Market
eXp Commercial is pleased to present to the market a fully built-out, free-standing 4,408-square-foot medical/dental office building in Grand Prairie, Texas, centrally located 22 miles southwest of downtown Dallas and 26 miles southeast of downtown Fort Worth. Though the current use is for a dental office, the property is zoned PD267A (commercial development), allowing for a variety of medical and dental uses. The property is owner-occupied and will be vacated at closing, providing an ideal opportunity for another dental practice or any number of medical office users to utilize the property for their practice or an investor who works with medical office tenants to take advantage of an investment opportunity.
Listing Brokers:
Tyson Grona | tyson@tysongronagroup.com | 936.444.3635
Randolph Taylor | rtaylor@creconsult.net | 630.474.6441
https://properties.expcommercial.com/1253332-sale

23-Year High Mortgage Rates Bolstering Apartment Demand

Misaligned New and Existing Home Sales

Trends Depict a Market in Flux

Single-family debt costs eclipse long-standing high point. In the latter half of August 2023, the average 30-year fixed-rate mortgage surpassed 7.2 percent, up about 170 basis points from one year ago and the highest figure in more than two decades. With federal student loan obligations set to resume in October, taking on long-term debt at a 23-year high rate will continue to dissuade prospective first-time homebuyers, in turn bolstering apartment demand. Additionally, elevated mortgage rates deter existing homeowners from listing, providing pricing reinforcement amid a historic shortage of options, especially at the lower end of the cost spectrum. In July 2023, the number of existing homes for sale held about 40 percent below the trailing 10-year same month average. Concurrently, the median price ascended to a 13-month high at $396,700, the fourth-most expensive measure on record.

Gap between new and existing home prices is tightening. While the existing home market has been stalled by insufficient inventory and rising prices, newly-built houses comprise an increasingly large portion of total sales. In July, new homes accounted for roughly 16 percent of overall transactions, compared to a share of about 11 percent in the same month of 2022. This trend correlates with newly-built dwellings becoming comparatively less expensive. The gap between the median sale price of each segment tightened to $32,400 in July, a relative discount that helped push new home sales to a 17-month high. Purchases of newly-built houses are ramping up, yet it has not translated to existing homes coming to market, implying that a portion of this activity stems from first-time homeowners making a direct leap into newly-built houses.

New homes are still not attainable for many first-time buyers. While recent indicators signal that some residents are entering homeownership via a newly-built home, that is not expected to be a long-term trend. From a cost standpoint, new homes still command higher prices than existing options, limiting the number of residents that can afford to buy. Locational factors play a role as well, with many newly-built homes being constructed in outlying areas well distant of city centers and employment hubs.

Developing Trends

Multifamily project starts contract to 22-month low. The apartment sector is enduring historic construction activity at an inopportune time of soft demand, which has pushed up vacancy and curbed rent growth. Early signs of a medium-term development deceleration have begun to emerge, however, as multifamily project starts in July 2023 were at the lowest mark since September 2021. Multifamily permit issuance was also down more than 30 percent year-over-year in July, further hinting at apartment builders starting to tap the brakes. While the nation still faces a housing shortage not set to alleviate in the near term, a thinning construction pipeline could help stabilize the multifamily sector.

Material and insurance costs heighten development hurdles. The average insurance cost per apartment unit rose by 33 percent year-over-year in the second quarter, with several Florida, Texas and California metros noting much larger hikes. These added expenses, alongside the construction cost index jumping to an all-time high in August 2023, are cooling development. Single-family homebuilder confidence also dipped to a three-month low.

-16.3%

31.5%

Year-Over-Year Change in Existing Home Sales in July Year-Over-Year Change in New Home Sales in July

Sources: Marcus & Millichap Research Services; Capital Economics; Freddie Mac; Moody’s Analytics; Mortgage Bankers Association; National Association of Home Builders; National Association of Realtors; RealPage, Inc.; U.S. Bureau of Labor Statistics; U.S. Census Bureau; Wells Fargo

Source: 23-Year High Mortgage Rates Bolstering Apartment Demand

https://www.creconsult.net/market-trends/23-year-high-mortgage-rates-bolstering-apartment-demand/

Wednesday, November 29, 2023

Insurance prices per apartment unit rise 33% YoY

Insurance costs are rising at an accelerated rate for commercial real estate, up 33% year-over-year, per apartment unit to $180, according to Marcus & Millichap’s new report.

Insurance now accounts for more than 8% of an owner’s quarterly per-unit operating expenses, nearly double the share from five years ago.

Property tax and payroll costs combined rose 9% in the past year and the national average effective rent rose 4%.

If that’s not difficult enough, providers are concurrently implementing new policy limitations to decrease their exposure, especially for multifamily hotbeds in Florida, California, and Texas.

In Houston and Fort Worth, the average cost to insure a unit rose more than 40% year-over-year in the second quarter, according to the report.

“This disparity and expectations for further operating cost increases and rent growth moderation will broadly influence development proposals, property valuations, and investors’ acquisition criteria moving forward,” Marcus & Millichap said.

“Developers react by paring back project starts. Spiking insurance premiums, along with elevated labor, materials and financing costs, are making it more difficult for developers to underwrite ground-up developments.

“This dynamic has the potential to facilitate a broad pullback in U.S. project starts, a trend that already appears to be taking shape” given that the value of all commercial starts fell 11%, while the number of permits issued for new multifamily projects in June represented the lowest level since late 2020.

Providers leaving key markets is the next shoe to drop.

In Florida, customers’ average rate hike could rise by 12%, given that Farmers Insurance’s departure will pressure the state-run Citizens Property Insurance Corporation. Citizens expects to have up to 1.7 million policies by year-end and in June, it requested the maximum premium increase allowed.

In California, State Farm and Allstate’s exodus may impact renewals in addition to new policies, a potential concern for owners of older buildings requiring seismic upgrades and assets in wildfire zones.

Multiple severe thunderstorms threw a vicious punch at the commercial real estate industry in the first half of 2023, leaving it with the highest spike in premiums at 18.3%.

All commercial real estate asset classes are seeing rising premiums, according to a recent report from The Council of Insurance Agents & Brokers, as reported by GlobeSt.com.

Repeated severe weather the past half-year left CRE with the highest spike in premiums at 18.3%, tops of any industry category.


Source: Insurance prices per apartment unit rise 33% YoY

https://www.creconsult.net/market-trends/insurance-prices-per-apartment-unit-rise-33-yoy/

Tuesday, November 28, 2023

Commercial Real Estate Loan Modifications Quadruple, With Multifamily Leading The Way

Modifications on commercial real estate-related collateralized loan obligations spiked in the second quarter to $4B as more property owners sought refuge from encroaching maturity dates and rising interest rates.

That figure is a 300% increase from the first quarter, when $1B in CLOs were modified, according to DBRS Morningstar.

The modifications represent a number of different strategies to buy time for landlords, Morningstar said in its quarterly CRE CLO report. Those include increasing a loan balance, changing an interest rate, deferring contractual payments, extending a maturity date or allowing a borrower to access existing reserves.

“In most cases, lenders appear to employ modification strategies to assist borrowers in achieving business plans that are behind schedule,” the Morningstar report says.

Modifications on CLOs backing apartment properties grew to 10.6% quarter-over-quarter with an unpaid loan balance of $5B, according to the report.

Apartment owners in the Sun Belt in particular are feeling the pinch, Bloomberg reported, as a glut of new supply hits the market, denting rent growth as loans approach renewal.

Office and retail modifications grew at a slower pace, but office still has a higher share than multifamily, with 14.5% of office-backed CLOs modified in Q2.

The surge in modifications doesn't point to immediate collapse, according to DBRS Morningstar Vice President Stephen Koehler, who oversees CRE CLOs.

“It’s kind of a ‘Keep your eyes on this. Don’t forget about this,’ but not like a siren going off,” Koehler told Bloomberg.

CLO delinquencies edged up, according to Morningstar. In June 2023, the overall delinquency rate for CRE CLOs came in at 3.14%, a 15-basis-point increase from 2.99% in March but up 2.25% from a year earlier.

Special servicing on CLOs, however, dipped by 27 basis points from Q1, the first quarterly decrease in more than a year, Morningstar said.

Source: Commercial Real Estate Loan Modifications Quadruple, With Multifamily Leading The Way

https://www.creconsult.net/market-trends/commercial-real-estate-loan-modifications-quadruple-with-multifamily-leading-the-way/

Price Reduction – 1270 McConnell Rd, Woodstock, IL Now $1,150,000 (Reduced from $1,200,000) This fully occupied 16,000 SF industrial propert...