Tuesday, December 5, 2023

The New Era of Rental Prices

The New Era of Rental Prices

For renters who've felt the sting of rapidly increasing costs, there's a sigh of relief on the horizon. The rapid inflation of rent prices, which has been a pressing concern for many in recent years, is showing signs of stabilization.

From Skyrocketing to Stabilizing: The New Era of Rental Prices

rental prices across the US

Analysis based on average monthly rent data for provided by CoStar Group. The data includes newly posted rents, not lease renewals, for 1,660 counties for June of each year from 2019 to 2023. Counties with fewer than 1,000 multi-units, according to Census Bureau data, were excluded.

Good news is on the horizon for renters: The rapid escalation in rental prices, which had previously seemed unstoppable, appears to be taking a pause.

Rental rollercoaster: Between 2020 and 2022, rents surged by a striking 15%, the most rapid increase in nearly a century. However, the fervor has calmed. Rent growth has reverted to pre-pandemic rates, seeing an annual growth of about 1 to 3 percent. Interestingly, in cities that recently witnessed surging rents like Austin and Atlanta, prices are now dropping. As Igor Popov, chief economist at Apartment List, observes, the rental market is "taking a breath.

Why the slowdown? A significant factor in this slowdown is the surge in housing construction. An impressive nearly 1 million new apartment units are currently under construction nationwide. By the end of 2023, over half of these are expected to be on the market. Concurrently, the demand for rentals is waning as the U.S. adjusts to post-pandemic life. The appetite for apartment living has decreased, with fewer individuals moving out and more staying in familial homes. This change has created a discrepancy between available apartments and interested renters, thereby stabilizing price growth.

more new apartments over 50 years

The Sun Belt phenomenon: The Sun Belt region, which includes parts of the Southern U.S., experienced a unique scenario. Initially, during the pandemic, there was a spike in demand as individuals sought warmer climates and more affordable living conditions, moving away from urban centers like New York. This shift led to a boom in rental prices in cities like Phoenix, Dallas, and Miami. However, the rush to meet this demand has led to an oversupply, causing rents to stabilize and even decrease in some areas.

sun belt cities rent price growth

➥ THE TAKEAWAY

The new normal: While renters can find solace in stabilizing prices and even some reductions, it's crucial to note that the cost of renting remains substantially higher than pre-pandemic levels in many areas. Areas like Atlanta, despite witnessing recent rent reductions, still have renters paying substantially more than before the pandemic. The introduction of incentives like months of free rent indicates a market adjusting to new realities, but the days of pre-pandemic affordability seem to be a distant memory for now.

Source: The New Era of Rental Prices

https://www.creconsult.net/market-trends/the-new-era-of-rental-prices/

Monday, December 4, 2023

Mid-Priced Apartment Demand Soars Amid Economic Uptick

Mid-Priced Apartment Demand Soars Amid Economic Uptick

Plus: CoStar's analysis shows a continued dip in CRE sale prices in October, aligning with the ongoing trend of increased rates.

Leasing Surge in Mid-Priced Apartments with Improved Economy

In 2023, the U.S. multifamily market has seen a significant upswing in renter demand, especially for mid-priced apartments rated three stars. This shift marks a recovery from a sluggish performance in the latter half of 2022.

A surge in demand: There has been a 77% increase in occupancy over the last year, with 260,000 more units being filled than vacated. This surge is primarily in mid-priced, three-star properties, contrasting with the disappointing absorption of only 146,000 units in 2022.

Influencing the market: The market slump in 2022 was driven by a combination of high inflation, increased oil prices, and recession fears, which significantly impacted consumer confidence and demand, especially in mid- and low-priced properties. This led to renters seeking more affordable housing solutions or delaying household formation.

Improving economy: The rebound in 2023 has been fueled by improved consumer confidence, lower inflation, strong wage growth, and reduced recession fears. These factors have notably increased the demand for three-star properties by 54,000 units in the first three quarters of the year.

➥ THE TAKEAWAY

Positive outlook: The high-end segment of the market, comprising four- and five-star properties, has remained stable, thanks to the lower rent-to-income ratio of its renter households. Looking ahead, if the economy avoids a recession, multifamily demand could return to pre-pandemic levels by 2024, although supply is expected to exceed demand for the third consecutive year.


Source: Mid-Priced Apartment Demand Soars Amid Economic Uptick

https://www.creconsult.net/market-trends/mid-priced-apartment-demand-soars-amid-economic-uptick/

Commercial Real Estate Financing Rate Snapshot July 31st 2023

Average of the top competitive rates from eXp Commercial's National Capital Markets Partner CommLoan from a database of 700+ commercial lenders as of 731/23

*Rates are provided for comparison purposes only. Actual rates are dependent on property and sponsor.

https://www.creconsult.net/market-trends/commercial-real-estate-financing-rate-snapshot-july-31st-2023/

Sunday, December 3, 2023

Price Gap Between Rent and Home Ownership in Chicago

The price gap between average apartment rents and the cost of owning a home in the Chicago metro area is widening, providing landlords with leverage to push rents even higher.

According to a recent report by RentCafe, the average rent in Chicago is now $2,215 per month. This is significantly higher than the cost of owning a home, which is currently $1,950 per month, including mortgage payments, property taxes, and insurance.

The widening price gap is being driven by a number of factors, including rising interest rates and strong home values. As interest rates have increased, the monthly cost of owning a home has become more expensive. At the same time, home values in Chicago have continued to rise, making it even more difficult for first-time homebuyers to enter the market.

The widening price gap is giving landlords more leverage to push rents. With fewer people able to afford to buy a home, demand for rental housing is increasing. This is putting upward pressure on rents, and landlords are starting to see more success in raising rents.

The widening price gap is also having an impact on multifamily net operating income (NOI). NOI is the money that a multifamily property generates after paying all of its operating expenses. As rents increase, NOI also increases. This can help to offset the higher commercial mortgage interest rates that landlords are facing.

In the long term, it is unclear whether the widening price gap between rent and home ownership will continue. However, in the short term, it is likely to continue to put upward pressure on rents and boost multifamily NOI.

Bottom Line

The price gap between rent and home ownership in Chicago is widening, providing landlords with leverage to push rents even higher. This is being driven by rising interest rates and strong home values. The widening price gap is also having an impact on multifamily NOI, which is likely to increase in the short term.

https://www.creconsult.net/market-trends/price-gap-between-rent-and-home-ownership-in-chicago/

Saturday, December 2, 2023

Diving Into CRE Debt Stats

Amid rising interest rates, some troubles at regional banks and investment sales volume that has shrunk to a fraction of its size from cyclical peaks, a lot of the debate around commercial real estate for the past half a year has revolved around how much people should worry about potential defaults. The Mortgage Bankers Association, an industry trade group, reported that in the first quarter of 2023, banks and thrifts experienced a 13-basis-point quarter-over-quarter increase in the 90-plus days delinquency rate on their commercial/multifamily loans, while life insurers and CMBS lenders experienced 10-basis-point increases each.

Real estate data firm MSCI Real Assets reported that at midyear, the volume of distress in the U.S. commercial real estate market rose to $71.8 billion, outpacing workouts by more than $8 billion. MSCI defines distress as encompassing bankruptcies, defaults, court administration, tenant distress or liquidation and loan transfers to special servicers. Much of that distress is concentrated on two property sectors with more than $24.0 billion of that outstanding distress tied to office buildings, and $22.6 billion in the retail sector. As of the second quarter, multifamily properties accounted for $6.8 billion in distressed situations. So, while the amount of distress in the commercial real estate market is growing, the question is how broad-based the challenges will be for borrowers and lenders.

To get a perspective on what’s happening in the lending market, WMRE talked with Willy Walker, chairman and CEO of Walker & Dunlop, a commercial real estate finance and advisory firm with a loan servicing portfolio that last year totaled $123 billion.

This Q&A has been edited for length, style and clarity.

WMRE: We keep seeing headlines about how the commercial real estate industry is “headed for a crisis.” How do you assess the commercial real estate industry’s health right now, what’s your outlook on it?

Willy Walker: I think it’s very important to define commercial real estate. Inside of commercial real estate there are various asset classes that all have very distinct performances at this time in the economy, at this time in the cycle. With that said, many people say “commercial real estate debt crisis” and they throw everything into [their definition of] commercial real estate and that’s not the case. If you look at the amount of debt outstanding in the commercial real estate today, it’s $4.5 trillion, but it’s very important to note that half of the debt outstanding in the commercial real estate world, $2.0 trillion, is to multifamily properties. There’s no crisis in multifamily whatsoever today. Period. So, when headlines say there’s a crisis in commercial real estate debt, half of that debt is in multifamily. What most people are talking about when they are talking about the crisis is they are talking about office. The office market is not doing so great. [But] when people say “commercial real estate crisis,” they are not looking at the performance of multifamily, retail, industrial, hospitality and they are going straight to office. So, specifically to your question, there is no crisis in commercial real estate.

WMRE: How much of a problem are office loans right now?

Willy Walker: Office is 17% of the total debt outstanding in commercial real estate today. And the Mortgage Bankers Association estimates that there are $98 billion of bank office loans that need to be refinanced in 2023. That’s a very significant amount of loans. But what you are finding right now is that lenders are working with borrowers to rework those loans and make it so the borrower is not defaulting and the lender is not taking control of the property. So the Office of the Comptroller of the Currency, the Federal Reserve and FDIC in June guided the banks that they could set up reserves against those loans and be able to engage with borrowers to rework the terms and conditions of those loans. So, what you saw in Q2 earning of CitiGroup, and JP Morgan and Wells Fargo were significant reserves [about $1 billion each for CitiGroup and JP Morgan] that allow them to go and work with the borrowers on those loans and make it so they don’t have to foreclose on those loans. The banks have plenty of liquidity today to be able to work with borrowers to rework these loans. Will there be defaults? Yes. Will there be loans foreclosed on? Yes. But there has not been this huge crisis [people] are talking of. Are there problems in the office sector? Yes. There is no investor, no lender today that says “I need to make a loan on an office.” [But they will work with borrowers on existing loans]. So, the big difference between 2023 and 2009 is that in the Great Financial Crisis, banks didn’t have liquidity, banks had to foreclose on properties and they had to move fast to get any money they could. Today, they don’t need to nor want to do that.

WMRE: If the Federal Reserve continues to raise interest rates, how do you expect it to impact the availability of debt in the commercial real estate sector?

Willy Walker: So, my understanding of what the Fed said is that they are not planning on continuing to raise rates, but they will look in September at whether they need to raise rates. What I did hear is that they are having difficulty getting to their 2% inflation target and that they have work to get through it. There are two very important things to keep in mind—the Fed Funds rate, which is a short-term interest rate and directly ties into SOFR, has gone up now by 525 basis points in the last 16 months. The 10-year Treasury over the last year has gone up about 100 basis points. The real estate capital markets are based off, in today’s market, the 10-year Treasury and not SOFR. There’s clearly a significant amount of debt that is outstanding in commercial real estate that is SOFR-based. So, if you were going to have borrowed on a floating-rate loan two years ago, your interest rate on that loan will have gone up by 400 to 500 basis points. If you are a fixed-rate borrower, you loan is based on the 10-year Treasury, and when you go to refinance, most people today are borrowing at a fixed rate. So, what’s important to understand is that there is plenty of real estate debt outstanding where the cost has gone up to the borrower, but if you are a fixed-rate borrower and you are refinancing, it’s not that dramatic a change. Also, if the short-term rates keep going up, the chance of a recession gets greater and greater, and so that is why the long yield of the curve has continued to be shorter and shorter and actually going down. One of the big issues here is how much more will [the Fed] raise on the short end of the curve and how it relates to the long end of the curve. The bottom line is if they keep raising rates, the chance of recession continues to go up, which will have the inverse effect on the long end of the curve [and bring financing costs down] because most people today are borrowing at fixed-rate and not floating- rate.

WMRE: Has Walker & Dunlop changed its lending strategy in any significant way in response to rising rates and concerns about the health of commercial real estate?

Willy Walker: No. But you also have to be clear. We only take risk on multifamily loans. So, we don’t have any risk in our loan portfolio on office, retail, industrial, hospitality. Ninety-one percent of those multifamily loans are fixed-rate loans. So, we don’t have credit issue. Specifically to multifamily loans, we’ve always been a predominantly fixed-rate lender. But also, the loans we take risks on we originate and securitize with Fannie Mae, and Fannie Mae and Freddie Mac since the Great Financial Crisis [GFC], have been debt service coverage lenders and not leverage lenders. So, they have a floor of 1.25 debt service coverage. So, we will not do a loan that does not have that coverage. What that means is that values can move around quite a bit as it relates to cap rates, and at the same time, all of these loans that were underwritten at 1.25 debt service coverage and because the majority of them are fixed-rate loans, you have no credit issue whatsoever. So, have we changed our underwriting standards over the last year? No. The issue with that is that we’ve been doing very low loan-to-value deals because of that 1.25 debt service coverage requirement. So, most of the lending we’ve been doing in 2023 is that low 50s to 50% loan to value. What that means is that many of our borrowers are getting 55% leverage.

WMRE: From conversations you might have had with executives from banks that do hold office loans and other types of commercial loans that are more prone to experience distress than multifamily, how are they dealing with it? How much “pretend and extend” situations are happening in the marketplace?

Willy Walker: There is a lot of pretend and extend going on. That term is a very bad term. Pretend and extend, it should be more like—"reality check and let’s work together.” In other words, “pretend and extend” is a term that basically said you are going to pretend the loan is okay, you are going to extend it for a period of time and cross your fingers that everything works. It’s a really bad way of looking at loan modifications. You are not pretending anything. You are realizing that the property isn’t performing, and you are making adjustments to make sure that the owner can hold on to the property and that the lender can get their money back at some point in the future. If there is anything I would underscore in that conversation is that “pretend and extend” is a very bad term. Banks don’t need the capital back right now, they don’t need their principle balance back right now, so as long as the banking system remains healthy, and we don’t drop ourselves into some big recession, you are going to be able to work with real estate borrowers and developers to work these loans out. But there are concerns. There is a lot of work going on at a lot of banks and they don’t want to take on additional exposure right now. If you go in and say “I need a new loan,” they are not going to be excited. And so that’s a problem right now.

WMRE: Some people did make money during the Great Financial Crisis because they were willing to take some risks where they saw opportunity for the future. Do you see any new opportunities in today’s marketplace? What are they?

Willy Walker: There is always opportunity. An example is seniors housing right now is still quite challenged because you still have a hangover from the pandemic. Fundamentals haven’t gotten back to where they used to be before the pandemic. But the demographics behind seniors housing are fantastic because of the aging population and their needs. So, if you can buy into the market today, with challenged fundamentals [at an appropriate cap rate] and finance it with a fixed-rate loan and wait, you know there are going to be improving fundamentals over the next five years. And I do think we will start to see a shift in back-to-office in the U.S. I don’t think that office recovers quickly. But first, it will happen to trophy assets, trophy office is an asset class that’s performing very well right now and [it gets mixed in with regular office]. Retail—lots of people are sitting there saying “consumer sales are weak, we are going into a recession.” We are not going into a recession right now. We just got the numbers. Retail is an asset class that’s held up exceedingly well. So, there are plenty of opportunities to invest in retail properties, and with retail cap rates where they are and financing costs on retail where they are, you can actually find positive leverage on retail that is very hard to find in multifamily.


Source: Diving Into CRE Debt Stats

https://www.creconsult.net/market-trends/diving-into-cre-debt-stats/

1120 E Ogden Ave

New Listing | Retail-Office For Sale Naperville IL
eXp Commercial is pleased to present to market 1120 E Ogden Avenue, a highly visible 10,860 square foot retail-office property on 1.26 acres in desirable affluent Naperville, Illinois, along the I-88 E-W corridor approximately 28 miles west of Chicago. The property is currently owner-occupied and will be fully vacated shortly after closing, with the seller seeking approximately 60 days of post-closing possession. Flexible B3 zoning allows for a number of retail and office uses, ideal for an investor, owner-user, or redevelopment of the property.
Listing Broker: Randolph Taylor | rtaylor@creconsult.net

https://www.creconsult.net/retail-office-for-sale-1120-e-ogden-ave-naperville-il-60563/

Friday, December 1, 2023

Monitoring the Cost of Homeownership vs. Cost of Renting in Your City

Monitoring the Cost of Homeownership vs. Cost of Renting in Your City

Rent vs. Own Psychology

The battle between renting and owning is intuitive. If renting is significantly cheaper than owning a home, more of the population will gravitate towards renting. If homeownership is only moderately more costly than renting, people will be more inclined to pursue ownership.

As a multifamily investor, you can get in trouble if you lose sight of this. Sometimes, you'll see evidence of rent growth in the submarket, within the rent comps, and even at the property. However, the price of homeownership in the market will always act as a governor, regardless of what the rent data says.

I think of 30% as the "danger zone." In other words, when the cost of homeownership is less than 30% more costly than renting, prospective renters start gravitating towards homeownership. While 30% is still a wide margin, the benefits of homeownership can eat into that:

  • Tax benefits
  • Appreciation
  • Stability of long-term fixed mortgage
  • Principal Loan paydown

High Cost-of-Living States

Realistically, some U.S. cities never have to worry about rents creeping into the "danger zone." Coastal cities like Los Angeles, San Francisco, New York, and Seattle have always been supply-constrained. Further factoring in rising interest rates, the cost of homeownership vastly exceeds renting costs. I'll show you some concrete examples of how this could look later in the article.

However, markets in the Midwest, Great Plains, and tertiary cities around the county could run into instances where housing costs fall in line with rentals (or at least close to it). Investors would be wise to monitor homeownership vs. rental trends as the cost of homeownership could be a real threat to rental fundamentals.

Tracking Rental & Ownership Costs

To look at a city and figure out a “homeownership vs. renting cost delta trend,” we will need to collect a few pieces of historical information:

  • Submarket Rents
  • Submarket Home Values
  • Mortgage Rates
  • Other Homeownership Costs (MIP, insurance, property taxes)

I want to collect the bulleted information for three different dates:

  • Current: 07/2023
  • Pre-Inflation: 07/2021
  • Pre-Covid: 07/2019

The current date will reflect the cost of homeownership with high mortgage rates. Pre-inflation will give us the idea of homeownership with artificially low-interest rates. And finally, pre-covid data is potentially more of a "normalized period" before the pandemic, mild recession, stimulus, and aggressive rate hikes.

For MSAs, let's pick:

  • Memphis
  • Detroit
  • San Francisco

We will research and gather rental, home value, mortgage rates, and other homeownership costs for each city at three defined periods.

MSA Rent Trend Research


I'm going to focus on the Memphis "metro" rents (specified in column "B") as opposed to "city" rents.

Memphis, TN row in the report.

I'm focusing on 2BR rents as those are more comparable to a house. I will now grab the gross rent for the following dates from the download:

  • 07/2023 = $1,155
  • 07/2021 = $1,082
  • 07/2019 = $902

MSA Home Valuation Research


I'm going to focus on the Memphis "MSA" valuations (specified in column "D")

Memphis, TN row within the report.

I will now grab the home valuations:

  • 07/2023 = $236,067
  • 07/2021 = $198,096
  • 07/2019 = $153,971

Mortgage Rate Research


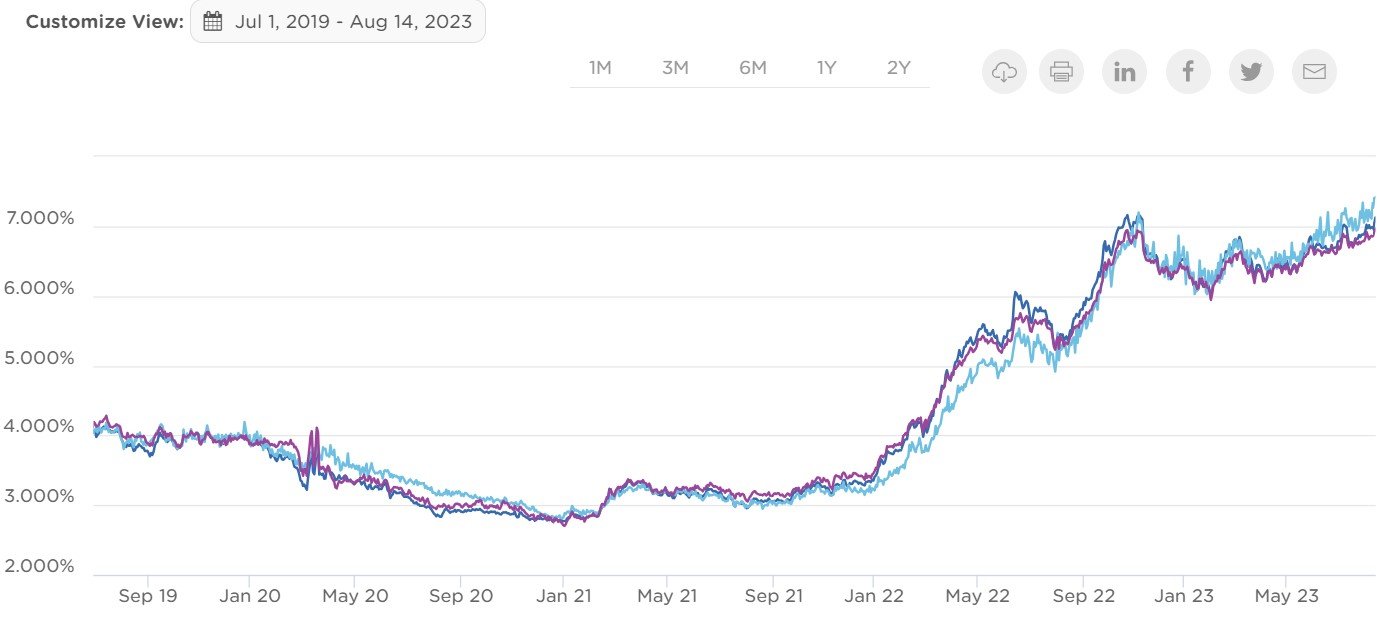
Let's use OptimalBlue to get mortage rate information. I set a custom range and grabbed the 30-year conforming interest rate (dark blue line) on the last business day of July in 2019, 2021, and 2023

Mortgage rates from July 2019 - Present.

  • 07/2023 = 6.881%
  • 07/2021 = 2.987%
  • 07/2019 = 4.048%

We need to estimate a few more variables to calculate a mortgage payment and the interest rate.

  • Loan Amount
  • Loan Term (Amortization)

Let's assume the loan amount is 95% of the home valuation. The minimal down payment for a conventional loan is 5%. We'll use a 30-year loan term. Now, we can calculate a corresponding mortgage payment for each home valuation we pulled from Zillow Research.

Other Costs Research

The mortage payment is only one of the financial obligations you’ll face if you own a home. You'll also have to insure the home, pay property taxes and mortgage insurance if you're down payment is less than 20%.

These costs add up, and it's important to factor them in when comparing homeownership to renting (this analysis won't include repairs and maintenance but should also be considered).

First, let's calculate the MIP. This calculation depends on factors such as credit score, total loan amount, and your lender. For now, we will keep it simple and assume the annual MIP expense is 0.75% of the loan amount.

Use the Census Bureau's "quick facts" page for other property taxes and insurance costs. It's located in the "Housing" section once you select your city (Memphis). This information is titled:

"Median selected monthly owner costs - without a mortgage, 2017-2021" = $464

Housing costs for Memphis, TN.

I will use this assumption for the years 2019 and 2021

  • 07/2023 = 
  • 07/2021 = $464
  • 07/2019 = $464

The data is stale (2017-2021), and considerable inflation has happened since 2021. I will increase this number by 20% for the 2023 entry. Since property taxes tie out to home values (which have increased considerably), and insurance has also increased, 20% feels like a fair adjustment.

  • 07/2023 = $464 x 1.20 = $557
  • 07/2021 = $464
  • 07/2019 = $464

Compiling Rental vs. Ownership Data

Let's go ahead and compile all the data we've collected thus far.

Entering all the data we've collected thus far in Excel.

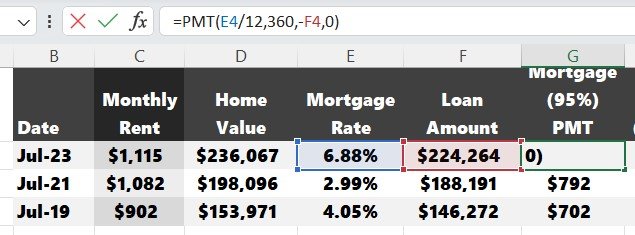
Note: The “Mortgage Payment” column is just a PMT function in Excel.

PMT formula inputs.

MIP is taking the loan amount multiplied by 0.75% and diving by 12 months.

We’re ready to add two more columns to determine the total monthly homeownership cost and how much more costly it is than renting.

Homeownership cost compared to rental cost in the Excel table.

In July 2021, it was 27% more expensive to own than rent, flirting with "the danger zone." However, skyrocketing interest rates have caused homeownership costs to increase significantly more than rents over that same period (nearly 2x more expense to own in 2023).

Note: We're only comparing average 2BR rents in Memphis to the average homeownership cost. The next step would be to plug in your proforma rents for your proposed property.

Comparing your specific proforma rents to local homeownership costs.

If you were targeting $1,250 for a class B value-add in 2019, it would have been a tough sell to potential renters on the fence about homeownership. Costs are nearly identical between rent and own. However, present day, there’s a much more prominent buffer.

It's also important to note that this data is in constant flux. You should check back in at least twice a year. Housing values could start to deteriorate if rates stay high, leading to homeownership costs falling closer to rents.

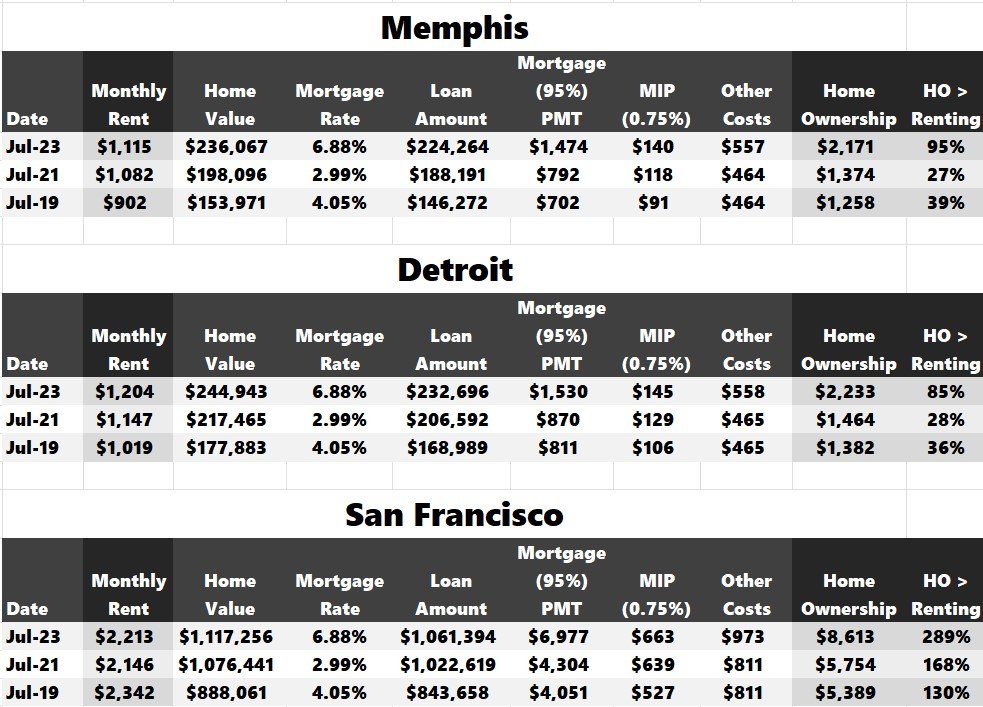
We can also repeat the same steps for Detroit and San Francisco and compile those results.

Memphis, Detroit, and San Francisco data rent vs. own data.

Detroit is similar to Memphis. It's a market that has flirted with homeownership being a better deal than renting. Homeownership was likely more financially prudent than renting luxury units in Memphis and Detroit before rates spiked over the past year.

San Francisco is on the other end of the spectrum. Homeownership has never really been affordable compared to renting. Rents have declined since 2019, and owning a home is almost 4x more expensive than renting.

Many markets require a multifamily investor to be very in tune with the residential housing market because there are periods when renting and owning compete with each other.

If you miss this realization, it could be a costly lesson during your ownership tenure.

Conclusion 

You want to understand how big of a threat homeownership is in the city you invest in. You can skip this step if you're an investor in San Francisco, Los Angeles, Boston, or other high cost-of-living coastal markets.

However, if you invest in condos converted to apartments in Detroit or a build-to-rent luxury development in Memphis, you'd be wise to ensure your rent projections aren't in the "danger zone."

Some other rental property types that may be more prone to competition from homeowners are:

  • Converted condos
  • Townhome rentals
  • Build-to-Rent
  • Luxury (Class A)

Gathering the pertinent information and checking this diligence item off your box will take a few minutes once you're proficient. Once you confirm a reasonable buffer between your rental and homeownership, you can underwrite your proforma rents with information from comps, submarket outlook, and historical trends.

Source: Monitoring the Cost of Homeownership vs. Cost of Renting in Your City

https://www.creconsult.net/market-trends/monitoring-the-cost-of-homeownership-vs-cost-of-renting-in-your-city/

Price Reduction – 1270 McConnell Rd, Woodstock, IL Now $1,150,000 (Reduced from $1,200,000) This fully occupied 16,000 SF industrial propert...