Chicago Suburban Multifamily Portfolio – Updated Financials
Two fully leased 12‑unit buildings in Lyons, IL offered as a 24‑unit portfolio. Renovated in 2024/2025 and delivering reliable stabilized cash flow with realistic rent growth upside—minimal near‑term capital needs make this a compelling value‑add or 1031 exchange opportunity.
Portfolio Highlights:
Price: $3,100,000 • 24 Units (17 Two‑Bedroom / 7 One‑Bedroom)
Cap Rates: 7.06% Current • 8.8% Pro Forma
Occupancy: 100% • Renovations 2024-25
Location: Prime west suburban area near Ogden Ave, I‑55, and Brookfield Zoo
🔗 View Offering Memorandums:
• Prescott Ave – https://creconsult.net/chicago-multifamily-listings/lyons-il-multifamily-portfolio-for-sale/
• 43rd St – https://creconsult.net/chicago-multifamily-listings/multifamily-property-lyons-il/
📞 Contact Me:
Randolph Taylor, CCIM • Vice President | Multifamily Broker
eXp Commercial – Chicago
Phone: (630) 474‑6441 • Email: rtaylor@creconsult.net
Hashtags:
#Multifamily #CommercialRealEstate #CRE #1031Exchange #ChicagoSuburbs #RealEstateInvesting #ValueAdd
Wednesday, August 6, 2025
Thursday, July 24, 2025
JUST SOLD | Bartlett, IL
Pleased to represent the seller in the successful sale of a professional property in Bartlett. Closed “as-is,” all cash, in just 90 days — another satisfied client in the western suburbs.
If you’re considering selling your multifamily or commercial property, let’s talk about strategies to achieve your best outcome:
Contact us: https://creconsult.net/contact-us/
Schedule a meeting: https://meetings-na2.hubspot.com/meetings/randolph
Randolph Taylor, CCIM
Vice President | Commercial Real Estate Broker
eXp Commercial – Chicago
📧 rtaylor@creconsult.net | 📞 (630) 474-6441
#CommercialRealEstate #ClosedDeal #ChicagoSuburbs #eXpCommercial #BartlettIL
Tuesday, July 22, 2025
Chicago Rent Growth Surges in 2025, Ranks #2 in U.S. Market
Chicago Rent Growth Surges in 2025, Ranks #2 in U.S. Market
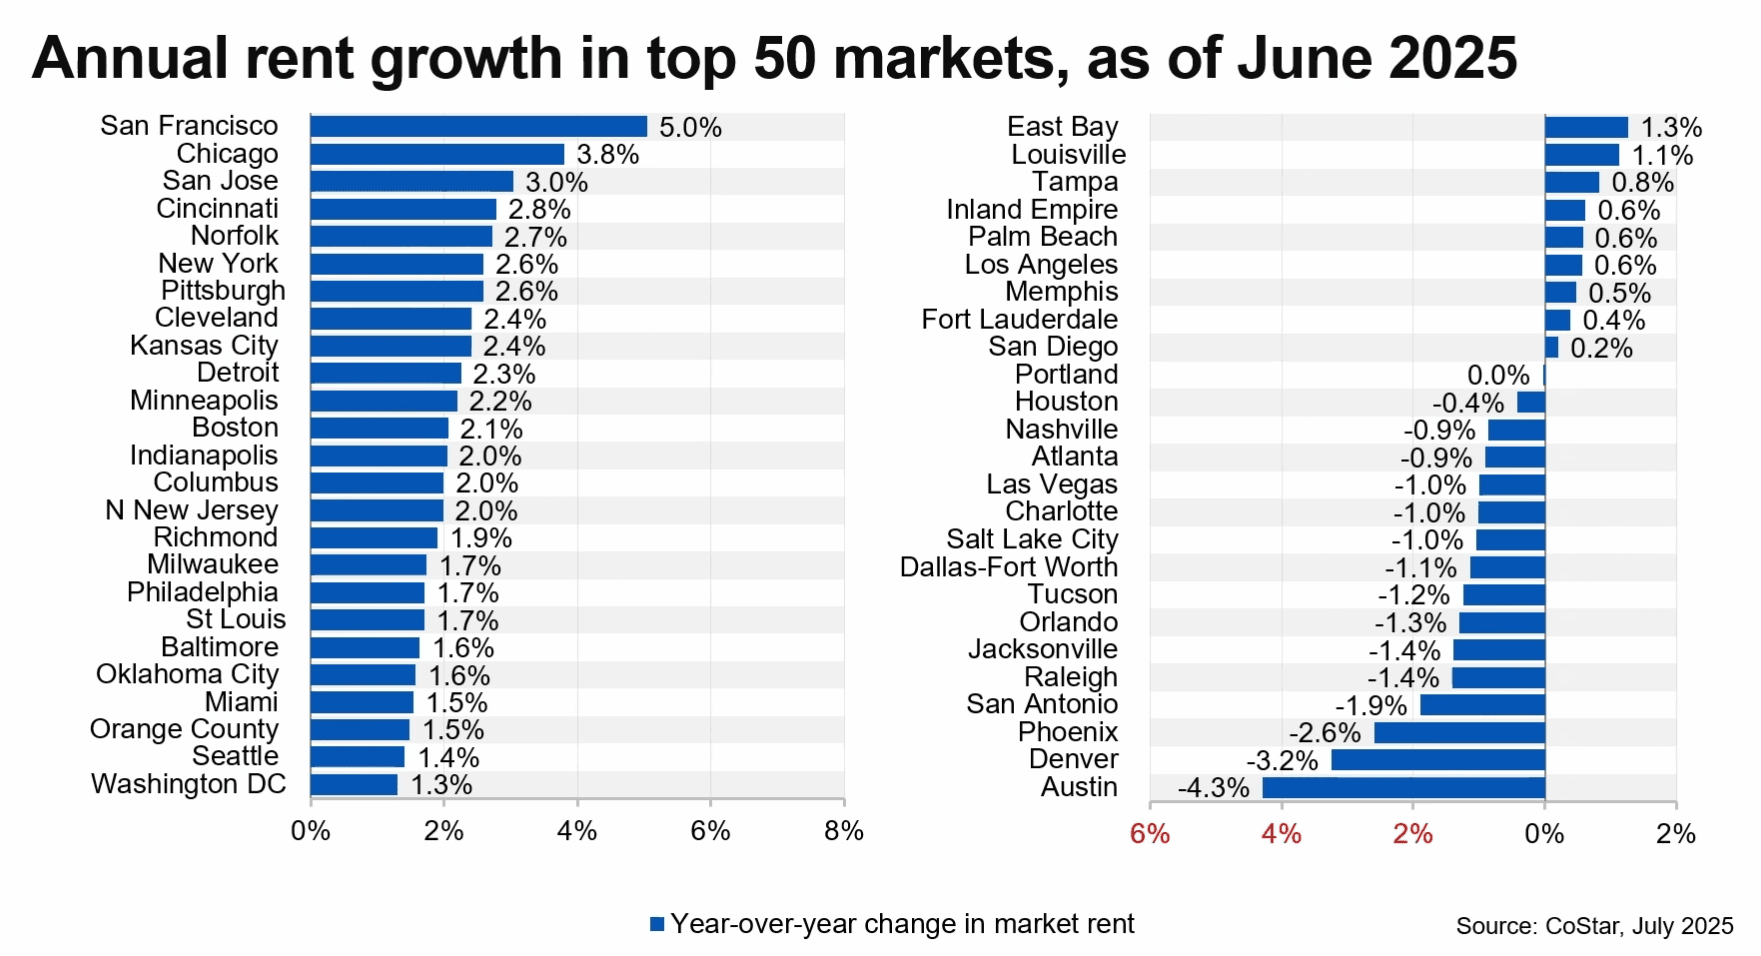
Chicago rent growth is surging in 2025, positioning the city as the second-strongest apartment market in the U.S., according to new data from CoStar Analytics. While San Francisco leads with a 5.0% annual increase, Chicago follows closely at 3.8%, driven by strong demand and limited new supply.
Nationwide, the U.S. multifamily sector is stabilizing after several years of volatility. Net absorption hit 268,000 units in the first half of the year—the third-highest ever recorded for that period. Meanwhile, new completions dropped by 25% year-over-year, helping ease the elevated national vacancy rate to 8.1%.
Chicago Outperforms as Sun Belt Struggles
Chicago rent growth stands out amid a national backdrop of modest rent gains. The CoStar report notes that asking rents nationwide rose just 0.9% year-over-year. In contrast, oversupplied Sun Belt markets like Austin (-4.3%), Denver (-3.2%), and Phoenix (-2.6%) saw steep declines.
Asset Class Trends: Affordability Wins
Affordable units (1–2 star) led rent growth at 1.7%, while luxury units (4–5 star) gained only 0.5%. Mid-tier (3-star) apartments aligned with the national average at 1%. These trends reflect growing demand for affordability, particularly in high-cost cities.
2025 Outlook for Multifamily Markets
Completions are projected to drop to 492,000 units by year-end. With sustained renter demand, the national vacancy rate may dip below 8%, and annual rent growth is forecast to rise to 1.8%. Chicago and other low-supply metros in the Midwest and Northeast are best positioned to outperform.
For more insights on multifamily trends, visit our Market Research section.
https://creconsult.net/chicago-rent-growth-2025-costar/?fsp_sid=1220
Monday, July 21, 2025
🏢 FOR SALE: 42-Unit Suburban Chicago Multifamily Portfolio | $5.55M
Fully stabilized apartment portfolio across three well-maintained assets in Lyons & Chicago Ridge, IL — 100% occupied with strong in-place income and significant upside through rental increases.
🔹 42 Units Across 3 Stabilized Properties
🔹 Blended Current Cap Rate: 6.88% | Pro Forma: 8.50%+
🔹 Turnkey Management & Strong Tenancy
🔹 Recent Renovations With Value-Add Potential
🔹 Ideal for 1031 Exchange or Portfolio Expansion
📍 Portfolio Includes:
12 Units – 4337 Prescott Ave, Lyons, IL
🔗 https://creconsult.net/chicago-multifamily-listings/lyons-il-multifamily-portfolio-for-sale/
12 Units – 7821 43rd St, Lyons, IL
🔗 https://creconsult.net/chicago-multifamily-listings/multifamily-property-lyons-il/
18 Units – 9826 Sayre Ave, Chicago Ridge, IL
🔗 https://creconsult.net/chicago-multifamily-listings/chicago-ridge-il-multifamily-property-for-sale/
💼 Offered individually or together as a portfolio — a rare opportunity to acquire stabilized, income-generating suburban multifamily assets in strong rental submarkets.
📩 Contact:
Randolph Taylor, CCIM
📧 rtaylor@creconsult.net
📞 (630) 474-6441
Dave Snehal, CCIM
📧 dave.snehal@expcommercial.com
📞 (773) 230-8055
#multifamily #chicagorealestate #cre #1031exchange #realestateinvesting #suburbanchicago #multifamilyportfolio #valueadd #expcommercial
Monday, July 14, 2025
🚨 New Listing | 100% Leased Chicago Retail Investment 🚨
📍 3217–3229 W Montrose Ave | Albany Park, Chicago
💰 Offered at $995,000
Excited to bring this fully leased ±4,000 SF retail condo to market in one of Chicago’s most vibrant neighborhoods. Located along high-traffic Montrose Avenue with over 21,000 VPD, this property offers:
✅ 6 storefronts with service, food, and professional tenants
✅ 100% occupancy
✅ Flexible lease terms for upside potential
✅ Current rents avg. $20/SF, while market rents are ~$28/SF MG
✅ Pro forma cap rate: 8.37%
📈 Low submarket vacancy (3.1%) and strong tenant demand make this a prime opportunity to secure stabilized income with immediate rent growth potential.
🔗 Full details, photos, and financials:
👉 https://creconsult.net/chicago-retail-investment-property
Reach out with questions or to request the offering memorandum.
—
Randolph Taylor, CCIM
Vice President | eXp Commercial
📞 630.474.6441
📧 rtaylor@creconsult.net
#ChicagoRealEstate #RetailInvestment #CommercialBroker #AlbanyPark #PassiveIncome #CRE #RetailForSale #eXpCommercial
Wednesday, July 9, 2025
🏢 Two Adjacent Turnkey Office Buildings For Sale – Joliet, IL 🏢
Located just off Larkin Ave and adjacent to Ascension St. Joseph Medical Center, these two well-maintained office buildings offer flexible layouts, optional furnishings, and strong owner-user or investment potential.
📍 2435 & 2439 Glenwood Ave | Joliet, IL
🔹 2435 Glenwood: ±10,311 SF | $1,295,000
🔹 2439 Glenwood: ±9,410 SF | $1,100,000
🔹 Total: ±19,721 SF | Offered Individually or Together
🔹 Delivered Vacant | Elevator Access in 2435
🔹 Recently Renovated | Fully Furnished Option
🔹 Ideal for Medical, Office, or Professional Use
📂 View Full Listings & OMs:
➡️ 2435 Glenwood: https://creconsult.net/office-building-for-sale-joliet
➡️ 2439 Glenwood: https://creconsult.net/2439-glenwood-office-sale-joliet
—
Listed exclusively by:
Randolph Taylor, CCIM
Vice President | Broker – eXp Commercial
📧 rtaylor@creconsult.net
📱 (630) 474-6441
🌐 https://creconsult.net
—
#OfficeForSale \#JolietIL #CommercialRealEstate #TurnkeyOffice #CRE #MedicalOffice #OwnerUserOpportunity #ProfessionalOffice #OfficeBuildings #CREBroker #RandolphTaylor
Wednesday, July 2, 2025
Chicago Multifamily Cap Rate Map: What Drives Investment Value
Chicago Multifamily Cap Rate Map: What Drives Investment Value
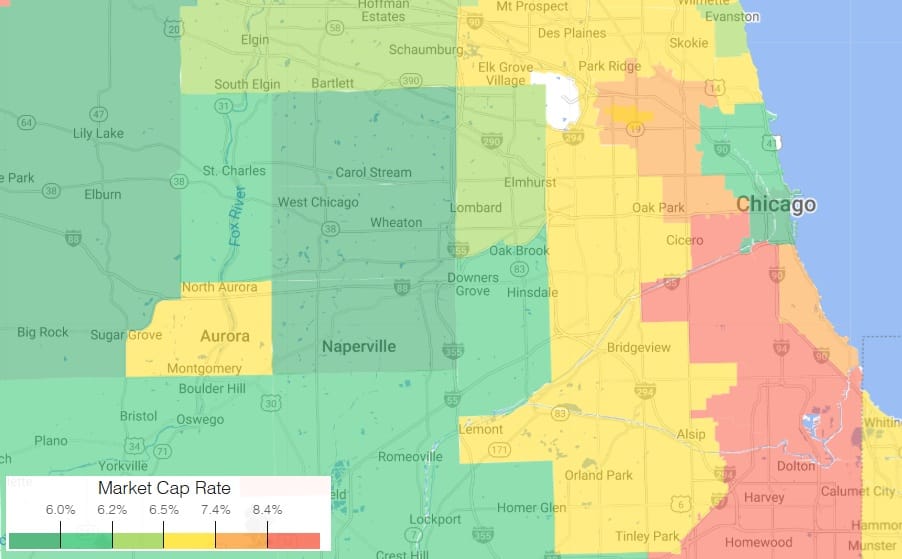
Understanding the Chicago multifamily cap rate landscape is essential for investment decisions in 2025. This thematic map offers more than just a visual of pricing — it reveals operational risk, submarket fundamentals, and asset class volatility that drive investor returns and pricing behavior.
Multifamily cap rates are uniquely complex. Unlike single-tenant net lease properties, where cap rates reflect tenant credit quality and lease duration, multifamily pricing is shaped by a dynamic mix of local economics, operational burdens, and tenant behavior.
Why Multifamily Cap Rates Behave Differently
Multifamily assets are short-term lease products with intensive operating models. Cap rates are influenced by:
Tenant churn and leasing friction
Market-specific demand volatility
Local policy factors (rent control, permitting)
Asset condition and cap-ex requirements
Class segmentation (Class A vs. B/C)
These factors result in cap rate spreads that reflect true income risk — not just credit quality. Net leased properties trade with narrow spreads because of credit-backed income streams, while multifamily spreads widen significantly due to greater unpredictability in NOI.
Read: Cap Rate Spreads: Understanding Multifamily Risk Premiums
2025 Trends in the Chicago Multifamily Cap Rate Market
Class A properties in neighborhoods like the Loop and North Lakefront trade in the mid-6% cap rate range, reflecting newer construction, institutional capital, and more predictable demand.
Class B/C stock in South and West Side submarkets often trades at 7.5–8.5%, pricing in turnover, deferred maintenance, and income fragility.
Citywide average: ~7.5%, though individual sales have ranged from 2.7% to over 20%, depending on property-level and locational risk.
Explore this in depth in the 2025 Multifamily Market Outlook
Interpreting the Cap Rate Map: Color as Risk and Opportunity
The map is not just a price guide — it’s a visual reflection of where investor risk premiums are most pronounced:
Green zones: Lower cap rates tied to stability, higher liquidity, and strong underlying demand
Red/orange zones: Higher cap rates due to rent stagnation, maintenance exposure, and affordability constraints
Class B/C assets in red zones may show low vacancy, but often have compressed rent potential and elevated cap-ex risk. Meanwhile, green zones often reflect stabilized assets with institutional appeal and longer-term appreciation upside.
Cap Rate Comparison: Multifamily vs. Net Lease
In net lease investments, cap rates respond to bond-like factors: credit ratings, lease term, and passive ownership. In contrast, multifamily cap rates are operationally intensive and respond to:
Rent collections and delinquencies
Turnover costs and resident churn
Capital expenditures
Micro-market volatility
As detailed in Cap Rate Spreads: Understanding Multifamily Risk Premiums, these layers of risk result in higher spreads — even in similar markets — making cap rates an expression of operational complexity rather than lease reliability.
For context on macro investment trends, see CBRE’s Multifamily Investment Outlook
Class A vs. B/C: Divergent Risk Profiles
Class A: Typically newer construction, higher-income tenant base, lower maintenance burden — and therefore tighter cap rates.
Class B/C: Older assets often require repositioning or increased management and capital, leading to higher cap rates but also potentially higher returns if well executed.
Interestingly, Class B/C properties have posted lower vacancy rates (~3%) than Class A (~8%) in recent quarters — due to affordability demand — but the true return calculus must factor in expenses, rent ceilings, and risk of turnover.
Investor Takeaways
Use cap rate maps as signals of risk, not just return.
Understand the operational burden behind higher yields — they may reflect friction, not opportunity.
Cap rate spreads reveal asset class truth — especially when comparing multifamily to credit-backed sectors.
Expect divergence by class and submarket — underwriting must be hyperlocal and asset-specific.
Cap rates are macro-sensitive — higher interest rates can tighten spreads and compress values fast.
Looking to position your asset for resale or value extraction? Start with our guide: Maximizing Your Multifamily Property’s Sale Potential
https://creconsult.net/chicago-multifamily-cap-rate-drivers/?fsp_sid=1152
Subscribe to:
Posts (Atom)
-
Just Listed: Golf Sumac Medical Offices | Des Plaines IL Price: $3,900,000 SF: 35,245 Stories: 3 Occupancy: 82.3% Cap Rate: 9.63% * Stabiliz...
-
REGISTER TODAY The Commercial Real Estate Symposium will provide junior and senior agents and brokers with valuable insights ...
-
The Chicago multifamily market remains one of the strongest in the country midway through 2025, with robust rent growth, competitive cap ra...


